High- dusty star-forming galaxies: a top-heavy initial mass function?
Abstract
Recent estimates point to abundances of sub-millimeter (sub-mm) galaxies far above model predictions. The matter is still debated. According to some analyses the excess may be substantially lower than initially thought and perhaps accounted for by flux boosting and source blending. However, there is no general agreement on this conclusion. An excess of dusty galaxies has also been reported albeit with poor statistics. On the other hand, evidence of a top-heavy initial mass function (IMF) in high- starburst galaxies has been reported in the past decades. This would translate into a higher sub-mm luminosity of dusty galaxies at fixed star formation rate, i.e., into a higher abundance of bright high- sub-mm galaxies than expected for a universal Chabrier IMF. Exploiting our physical model for high- proto-spheroidal galaxies, we find that part of the excess can be understood in terms of an IMF somewhat top-heavier than Chabrier. Such IMF is consistent with that recently proposed to account for the low 13C/18O abundance ratio in four dusty starburst galaxies at –3. However, extreme top-heavy IMFs are inconsistent with the sub-mm counts at .
1 Introduction
The opening of the sub-millimeter (sub-mm) window on galaxy formation and evolution, thanks to the m surveys with the Submillimeter Common-User Bolometer Array (SCUBA) on the James Clerk Maxwell Telescope (JCMT; e.g., Smail et al., 1997; Hughes et al., 1998; Barger et al., 1998), has revolutionized the field. SCUBA blank-field pointings demonstrated that the most active star formation phases of high- galaxies are heavily dust-enshrouded and therefore largely missed even by the deepest optical surveys (for a review see Casey et al., 2014). The results of these surveys have strongly shaken up the leading galaxy formation paradigm of the time which under-predicted the sub-mm counts by one order of magnitude or more (e.g., Kaviani et al., 2003; Baugh et al., 2005).
Part of the discrepancy was later shown to be attributable to an overestimate of the observed counts (Coppin et al., 2006; Geach et al., 2017), mainly due to source blending within the relatively large SCUBA beam and to insufficient corrections for flux boosting (Eddington bias; Eddington, 1913). Nevertheless, sub-mm data are still challenging for semi-analytic galaxy formation models (SAMs). In particular, SAMs generally under-predict the bright end of the star formation rate (SFR) function at (Niemi et al., 2012; Gruppioni et al., 2015).
A further challenge came from the first searches for sub-mm selected galaxies (Dowell et al., 2014; Asboth et al., 2016; Ivison et al., 2016): the inferred surface densities at flux densities larger than several tens mJy at m were found to be in excess of model predictions by about one order of magnitude. More recent studies (Donevski et al., 2018; Duivenvoorden et al., 2018) suggest that the discrepancy with models may be accounted for by flux boosting due to instrumental noise and confusion (including the contribution from clustering), plus source blending. However, the issue is not settled yet (see Section 2).
On the other hand, a key ingredient to understand the star formation process is the initial mass function (IMF), i.e., the relative number of newly formed stars as a function of their mass. It is still being debated whether or not the IMF is universal or varies with conditions in star-forming regions. Bastian et al. (2010), in their comprehensive review, concluded that the data available at the time did not provide “clear evidence that the IMF varies strongly and systematically as a function of initial conditions after the first few generations of stars”.
On the theoretical side, Padoan et al. (1997) presented a model whereby the IMF depends on the average physical parameters (e.g., temperature, density, and velocity dispersion) of the star formation sites111Note that in Padoan et al. (1997), “universality of the IMF” has a different meaning than in this paper. Following Bastian et al. (2010), by “universal IMF” we mean “IMF independent of conditions in star formation sites”. Instead, the IMF by Padoan et al. (1997) is universal in the sense that its functional form is a consequence of the statistics of random supersonic flows but varies with local properties. . The model predicts a larger fraction of massive stars (i.e., a top-heavier IMF) in starbursts. In starburst galaxies the cosmic ray energy densities generated by the deaths of the most massive stars may raise the gas temperatures even in the coolest star-forming clouds, thus increasing the Jeans mass, hence the characteristic stellar mass, i.e., the IMF shape (Papadopoulos et al., 2011). Chiosi et al. (1998) argued that this model alleviates or solves some difficulties faced by models for the formation and evolution of elliptical galaxies.
Recently, observational evidence of a top-heavy IMF (i.e., of an IMF with more massive stars than expected from canonical IMFs, such as that by Chabrier 2003 or by Kroupa et al. 2013) have been reported to account for the low 13C/18O abundance ratio found in both local ultraluminous infrared galaxies (Sliwa et al., 2017; Brown & Wilson, 2019) and in four gravitational lensed sub-mm galaxies at –3 (Zhang et al., 2018).
A greater abundance of massive stars at high- translates into a higher sub-mm luminosity of dusty galaxies at fixed SFR, i.e., into a greater abundance of sub–mm bright galaxies than expected under the assumption of a universal IMF. How do the counts of high- galaxies implied by the top-heavier IMFs proposed by Zhang et al. (2018) compare with observations?
To address this question we need a physical model, linking the IR luminosity of galaxies to their star formation history, taking also into account the effect of active galactic nuclei (AGNs) growing in their centers. The physical model by Cai et al. (2013), briefly described in Section 3, allows us to carry out this investigation. The baseline model adopts a Chabrier (2003) IMF, assumed to be universal. This IMF is described by a broken power-law: with for and for , where is the stellar mass and the number of stars within .
An extremely top-heavy IMF () was previously proposed by Baugh et al. (2005) to bring the counts of sub-mm galaxies predicted by their semi-analytic model into agreement with observations. Less top-heavy IMFs have been invoked by Lacey et al. (2016) and Cowley et al. (2019) to predict sub-mm counts. However other models (e.g., Granato et al., 2004; Cai et al., 2013) accounted for the sub-mm counts adopting a standard (Chabrier, 2003) IMF. None of these models considered the counts of sub-mm selected galaxies at or .
In Section 4 we investigate the effect of a top-heavier than Chabrier IMF on several observables. In Section 5 we summarize and discuss our main conclusions. Throughout this paper we adopt a flat CDM cosmology with the latest values of the parameters derived from Planck Cosmic Microwave Background (CMB) power spectra: and (Planck Collaboration VI, 2018).
2 Dusty star-forming galaxies at
2.1 Summary of relevant observations
The sub-mm extragalactic surveys with the Herschel Space Observatory at wavelengths extending over the peak of the dust emission spectrum up to high redshifts, have made possible to select candidate high- galaxies. The first searches for galaxies were carried out by Dowell et al. (2014), Asboth et al. (2016), and Ivison et al. (2016). They used Herschel Spectral and Photometric Imaging Receiver (SPIRE) flux densities at 250, 350, and m to search for sources with red colors, indicative of high . Since the spectral energy distribution (SED) of local ultraluminous dusty star-forming galaxies typically peaks at rest-frame wavelengths m, the SEDs of dusty star-forming galaxies are expected to typically peak at m in the observer’s frame ( risers).
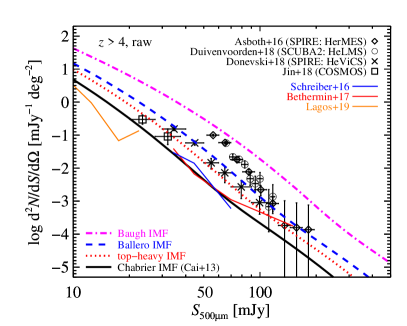
On this basis Dowell et al. (2014) selected sources having and mJy in three fields, part of the Herschel Multi-tiered Extragalactic Survey (HerMES; Oliver et al., 2012), totaling an area of . Follow-up spectroscopy of the first 5 of the 38 sources selected in this way showed that 4 have in the range 4.3–6.3 and the fifth has , confirming their method is efficient at selecting high- dusty galaxies. After correcting for completeness and purity, the surface density of risers with mJy was found to be . For comparison, the Cai et al. (2013) model predicted galaxies above at this flux density limit. The discrepancy with the Béthermin et al. (2017) model amounts to about a factor of 10.
Asboth et al. (2016) adopted the same search technique over a much larger area ( of the HerMES Large Mode Survey (HeLMS) field), with a shallower flux density limit (mJy). Measurements of the spectroscopic redshifts of 2 of their 477 galaxies yielded and 3.8. The size of their sample allowed them to compute, for the first time, differential number counts. By means of Monte Carlo simulations they estimated the intrinsic number counts, taking into account corrections for completeness, Eddington bias, false detections, and blending effects. Their results are consistent with the excess reported by Dowell et al. (2014).
Ivison et al. (2016) selected sources detected over the of the Herschel Astrophysical Terahertz Large Area Survey (H-ATLAS; Eales et al., 2010) with mJy, , and . Sub-mm images with SCUBA-2 and with LABOCA were obtained for a suitably chosen subset of these sources. Photometric redshifts were estimated comparing the observed sub-mm SEDs with those of three well sampled SED templates, found to be representatives of high- dusty star-forming galaxies. In this way, the redshift distribution was derived. The fraction of galaxies was found to be . Their surface density is , somewhat lower than, but consistent with the estimate by Dowell et al. (2014) and substantially higher than the Cai et al. (2013) and the Béthermin et al. (2017) predictions.
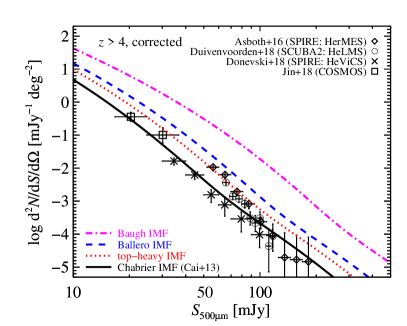
However, as suggested by more recent studies (Donevski et al., 2018; Duivenvoorden et al., 2018), the discrepancy with models may be accounted for by flux boosting and source blending. Donevski et al. (2018) used the criteria of Dowell et al. (2014) to select risers over of the Herschel Virgo Cluster Survey (HeViCS; Davies et al., 2010) down to a deeper flux density limit at m: mJy. They extracted sources from multi-wavelength maps with a code combining priors on positions and SEDs. Duivenvoorden et al. (2018) performed SCUBA-2 follow-up observations of 188 of the brightest 200 sources (mJy) selected by Asboth et al. (2016) and estimated their redshifts by SED fitting. Both groups used model-based simulations to correct the raw counts for the effects of flux boosting and of source blending. On this footing they found consistency with model predictions (see Figure 1).
Jin et al. (2018) have published a “super-deblended” far-infrared to (sub)mm photometric catalogue in the Cosmic Evolution Survey (COSMOS) field with spectroscopic or photometric redshifts. We have extracted from their catalogue sources with mJy and signal to noise ratio and derived their differential number counts after applying the correction for flux boosting (cf. Equation (1)). Again, the corrected counts are consistent with model predictions.
2.2 Potential observational biases
A strong effect of flux boosting on the counts of galaxies is indeed expected as a consequence of their steep slope. As shown by Hogg & Turner (1998), in the case of Gaussian noise, the ratio of the maximum likelihood true flux, , to the observed flux, , is related to the slope of the integral counts, , and to the signal-to-noise ratio, , by
| (1) |
The observationally determined counts shown in Figure 1 consistently indicate, for galaxies, , implying that there is no finite maximum likelihood value for . For , close to the critical value , and , usually taken as the threshold for reliable detections, we have and 0.757, respectively. This bias in the measured flux density translates in a bias in the integral source counts of , i.e., of factors of 4.7 and 2.7, respectively, for the two values of . Note that these are just examples to illustrate that noise has indeed a strong impact on observed counts.
This simple estimate does not account for the non-Gaussian, spatially correlated fluctuations due to clustering as well as for the complexity of source selection. Both Donevski et al. (2018) and Duivenvoorden et al. (2018) have extensively used simulations from Béthermin et al. (2017) to evaluate their selection method. To deal with these effects, Béthermin et al. (2017) have produced a simulation of the extragalactic sky from m to 1.3 mm, called SIDES (Simulated Infrared Dusty Extragalactic Sky). The simulation uses an updated version of the empirical model by Béthermin et al. (2012, 2015) and includes clustering based on the spatial distribution of dark matter halos yielded by a state-of-the-art -body simulation; halos are populated with galaxies using abundance matching. Since a cone is too small to provide enough statistics on the rare sources selected by most of the studies mentioned above, Béthermin et al. (2017) built also a simulation, which however does not contain clustering. The simulation of the full source extraction showed that the combination of noise, source blending, and weak lensing can dramatically boost the number density of red sources selected with the criteria by Asboth et al. (2016), compared to their real number density. This conclusion contradicts that by Asboth et al. (2016) who also used simulations to support their surface density estimates. Béthermin et al. (2017) explained the contradiction claiming that they have identified a potentially incorrect assumption in the simulation by Asboth et al. (2016).
Béthermin et al. (2017) attributed a substantial contribution to the number density overestimate to an overestimate of source flux densities at m due to multiple sources within the relatively large Herschel beam (source blending) at this wavelength; according to their simulation only of the measured flux density comes from the brightest source within the beam. Accounting for these effects can reconcile observations with model predictions. Béthermin et al. (2017) however acknowledged that correcting the observed counts for all the observational effects is a complex task and that their approach has limitations.
The issue is not settled, however. None of the galaxies, drawn from the sample of candidates selected by Ivison et al. (2016), observed by Fudamoto et al. (2017) in 1.3– or 3–mm continuum using the Northern Extended Millimeter Array (NOEMA) and Atacama Large Millimeter Array (ALMA) were found to be affected by blending, as would be expected from simulations of Béthermin et al. (2017); multiplicity may affect at most the per cent of their targets that remained undetected in continuum.
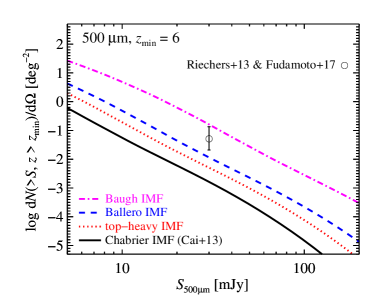
Further hints of a high- excess come from searches of dusty galaxies. Riechers et al. (2013) found a galaxy at in a sample with ultra-red Herschel/SPIRE colours with mJy over an area of . The corresponding surface density is (Poisson errors). A second galaxy (at ) was reported by Fudamoto et al. (2017) and Zavala et al. (2018). This galaxy belongs to a sample of the reddest Herschel/SPIRE galaxies over the H-ATLAS area (), again with mJy. Taking into account the correction for the incompleteness of the parent sample (a factor of ; Ivison et al., 2016) we get . The average of the two estimates is (see Figure 2).
3 Model
While at star formation mostly occurs in late-type galaxies (spiral, irregular, and disky starburst galaxies), at the high redshifts of interest here the observed IR/sub-mm galaxy luminosity functions are dominated by proto-spheroids, i.e., by ellipticals and bulges of disk galaxies in the process of forming the bulk of their stars (e.g., Granato et al., 2004; Thomas et al., 2010; Silk & Mamon, 2012). The Cai et al. (2013) model provides a physically grounded description of their formation and evolution, building on the work by Granato et al. (2004), Lapi et al. (2006), and Lapi et al. (2011).
The model adopts the halo formation rate, , as a function of redshift, , and of halo mass, , yielded by large-scale -body simulations. For the is well approximated by the positive term of the derivative with respect to cosmic time of the epoch-dependent halo mass function. For the latter, the analytical approximation by Sheth & Tormen (1999) was used. High resolution -body simulations (e.g., Wang et al., 2011) have identified two phases of the halo evolution. A first fast collapse phase, including major mergers, forms the bulk of its mass. The following phase produces a slow growth of the halo outskirts by many minor mergers and diffuse accretion. This second stage has little effect on the inner potential well where the visible galaxy resides. Based on these results, the model assumes that the star formation and the AGN growth are basically regulated by in-situ processes, as confirmed by subsequent high-resolution simulations (e.g., Pillepich et al., 2015). The star formation history of proto-spheroids with any halo mass and formation redshift and the accretion history onto the central super-massive black holes are computed by solving a set of equations describing the evolution of gas phases and of the active nucleus, including the effect of cooling, condensation into stars, radiation drag, accretion, and feedback from supernovae (SNe) and from the AGN.
These equations yield the SFR of each galaxy and the bolometric luminosity of the AGN as a function of halo mass, formation redshift, and galactic age. The SFR was converted to the total infrared (IR; 8–m) luminosity using the standard calibration (e.g., Kennicutt & Evans, 2012). The epoch-dependent bolometric luminosity functions of galaxies, of AGNs, and of objects as a whole (galaxy plus AGN) are computed coupling luminosities with the halo formation rate.
To derive monochromatic luminosity functions, the SED of the strongly lensed galaxy SMM J2135-0102 (Swinbank et al., 2010), modeled using the GRASIL software package (Silva et al., 1998) was adopted for the dusty galaxy component. This SED was found to be representative of high- dusty galaxies (González-Nuevo et al., 2012; Ivison et al., 2016). For AGNs two main phases of the co-evolution with the galaxy component were considered. For the first phase, when the black-hole growth is enshrouded by the dusty interstellar medium (ISM) of the host galaxy, a heavily absorbed AGN SED, taken from the library by Granato & Danese (1994), was adopted. For the second phase, when the AGN shines after having swept out the galaxy ISM, we adopted the mean QSO SED by Richards et al. (2006), extended to sub-mm wavelengths assuming a grey-body emission with dust temperature and emissivity index .
After determining the values of the parameters from a comparison with a set of multi-frequency luminosity functions (see Cai et al., 2013, for details) the model successfully reproduced a broad variety of data: multi-frequency and multi-epoch luminosity functions of galaxies and AGNs beyond those used for the model calibration, counts of unlensed and gravitationally lensed sources, redshift distributions, and clustering properties (Xia et al., 2012; Cai et al., 2013, 2014; Carniani et al., 2015; Bonato et al., 2017). In particular the model accounts for the redshift-dependent IR luminosity function determined by Gruppioni et al. (2013) up to (Bonato et al., 2014) and fits the most recent mm and sub-mm counts and redshift distributions (Bonato et al., 2019; Gralla et al., 2019; De Zotti et al., 2019) as well as the SED and the power spectrum of the cosmic infrared background (Cai et al., 2013).
4 A top-heavier IMF?
The bolometric luminosity of a young stellar population is dominated by massive, short-lived, UV-producing stars (e.g., Kennicutt, 1998; Madau et al., 1998). Hence it is approximately proportional to the mass fraction in massive () stars. For the heavily dust obscured galaxies of interest here, . The calibration of the relationship between and SFR for complete dust obscuration adopted by Cai et al. (2013) refers to the Chabrier IMF (Chabrier, 2003) whose power-law indices below and above are -0.4 and -1.35, respectively (in terms of ). It writes
| (2) |
with . The IMFs suggested by Zhang et al. (2018) have power-law indices below and above , respectively, of -0.3 and -1.1 for the “top-heavy” IMF (Zhang et al., 2018) and of -0.3 and -0.95 for the “Ballero” IMF (Ballero et al., 2007).
The mass fractions in the 8– range are of 23%, 33%, and 44% for the “Chabrier”, “top-heavy”, and “Ballero” IMF, respectively. Thus the bolometric luminosity at fixed SFR increases, compared to the “Chabrier” case, by factors of and of for the “top-heavy” and “Ballero” IMF, respectively. In the extreme case of the flat IMF (i.e., ) used by Baugh et al. (2005) for starbursts, the mass fraction in stars increases by a factor .
Zhang et al. (2018) mention a factor of 6–7 increase in the mass fraction of massive stars moving from the “Kroupa” (Kroupa et al., 2013) to the “Ballero” IMF. This may look in conflict with the substantially lower factor we find for the “Chabrier” case since the “Kroupa” IMF is generally considered to give a relation between and SFR almost identical to the “Chabrier” IMF (e.g., Chomiuk & Povich, 2011). However, Zhang et al. (2018) refer to a version of the Kroupa IMF with a much lower fraction of massive stars (8.6%)222The fraction of massive stars () reported in Table 1 of Zhang et al. (2018) for the “Kroupa” IMF (6.9%) is a typo which does not affect their chemical evolution models (Zhi-Yu Zhang, private communication). With the corrected fraction of massive stars, 8.6%, the increase from their “Kroupa” to the “Ballero” IMF is a factor of . than that (23%) yielded by the IMF adopted by Cai et al. (2013).
The IMFs impinges also on other quantities: the supernova (SN) rate and the fraction, , of the mass of a stellar generation that returns to the interstellar medium (restitution fraction). Both factors affect the evolution of the metallicity and of the SFR. An increase of makes more material available for star formation while feedback effects are obviously stronger for higher SN rates, with the effect of decreasing the SFR.
SNe dominate feedback effects not only for less massive galaxies but also for most of the intense star formation phase of massive galaxies. The AGN feedback takes over in the latter objects only during the last few e-folding times of the central black hole growth. The fraction of stars per stellar generation that explode as SNe, i.e., the ratio of the number of stars more massive than to the total number of stars, is for the “Chabrier” IMF and increases to , 2.2%, and 37% for the “top-heavy”, “Ballero”, and “Baugh” IMFs, respectively. The corresponding parameter defined in Cai et al. (2013) is the number of SNe per unit solar mass of condensed stars: , , , and , for the “Chabrier”, “top-heavy”, “Ballero”, and “Baugh” IMFs, respectively.
The restitution fraction, , affects the SFR and the chemical evolution. It depends on the minimum mass, , of stars with lifetimes not exceeding the age of the universe at the considered redshift. We set since the lifetime of a star of that mass with solar metallicity is slightly lower than the age of the universe at (Gyr) for our choice of cosmological parameters. For , , 0.466, 0.56, and 0.83 for the “Chabrier”, “top-heavy”, “Ballero”, and “Baugh” IMFs, respectively. After having checked that the results are very weakly sensitive to the choice for , we have neglected its dependence on metallicity and used the same value for proto-spheroids at all redshifts. Note however that at the dominant star-forming population are late-type galaxies, for which we have kept the same model used by Cai et al. (2013).
For each of the considered IMFs we have re-run the code solving the set of equations written down by Cai et al. (2013). To compute observable quantities such as number counts or luminosity functions, the output of these calculations, i.e., the SFR and the bolometric luminosity of the central AGN as a function of halo mass, formation redshift, and galactic age, need to be coupled with the SEDs of source populations.
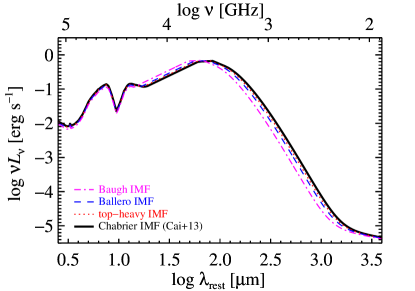
We have kept the AGN SEDs used by Cai et al. (2013). In the case of dust luminosities powered by star formation, we need to take into account that higher luminosities entail, on average, higher dust temperatures, i.e., warmer SEDs (Schreiber et al., 2018; Liang et al., 2019). Since a sophisticated treatment is not warranted in this exploratory study we have taken this into account by assuming that the effective dust temperature, , hence the peak frequency of the dust emission, , scales as (e.g., Liang et al., 2019). Then, for different IMFs, ; the full continuum SED was shifted in frequency by the corresponding factor. Figure 3 shows the SEDs associated to the considered IMFs. This approach assumes, for each choice of the IMF, the same effective SED for all galaxies. This is clearly an approximation, necessary to keep the model manageable and justified by its capability of accounting for a broad variety of data.
Cai et al. (2013) adopted and . These values differ from the values given above for the “Chabrier” IMF because of a slightly different way of computing and of the choice of a lower ( instead of ) motivated by the fact that the focus was on lower redshifts. We have re-run the model with the new values and used the results of the updated model. The differences in the derived IR luminosity functions for the “Chabrier” IMF turned out to be irrelevant.
Figure 1 shows that the observed raw m counts of galaxies are consistently and substantially above the predictions of the baseline Cai et al. (2013) model, which adopted a universal Chabrier (2003) IMF. Taken at face value they strongly favor a top-heavier IMF such as the “top-heavy” or the “Ballero”; the extreme “Baugh” IMF is however inconsistent with the data. A similar indication comes from the estimate at (Figure 2). The correction factors derived from the Béthermin et al. (2017) simulations bring the data close to agreement with the baseline model. However, several of the corrected data points are still consistent, within the uncertainties, with a top-heavy IMF; the main exception to that are the counts by Donevski et al. (2018). High resolution follow-up of the two galaxies did not show indications of blending, so that no substantial correction appears to be necessary. However the statistical uncertainty of this data point is large.
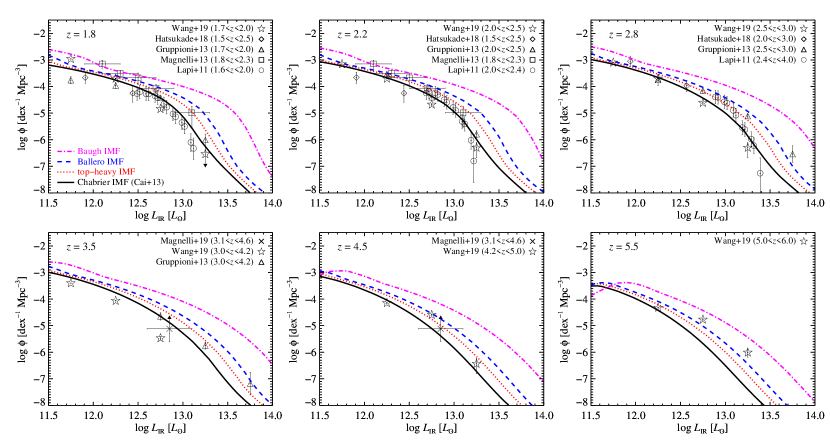
Figure 4 compares the observed total IR (m) luminosity functions at to with results for the baseline Cai et al. (2013) model (black solid lines) and the other choices for the IMF. The comparisons with observational estimates of Magnelli et al. (2013), Hatsukade et al. (2018), Magnelli et al. (2019), and Wang et al. (2019) are new. The samples used by Gruppioni et al. (2013) and by Magnelli et al. (2013) were drawn from deep surveys with the Herschel Photodetector Array Camera and Spectrometer (PACS) which has a better angular resolution than Herschel/SPIRE. These data are therefore much less affected by confusion and blending problems.
Wang et al. (2019) used Herschel/SPIRE data in the COSMOS field but exploited the rich, deep multi-frequency data available in this field and the SIDES empirical model to deblend and deconfuse the Herschel/SPIRE images. In this way they were able to extend the sub-mm source counts by more than a factor of 10 below the confusion limit and to extend estimates of the IR luminosity function to fainter luminosities and out to higher redshifts (up to ) than Gruppioni et al. (2013). The IR luminosity functions computed by Hatsukade et al. (2018) and by Magnelli et al. (2019) are based on high resolution ALMA surveys and are therefore unaffected by confusion and blending.
The baseline model by Cai et al. (2013) yields results in remarkable agreement with the luminosity function data, especially at and . An excess shows up especially at the highest redshifts (, 4.5, and 5.5). The significance of the discrepancy is hard to assess, however, because the published errors are purely Poisson while much larger uncertainties may be associated to the source selection, to photometric redshifts, and to the deblended photometry. Errors preferentially shift sources from more populated to less populated redshift/luminosity bins (an effect analogous to the Eddington bias), implying that the number of rare highest luminosity/redshift sources may be easily overestimated. However, taken at face value, these data support the view of an excess of high- sub-mm galaxies that may require a top-heavier IMF, such as the “top-heavy” or the “Ballero”, to be accounted for. Again, the “Baugh” IMF implies source densities well in excess of observations.
5 Conclusions
We have exploited the physical model by Cai et al. (2013) to investigate the impact of a top-heavy IMF on sub-mm counts of high- ( and ) dusty galaxies.
The first estimates of sub-mm counts at galaxies (Dowell et al., 2014; Asboth et al., 2016; Ivison et al., 2016), taken at face value, favor the top-heavier IMFs suggested by Zhang et al. (2018). On the contrary, the extreme (flat) IMF used by Baugh et al. (2005) overpredicts, in the framework of the Cai et al. (2013) approach, counts for .
If the “raw” counts are corrected for flux boosting due to instrumental noise and confusion following some recent studies (Béthermin et al., 2017; Donevski et al., 2018; Duivenvoorden et al., 2018), approximate consistency with predictions based on a universal “Chabrier” IMF is recovered. On the other hand, with the exception of the counts by Donevski et al. (2018), the corrected data points are also consistent, within the uncertainties, with a top-heavy IMF. A definite conclusion on the abundance of sub-mm galaxies must await for higher resolution data and a much higher fraction of spectroscopic redshifts.
From the theoretical point of view an increase of the Jeans mass is expected in the case of high SFRs due to the large cosmic ray energy densities which raise the gas temperatures (Papadopoulos et al., 2011). A further increase of gas temperatures with increasing is expected by effect of the raising CMB temperature (Zhang et al., 2016). The data indeed give hints of an excess of sub-mm galaxies over expectations for a universal IMF (Figure 2 and bottom-right panel of Figure 4). However they are liable to large errors, arising from photometric redshift estimates, particularly tricky at these redshifts, from model extrapolations to infer from mid-IR photometry, from the de-blending process, and from field-to-field variations. These errors are difficult to quantify and are not discussed by Wang et al. (2019).
As suggested by Zhang et al. (2018), top-heavier IMFs than usually assumed have implications on SFRs derived from classical tracers such as or the radio continuum luminosity. In turn, this may impact on the star formation history of galaxies. However we have found that top-heavier IMFs than Chabrier consistent with the high- data imply only a moderate increase of the ratio (by factors of 1.4—-1.9). Nevertheless, it is clearly important to assess the evolution, if any, of the IMF with cosmic time.
In this paper we shown that the data already imply interesting constraints on the IMF of high- dusty galaxies. Forthcoming or planned sub-mm spectroscopic surveys, such as those with the Cerro Chajnantor Atacama Telescope (CCAT-prime; Stacey et al., 2018) or with the Origins Space Telescope (OST; Leisawitz et al., 2018; Bonato et al., 2019), will shed light on this issue.
Acknowledgements
We are grateful to the referee for a careful reading of the manuscript and detailed comments, to A. Bressan for very useful suggestions, to Zhi-Yu Zhang and D. Romano for their comments, and to S. Duivenvoorden for clarifications on their counts of galaxies. ZYC is supported by the National Science Foundation of China (grant Nos. 11890693, 11873045, and 11421303). GdZ acknowledges financial support by ASI/INAF Agreement 2014-024-R.0 for the Planck LFI activity of Phase E2.
References
- Asboth et al. (2016) Asboth, V., Conley, A., Sayers, J., et al. 2016, MNRAS, 462, 1989, doi: 10.1093/mnras/stw1769
- Ballero et al. (2007) Ballero, S. K., Kroupa, P., & Matteucci, F. 2007, A&A, 467, 117, doi: 10.1051/0004-6361:20066786
- Barger et al. (1998) Barger, A. J., Cowie, L. L., Sanders, D. B., et al. 1998, Nature, 394, 248, doi: 10.1038/28338
- Bastian et al. (2010) Bastian, N., Covey, K. R., & Meyer, M. R. 2010, ARA&A, 48, 339, doi: 10.1146/annurev-astro-082708-101642
- Baugh et al. (2005) Baugh, C. M., Lacey, C. G., Frenk, C. S., et al. 2005, MNRAS, 356, 1191, doi: 10.1111/j.1365-2966.2004.08553.x
- Béthermin et al. (2015) Béthermin, M., De Breuck, C., Sargent, M., & Daddi, E. 2015, A&A, 576, L9, doi: 10.1051/0004-6361/201525718
- Béthermin et al. (2012) Béthermin, M., Daddi, E., Magdis, G., et al. 2012, ApJ, 757, L23, doi: 10.1088/2041-8205/757/2/L23
- Béthermin et al. (2017) Béthermin, M., Wu, H.-Y., Lagache, G., et al. 2017, A&A, 607, A89, doi: 10.1051/0004-6361/201730866
- Bonato et al. (2014) Bonato, M., Negrello, M., Cai, Z. Y., et al. 2014, MNRAS, 438, 2547, doi: 10.1093/mnras/stt2375
- Bonato et al. (2017) Bonato, M., Negrello, M., Mancuso, C., et al. 2017, MNRAS, 469, 1912, doi: 10.1093/mnras/stx974
- Bonato et al. (2019) Bonato, M., De Zotti, G., Leisawitz, D., et al. 2019, PASA, 36, e017, doi: 10.1017/pasa.2019.8
- Brown & Wilson (2019) Brown, T., & Wilson, C. D. 2019, ApJ, 879, 17, doi: 10.3847/1538-4357/ab2246
- Cai et al. (2014) Cai, Z.-Y., Lapi, A., Bressan, A., et al. 2014, ApJ, 785, 65, doi: 10.1088/0004-637X/785/1/65
- Cai et al. (2013) Cai, Z.-Y., Lapi, A., Xia, J.-Q., et al. 2013, ApJ, 768, 21, doi: 10.1088/0004-637X/768/1/21
- Carniani et al. (2015) Carniani, S., Maiolino, R., De Zotti, G., et al. 2015, A&A, 584, A78, doi: 10.1051/0004-6361/201525780
- Casey et al. (2014) Casey, C. M., Narayanan, D., & Cooray, A. 2014, Phys. Rep., 541, 45, doi: 10.1016/j.physrep.2014.02.009
- Chabrier (2003) Chabrier, G. 2003, PASP, 115, 763, doi: 10.1086/376392
- Chiosi et al. (1998) Chiosi, C., Bressan, A., Portinari, L., & Tantalo, R. 1998, A&A, 339, 355. https://arxiv.org/abs/astro-ph/9708123
- Chomiuk & Povich (2011) Chomiuk, L., & Povich, M. S. 2011, AJ, 142, 197, doi: 10.1088/0004-6256/142/6/197
- Coppin et al. (2006) Coppin, K., Chapin, E. L., Mortier, A. M. J., et al. 2006, MNRAS, 372, 1621, doi: 10.1111/j.1365-2966.2006.10961.x
- Cowley et al. (2019) Cowley, W. I., Lacey, C. G., Baugh, C. M., et al. 2019, MNRAS, 487, 3082, doi: 10.1093/mnras/stz1398
- Davies et al. (2010) Davies, J. I., Baes, M., Bendo, G. J., et al. 2010, A&A, 518, L48, doi: 10.1051/0004-6361/201014571
- De Zotti et al. (2019) De Zotti, G., Bonato, M., Negrello, M., et al. 2019, Frontiers in Astronomy and Space Sciences, 6, 53, doi: 10.3389/fspas.2019.00053
- Donevski et al. (2018) Donevski, D., Buat, V., Boone, F., et al. 2018, A&A, 614, A33, doi: 10.1051/0004-6361/201731888
- Dowell et al. (2014) Dowell, C. D., Conley, A., Glenn, J., et al. 2014, ApJ, 780, 75, doi: 10.1088/0004-637X/780/1/75
- Duivenvoorden et al. (2018) Duivenvoorden, S., Oliver, S., Scudder, J. M., et al. 2018, MNRAS, 477, 1099, doi: 10.1093/mnras/sty691
- Eales et al. (2010) Eales, S., Dunne, L., Clements, D., et al. 2010, PASP, 122, 499, doi: 10.1086/653086
- Eddington (1913) Eddington, A. S. 1913, MNRAS, 73, 359, doi: 10.1093/mnras/73.5.359
- Fudamoto et al. (2017) Fudamoto, Y., Ivison, R. J., Oteo, I., et al. 2017, MNRAS, 472, 2028, doi: 10.1093/mnras/stx1956
- Geach et al. (2017) Geach, J. E., Dunlop, J. S., Halpern, M., et al. 2017, MNRAS, 465, 1789, doi: 10.1093/mnras/stw2721
- González-Nuevo et al. (2012) González-Nuevo, J., Lapi, A., Fleuren, S., et al. 2012, ApJ, 749, 65, doi: 10.1088/0004-637X/749/1/65
- Gralla et al. (2019) Gralla, M. B., Marriage, T. A., Addison, G., et al. 2019, arXiv e-prints, arXiv:1905.04592. https://arxiv.org/abs/1905.04592
- Granato & Danese (1994) Granato, G. L., & Danese, L. 1994, MNRAS, 268, 235, doi: 10.1093/mnras/268.1.235
- Granato et al. (2004) Granato, G. L., De Zotti, G., Silva, L., Bressan, A., & Danese, L. 2004, ApJ, 600, 580, doi: 10.1086/379875
- Gruppioni et al. (2013) Gruppioni, C., Pozzi, F., Rodighiero, G., et al. 2013, MNRAS, 432, 23, doi: 10.1093/mnras/stt308
- Gruppioni et al. (2015) Gruppioni, C., Calura, F., Pozzi, F., et al. 2015, MNRAS, 451, 3419, doi: 10.1093/mnras/stv1204
- Hatsukade et al. (2018) Hatsukade, B., Kohno, K., Yamaguchi, Y., et al. 2018, PASJ, 70, 105, doi: 10.1093/pasj/psy104
- Hogg & Turner (1998) Hogg, D. W., & Turner, E. L. 1998, PASP, 110, 727, doi: 10.1086/316173
- Hughes et al. (1998) Hughes, D. H., Serjeant, S., Dunlop, J., et al. 1998, Nature, 394, 241, doi: 10.1038/28328
- Ivison et al. (2016) Ivison, R. J., Lewis, A. J. R., Weiss, A., et al. 2016, ApJ, 832, 78, doi: 10.3847/0004-637X/832/1/78
- Jin et al. (2018) Jin, S., Daddi, E., Liu, D., et al. 2018, ApJ, 864, 56, doi: 10.3847/1538-4357/aad4af
- Kaviani et al. (2003) Kaviani, A., Haehnelt, M. G., & Kauffmann, G. 2003, MNRAS, 340, 739, doi: 10.1046/j.1365-8711.2003.06318.x
- Kennicutt (1998) Kennicutt, Robert C., J. 1998, ARA&A, 36, 189, doi: 10.1146/annurev.astro.36.1.189
- Kennicutt & Evans (2012) Kennicutt, R. C., & Evans, N. J. 2012, ARA&A, 50, 531, doi: 10.1146/annurev-astro-081811-125610
- Kroupa et al. (2013) Kroupa, P., Weidner, C., Pflamm-Altenburg, J., et al. 2013, The Stellar and Sub-Stellar Initial Mass Function of Simple and Composite Populations, ed. T. D. Oswalt & G. Gilmore, Vol. 5, 115
- Lacey et al. (2016) Lacey, C. G., Baugh, C. M., Frenk, C. S., et al. 2016, MNRAS, 462, 3854, doi: 10.1093/mnras/stw1888
- Lagos et al. (2018) Lagos, C. d. P., Tobar, R. J., Robotham, A. S. G., et al. 2018, MNRAS, 481, 3573, doi: 10.1093/mnras/sty2440
- Lagos et al. (2019) Lagos, C. d. P., Robotham, A. S. G., Trayford, J. W., et al. 2019, MNRAS, 489, 4196, doi: 10.1093/mnras/stz2427
- Lapi et al. (2006) Lapi, A., Shankar, F., Mao, J., et al. 2006, ApJ, 650, 42, doi: 10.1086/507122
- Lapi et al. (2011) Lapi, A., González-Nuevo, J., Fan, L., et al. 2011, ApJ, 742, 24, doi: 10.1088/0004-637X/742/1/24
- Leisawitz et al. (2018) Leisawitz, D., Amatucci, E., Carter, R., et al. 2018, in Society of Photo-Optical Instrumentation Engineers (SPIE) Conference Series, Vol. 10698, Proc. SPIE, 1069815
- Liang et al. (2019) Liang, L., Feldmann, R., Kereš, D., et al. 2019, MNRAS, 489, 1397, doi: 10.1093/mnras/stz2134
- Madau et al. (1998) Madau, P., Pozzetti, L., & Dickinson, M. 1998, ApJ, 498, 106, doi: 10.1086/305523
- Magnelli et al. (2013) Magnelli, B., Popesso, P., Berta, S., et al. 2013, A&A, 553, A132, doi: 10.1051/0004-6361/201321371
- Magnelli et al. (2019) Magnelli, B., Karim, A., Staguhn, J., et al. 2019, ApJ, 877, 45, doi: 10.3847/1538-4357/ab1912
- Niemi et al. (2012) Niemi, S.-M., Somerville, R. S., Ferguson, H. C., et al. 2012, MNRAS, 421, 1539, doi: 10.1111/j.1365-2966.2012.20425.x
- Oliver et al. (2012) Oliver, S. J., Bock, J., Altieri, B., et al. 2012, MNRAS, 424, 1614, doi: 10.1111/j.1365-2966.2012.20912.x
- Padoan et al. (1997) Padoan, P., Nordlund, A., & Jones, B. J. T. 1997, MNRAS, 288, 145, doi: 10.1093/mnras/288.1.145
- Papadopoulos et al. (2011) Papadopoulos, P. P., Thi, W.-F., Miniati, F., & Viti, S. 2011, MNRAS, 414, 1705, doi: 10.1111/j.1365-2966.2011.18504.x
- Pillepich et al. (2015) Pillepich, A., Madau, P., & Mayer, L. 2015, ApJ, 799, 184, doi: 10.1088/0004-637X/799/2/184
- Planck Collaboration VI (2018) Planck Collaboration VI. 2018, arXiv e-prints, arXiv:1807.06209. https://arxiv.org/abs/1807.06209
- Richards et al. (2006) Richards, G. T., Lacy, M., Storrie-Lombardi, L. J., et al. 2006, ApJS, 166, 470, doi: 10.1086/506525
- Riechers et al. (2013) Riechers, D. A., Bradford, C. M., Clements, D. L., et al. 2013, Nature, 496, 329, doi: 10.1038/nature12050
- Schreiber et al. (2018) Schreiber, C., Elbaz, D., Pannella, M., et al. 2018, A&A, 609, A30, doi: 10.1051/0004-6361/201731506
- Schreiber et al. (2016) —. 2016, A&A, 589, A35, doi: 10.1051/0004-6361/201527200
- Sheth & Tormen (1999) Sheth, R. K., & Tormen, G. 1999, MNRAS, 308, 119, doi: 10.1046/j.1365-8711.1999.02692.x
- Silk & Mamon (2012) Silk, J., & Mamon, G. A. 2012, Research in Astronomy and Astrophysics, 12, 917, doi: 10.1088/1674-4527/12/8/004
- Silva et al. (1998) Silva, L., Granato, G. L., Bressan, A., & Danese, L. 1998, ApJ, 509, 103, doi: 10.1086/306476
- Sliwa et al. (2017) Sliwa, K., Wilson, C. D., Aalto, S., & Privon, G. C. 2017, ApJ, 840, L11, doi: 10.3847/2041-8213/aa6ea4
- Smail et al. (1997) Smail, I., Ivison, R. J., & Blain, A. W. 1997, ApJ, 490, L5, doi: 10.1086/311017
- Stacey et al. (2018) Stacey, G. J., Aravena, M., Basu, K., et al. 2018, in Society of Photo-Optical Instrumentation Engineers (SPIE) Conference Series, Vol. 10700, Proc. SPIE, 107001M
- Swinbank et al. (2010) Swinbank, A. M., Smail, I., Longmore, S., et al. 2010, Nature, 464, 733, doi: 10.1038/nature08880
- Thomas et al. (2010) Thomas, D., Maraston, C., Schawinski, K., Sarzi, M., & Silk, J. 2010, MNRAS, 404, 1775, doi: 10.1111/j.1365-2966.2010.16427.x
- Wang et al. (2011) Wang, J., Navarro, J. F., Frenk, C. S., et al. 2011, MNRAS, 413, 1373, doi: 10.1111/j.1365-2966.2011.18220.x
- Wang et al. (2019) Wang, L., Pearson, W. J., Cowley, W., et al. 2019, A&A, 624, A98, doi: 10.1051/0004-6361/201834093
- Xia et al. (2012) Xia, J.-Q., Negrello, M., Lapi, A., et al. 2012, MNRAS, 422, 1324, doi: 10.1111/j.1365-2966.2012.20705.x
- Zavala et al. (2018) Zavala, J. A., Montaña, A., Hughes, D. H., et al. 2018, Nature Astronomy, 2, 56, doi: 10.1038/s41550-017-0297-8
- Zhang et al. (2016) Zhang, Z.-Y., Papadopoulos, P. P., Ivison, R. J., et al. 2016, Royal Society Open Science, 3, 160025, doi: 10.1098/rsos.160025
- Zhang et al. (2018) Zhang, Z.-Y., Romano, D., Ivison, R. J., Papadopoulos, P. P., & Matteucci, F. 2018, Nature, 558, 260, doi: 10.1038/s41586-018-0196-x