Anisotropy of Cosmic Ray Fluxes Measured with the Alpha Magnetic Spectrometer on the ISS
M. Molero 111Speaker 222on Behalf of the AMS Collaboration
Centro de Investigaciones Energéticas, Medioambientales y Tecnológicas (CIEMAT)
Departamento de Investigación Básica, E-28040
Madrid, Spain
miguel.molero@ciemat.es
J. Casaus, C. Mana, M.A. Velasco
Centro de Investigaciones Energéticas, Medioambientales y Tecnológicas (CIEMAT)
Departamento de Investigación Básica, E-28040
Madrid, Spain
I. Gebauer, M. Graziani
Karlsruhe Institute of Technology, Institute for Experimental Particle Physics, D-76131
Kalsruhe, Germany
M. Gervasi, G. La Vacca, P.G. Rancoita
INFN sez. Milano-Bicocca, Piazza della Scienza, 3 - 20126 Milano, Italy
Physics Department, University of Milano-Bicocca, Piazza della Scienza, 3 - 20126, Milano, Italy
Abstract: A measurement of the dipole anisotropy in galactic coordinates for different charged cosmic rays has been performed with the Alpha Magnetic Spectrometer (AMS) onboard the International Space Station (ISS). Results are presented for the first 7.5 years of data taking for protons, Helium, Carbon and Oxygen, and 6.5 years for positrons and electrons. All the species are found to be consistent with isotropy and upper limits to the dipole amplitude have been computed. In particular, for energies above 16 GeV a limit of and at the 95% C.I. is found for positrons and electrons respectively. For rigidities above 200 GV a limit of , , and is obtained for protons, Helium, Carbon and Oxygen.
Talk presented at the 2019 Meeting of the Division of Particles and Fields of the American Physical Society (DPF2019), July 29–August 2, 2019, Northeastern University, Boston, C1907293.
1 Introduction
Precise measurements of the cosmic ray (CR) fluxes have been performed by AMS since its installation onboard the ISS in 2011. The results have revealed unpredicted features in their spectra that cannot be accounted within the current understanding of the production and propagation of galactic CRs.
On the one hand, the proton [1] and nuclei [2, 3] spectra deviate from a single power law and the spectral index progressively hardens above 200 GV. These effects may reveal the existence of local sources or a change in their propagation mechanisms.
On the other hand, the positron flux shows an excess above 25 GeV, followed by a sharp drop off above 284 GeV with a finite exponential energy cutoff at 810 GeV [4]. The observations cannot be explained by a pure secondary origin and for most of the explanations, the inclusion of primary sources is required; typically, being classified in two escenarios: dark matter and astrophysical sources [5, 6].
Furthermore, the electron flux shows an excess above 42 GeV which is well described in the entire energy range by using the sum of 2 power law components. Contrary to the positron flux, the electron flux does not have an energy cutoff below 1.9 TeV, and the nature of the electron excess indicates a different origin than from the positron one [7].
In all cases, the contribution of nearby sources may induce some degree of anisotropy in the arrival directions of the differenct CR species. Therefore, its measurement would support or disfavor some of the aforementioned scenarios.
2 The AMS-02 Detector
AMS-02 is a multipurpose particle physics detector installed onboard the ISS since the 19th of May 2011. It has been designed to carry out precise measurements of charged CRs in the GeV-TeV energy range. The detector has continuously collected data since its installation, with more than 140 billion of events recorded in more than 8 years. The end of the ISS is currently planned for 2024 and AMS will continue taking data until then.
The detector consists of different sub-detectors that measure the charge, energy, momentum (), or rigidity () independently. The key elements used for the present analysis are the following: a silicon tracker (STD) with an inner tracker (L2-L8) inside a permanent magnet and two outer layers (L1 and L9), one at the top and the other at the bottom of the detector; a transition radiation detector (TRD); a time of flight (TOF); a ring imaging Cherenkov detector (RICH); and an electromagnetic calorimeter (ECAL). A detailed description can be found in [8].
3 Selection
For all the different species used in this analysis a cut based selection has been applied.
In the case of the positron and electron samples, the selected events are required to be relativistic downward-going particles with measured velocity , to have a reconstructed shower in the ECAL, with a matched track in the tracker and the TRD, charge consistent with , and quality criteria are applied to ensure good accuracy of the track reconstruction. Further cuts on the TRD and ECAL estimators as well as good energy-momentum matching are used to reduce the proton background below the percent level [8, 9]. The total samples include positrons and electrons above 16 GeV. The selected events are grouped into 5 cumulative energy ranges from 16 to 350 GeV, with minimum energies 16, 25, 40, 65 and 100 GeV, respectively.
For the proton, Helium, Carbon and Oxygen selection, events are required to be downward-going particles and to have reconstructed track in the inner passing through the L1 (L1-L8) with an additional hit in the L9 (L1-L9) for protons. Quality criteria cuts in the reconstruction of the track are applied. Finally, consistency with the charge of the respective species is required [1, 2, 3]. The total number of selected events is , , and for protons, Helium, Carbon and Oxygen and for GV, where in this case the protons and nuclei are grouped into 9 cumulative ranges of minimum rigidity: 18, 30, 45, 80, 150, 200, 300, 500, 1000 GV.
4 Methodology
The measurement of a large scale anisotropy consists in the determination of the directionality of the CR flux in a coordinate system. For this analysis, all the results will be presented in galactic coordinates.
Directional fluctuations can be computed by comparing the map of selected events with a reference map; any deviation from this map might be regarded as a signal. The reference map describes the response of the detector to an isotropic flux and, therefore, a very precise understanding of the detector’s behavior is required. In particular, it is necessary to understand the geographical dependences of the efficiencies and its projection in galactic coordinates; if not taken into account properly some spurious signals might be detected.
To compute large scale anisotropies the flux is expanded in a basis of spherical harmonics,
| (1) |
where the are the real spherical harmonics of degree and order , with .. and ,,,…, and are the coefficients of the expansion, which determine the degree of the anisotropy.
The large scale anisotropy is described at first order by a dipole () and its projection onto 3 orthogonal directions (East-West, North-South and Forward-Backward). For the case of galactic coordinates the North-South (NS) direction is perpendicular to the galactic plane, the Forward-Backward (FB) is pointing to the galactic center, and finally the East-West (EW) completes the righ-handed coordinate system and is contained into the galactic plane. The three dipole components can be defined as
| (2) |
Finally, the dipole amplitude can be computed as follows
| (3) |
5 Anisotropy of protons and light nuclei
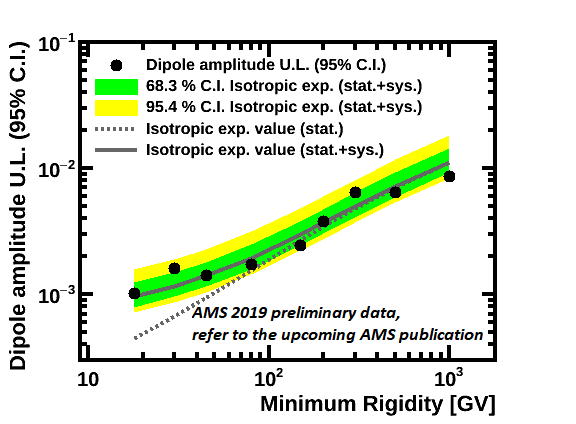
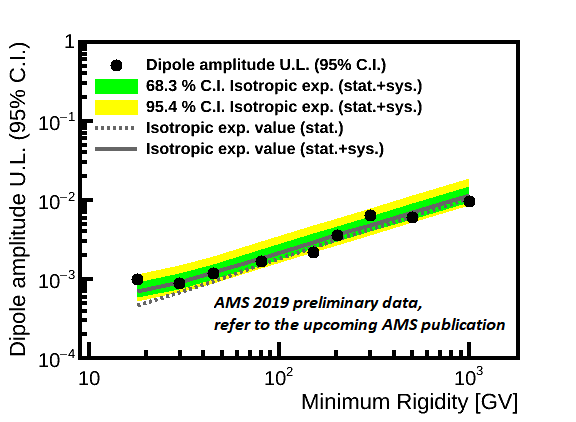
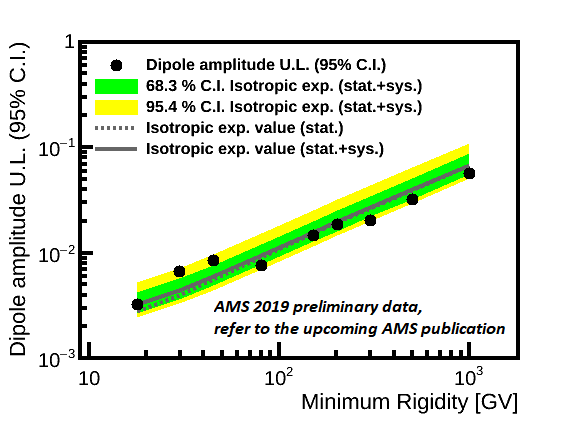
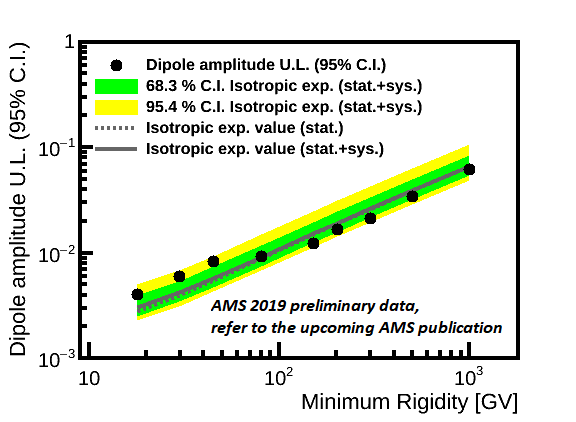
The method was applied to compute the anisotropy of protons, Helium, Carbon and Oxygen and no deviations from isotropy were found. Consequently, upper limits at the 95% C.I. have been set for all the different species and rigidity ranges of the analysis, Fig. 1 and Fig. 2. The limits obtained above 200 GV are and for protons, Helium, Carbon, and Oxygen respectively. In particular, in the case of protons for GV the measurement is limited by statistics. At lower rigidities, the systematics on the efficiency corrections limit the sensitivity to the per mil level (0.1%).
6 Anisotropy of positrons and electrons
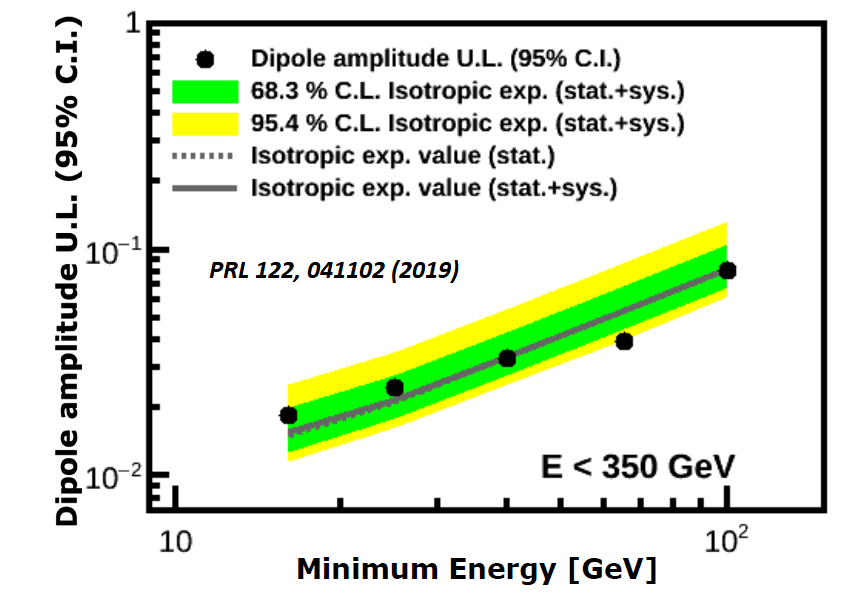
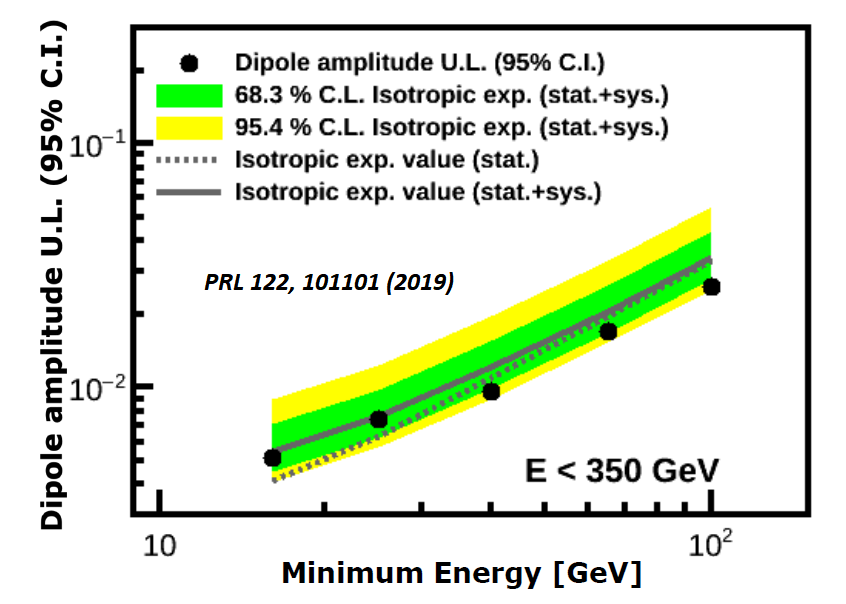
Following the same procedure for positrons and electrons the dipole components are also consistent with isotropy. Limits to the dipole amplitude at the 95% C.I. can be set for the different energy ranges, Fig. 3. In particular, for energies above 16 GeV a limit of and is obtained for positrons and electrons.
7 Conclusions
Measurement of the dipole anisotropy in galactic coordinates for protons, Carbon, Oxygen, positrons and electrons have been performed by the AMS-02 detector. The results are presented for the first 7.5 years of data taking for protons and light nuclei, and 6.5 years for the positrons and electrons. No deviations with respect to isotropy have been found, which allow to set limits at the 95% C.I. to the dipole amplitude for the different species presented in this analysis. In particular, for GV limits of and are obtained for protons, Helium, Carbon and Oxygen. For positrons and electrons, limits of and are found.
References
- [1] M. Aguilar et al. [AMS Collaboration], “Precision Measurement of the Proton Flux in Primary Cosmic Rays from Rigidity 1 GV to 1.8 TV with the Alpha Magnetic Spectrometer on the International Space Station”, Phys. Rev. Lett.114, 171103 (2015)
- [2] M. Aguilar et al. [AMS Collaboration], “Precision Measurement of the Helium Flux in Primary Cosmic Rays of Rigidities 1.9 GV to 3 TV with the Alpha Magnetic Spectrometer on the International Space Station”, Phys. Rev. Lett.115, 211101 (2015)
- [3] M. Aguilar et al. [AMS Collaboration], “Observation of the Identical Rigidity Dependence of He, C, and O Cosmic Rays at High Rigidities by the Alpha Magnetic Spectrometer on the International Space Station”, Phys. Rev. Lett.119, 251101 (2017)
- [4] M. Aguilar et al. [AMS Collaboration], “Towards Understanding the Origin of Cosmic-Ray Positrons”, Phys. Rev. Lett.122, 041102 (2019)
- [5] P. D. Serpico, “Atrophysical models for the origin of the positron excess” Astropat. Phys. 39-40, 2 (2012)
- [6] M. Di Mauro, F. Donato, N. Fornengo, A. Vittino, “Dark Matter vs. astrophysics in the interpretation of AMS-02 electron and positron data” JCAP, 1605, 031 (2016)
- [7] M. Aguilar et al. [AMS Collaboration], “Towards Understanding the Origin of Cosmic-Ray Electrons”, Phys. Rev. Lett.122, 101101 (2019)
- [8] M. Aguilar et al. [AMS Collaboration], “First Result from the Alpha Magnetic Spectrometer on the International Space Station: Precision Measurement of the Positron Fraction in Primary Cosmic Rays of 0.5-350 GeV”, Phys. Rev. Lett.110, 141102 (2013)
- [9] M. Aguilar et al. [AMS Collaboration], “High Statistics Measurement of the Positron Fraction in Primary Cosmic Rays of 0.5-500 GeV with the Alpha Magnetic Spectrometer on the International Space Station”, Phys. Rev. Lett.113, 121101 (2014)