Looped liquid-liquid coexistence in protein crystallization
Abstract
In view of the notorious complexity of protein–protein interactions, simplified models of proteins treated as patchy particles offer a promising strategy to obtain insight into the mechanism of crystallization. Here we report liquid–liquid phase separation (LLPS) with a highly asymmetric coexistence region in a computational model of rubredoxin with real molecular shape. The coexistence region terminates in both an upper (UCST) and a lower (LCST) critical solution temperature, and the complex molecular shape explains the closed-loop behavior of the LLPS.
Crystallization remains the primary technique permitting the discovery of more than 100,000 known protein structures pdb . However, understanding precisely how a protein solution becomes a protein crystal is both a fundamental challenge and an important question in biological materials design Hsia et al. (2016); Lai et al. (2012); Van Driessche et al. (2018); Simon et al. (2019). In computer models of crystallization, proteins are represented in terms of sticky, patchy spheres Vega and Monson (1998); Lomakin et al. (1999) or simple geometric objects Whitelam (2010); Haxton and Whitelam (2012) with short-rangedten Wolde and Frenkel (1997) and highly directional interactions Fusco and Charbonneau (2013); Whitelam (2010); Dorsaz et al. (2012); Staneva and Frenkel (2015); Khan et al. (2019). These models are described by a phase diagram that exhibits a fluid-solid transition and metastable liquid-liquid separation with an upper critical solution temperature (UCST). With additional input from all-atom simulations, they also predict the conditions at which experimental systems crystallize Fusco et al. (2014). These models have generated valuable insights into the possible nucleation mechanism of protein crystals. In particular, the prediction of enhanced nucleation near the metastable LL critical pointten Wolde and Frenkel (1997) has led to an intense search for improved crystallization rates of real proteins Galkin and Vekilov (2000); Vekilov (2005) close to their liquid-liquid binodal and has inspired related numerical models Xu et al. (2012); Galkin and Vekilov (2000). To the best of our knowledge, the nature of the metastable phase and its role in crystallization has not been investigated for more realistic patchy particle models Bianchi et al. (2006); Russo et al. (2011); Rovigatti et al. (2013), and the minimalistic nature even of patchy sphere models raises the question: is molecular shape wholly unimportant in the phase behavior of proteins?
Biomolecular solutions are known to exhibit liquid–liquid phase separation (LLPS) Ishimoto and Tanaka (1977); Thomson et al. (1987), which has recently come into focus as a possible generic explanation of biological self-organization. LLPS is believed to be responsible for the formation of membraneless organelles in biological cells and nuclei Brangwynne et al. (2009), biophotonic behavior Levenson et al. (2018) and biomineralization, such as in the formation of cytoskeletal filaments Falahati and Haji-Akbari (2019). In LLPS, the relevant components demix into two liquids of different composition or density. LLPS is predicted by computational models of, e.g. supercooled waterPalmer et al. (2014), silicon Vasisht et al. (2011), silica Saika-Voivod et al. (2001), tetrahedral liquids Smallenburg et al. (2014) and even hard polyhedra Lee et al. (2019). In schematic phase diagrams of protein crystallization ten Wolde and Frenkel (1997), the secondary liquid phase is usually metastable to the crystal phase, and the LL coexistence is reminiscent of a liquid-gas coexistence in simple liquids. However, in real biological systems LLPS can be considerably more complex and sometimes is associated with both a UCST and an LCST Zhang et al. (2012); Jiang et al. (2015); Falahati and Haji-Akbari (2019), which has yet to be reported in simulations of proteins. Here, we show that the region of protein crystallization lies between the binodals of LLPS, for a patchy particle model of rubredoxin with realistic shape. We find a liquid-liquid coexistence curve with both UCST and LCST behavior, and we link the asymmetric shape of the coexistence region to biomolecular shape.
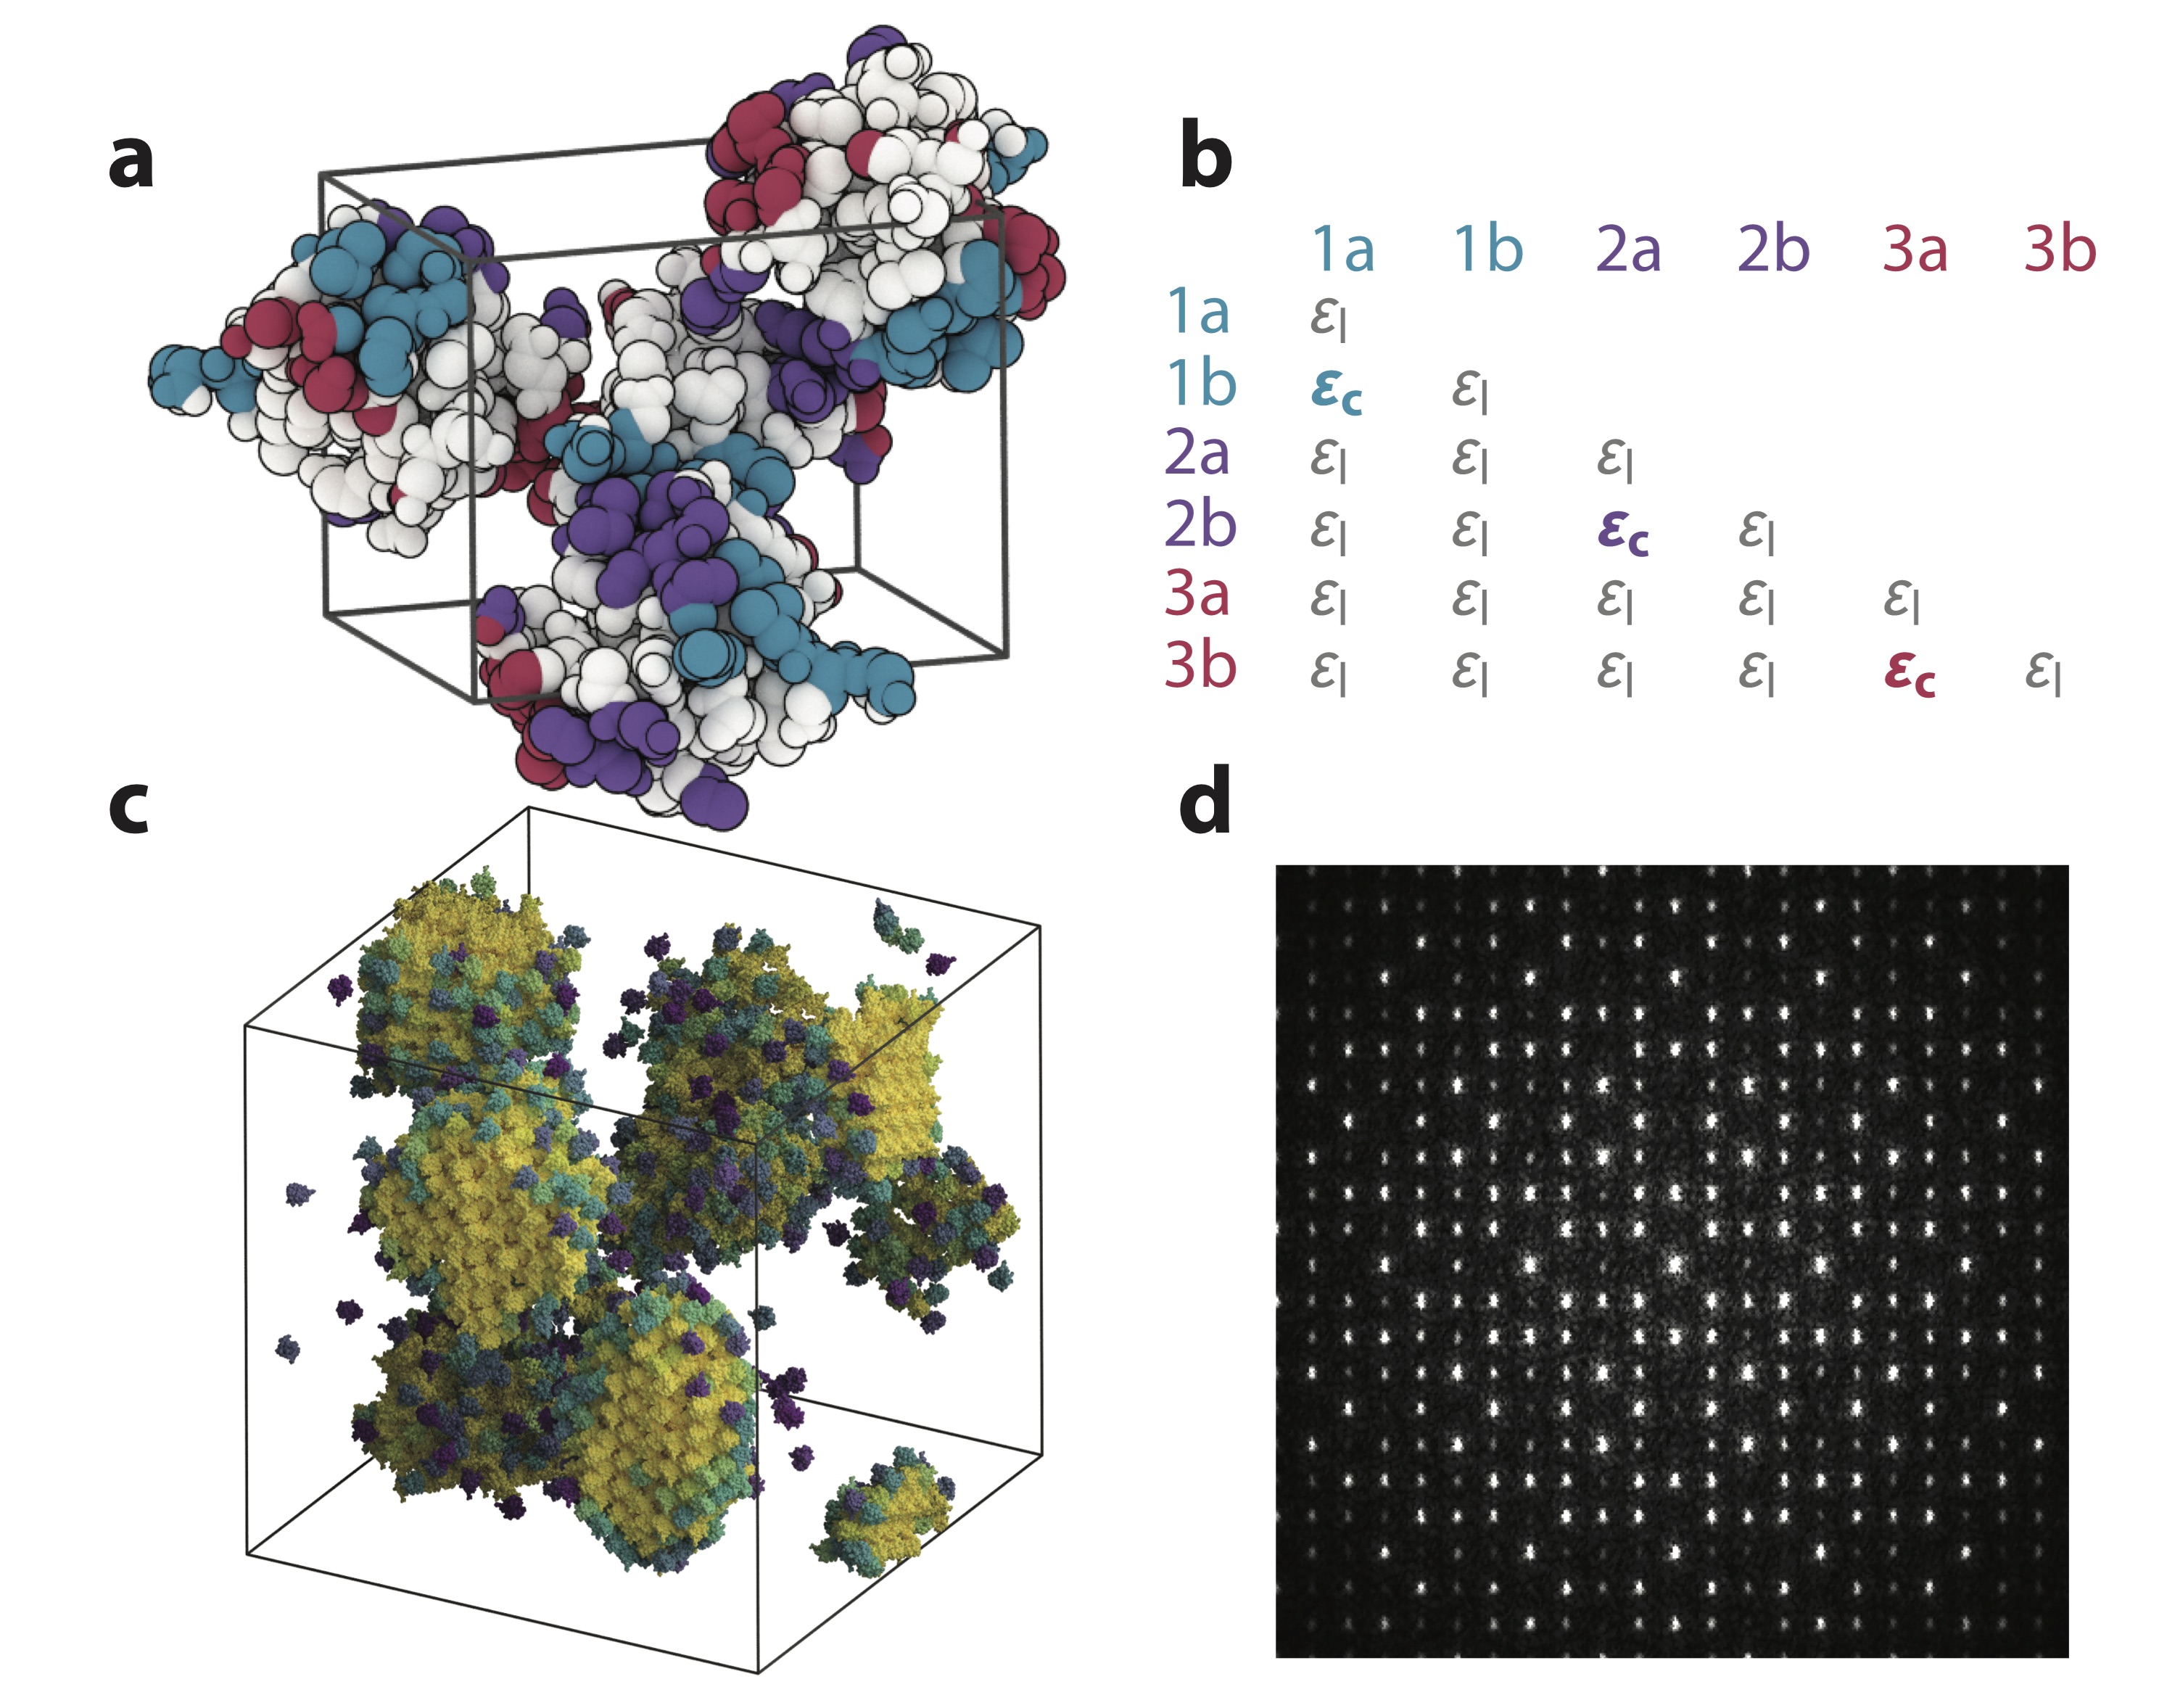
We investigate the nucleation mechanism of protein crystals with patchy attractive interactions between neighboring particles. Rubredoxin has three native interfaces with area and crystallizes into an orthorhombic structure with symmetry (see Fig. 1 and Supplemental Material) Bau et al. (1998). With its molecular weight of , this protein is a relatively small and approximately globular crystal former Bau et al. (1998). The interactions between native interfaces in a patchy sphere model for rubredoxin were previously parameterized based on all-atom MD simulations of its crystal interfaces Fusco et al. (2014); here, we use a more generic, two-parameter form of the interactions that allows for both native and non-native interactions. Native (or crystal-like) interactions, by definition, favor the crystal structure, whereas non-native (or liquid-like) ones favor the liquid phase. They are controlled by the parameters and , respectively. We simulated state points with proteins in the isothermal-isochoric (NVT) ensemble with implicit solvent. Figure 2a shows the phase behavior in the density–interaction strength plane. Strikingly, the phase diagram exhibits a metastable liquid–liquid transition, which is highly asymmetric, looped, and re-entrant with interaction strength. The coexistence region terminates in an upper and a lower critical point. We used an adaptive bias method – well-tempered metadynamics Barducci et al. (2008) – to find the densities of the coexisting metastable liquid phases (open circles) in simulations of proteins (see Supplemental Material). Together, the simulations required over node hours on the Summit supercomputer at Oak Ridge National Laboratory. By contrast, the fluid-solid coexistence curve exhibits the generic appearance expected from systems of spherical particles with very short-ranged attraction ten Wolde and Frenkel (1997); Lomakin et al. (1999); Fusco and Charbonneau (2013); Fusco et al. (2014). The pixels in the phase diagram are colored by the order parameter from direct simulation, which is proportional to the average number of native contacts per particle. Large values of indicate crystalline order. We observe a region of enhanced crystal yield near the center of the metastable coexistence region, which extends to higher densities beyond the binodal, suggesting that the formation of the high-density liquid is implicated in crystallization. Indeed, the crystallization pathway of a constant pressure simulation (white data points) passes through the high-density liquid (HDL) minimum of the Gibbs free energy surface (GFES) (Fig. 2b), but inspection of the trajectory shows that nucleation occurs well before the system reaches the basin. This observation is in accordance with the metastable character of the HDL; the nucleation event preempts the full transformation into the metastable phase. The HDL occurs locally, in the form of a fluctuation James et al. (2019). Structurally, it is characterized by ring-shaped pentagonal motifs of five proteins involving all three types of crystal contacts (Supplemental Material), which subsequently grow into the full crystal by classical nucleation and growth. In our well-tempered metadynamics simulations with global collective variables, nucleation events are still rare, but are under control of the bias potential. They can therefore occur at a different rate than in direct simulation, allowing the system to explore the HDL as a bulk phase. In this case, the HDL appears as a fluid where the pentagonal prenucleation motifs dominate, as opposed to the LDL, which is a fluid of monomers (Supplemental Material).
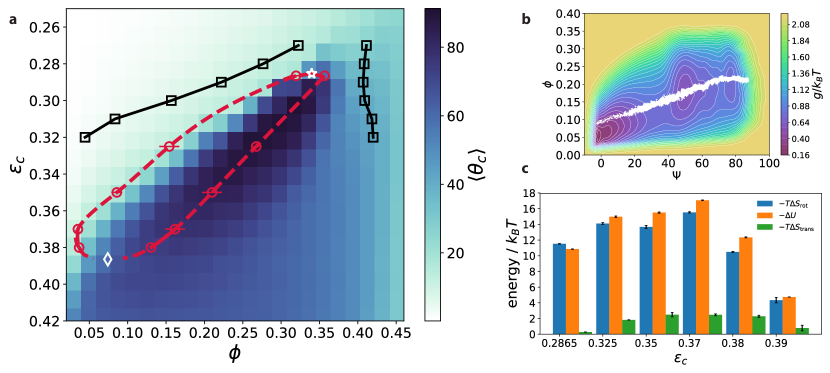
Patchy sphere models of proteins that stabilize native interfaces do not exhibit reentrant phase behavior Fusco et al. (2014), as opposed to models that are designed to exhibit multiple competing assembly motifs Rovigatti et al. (2013). Here, we find it in a protein model with a single self-assembled morphology and real molecular shape. To explain the asymmetric and reentrant character of the LLPS, we plot the individual contributions to the Gibbs free energy difference between the LDL and the HDL at coexistence in Fig. 2c, where . We expect that the HDL has both lower entropy and lower energy than the LDL. In fact, the considerable () potential energy difference between the two phases is almost completely balanced by the loss in rotational entropy in the HDL, whereas the loss in translational entropy is only on the order of . Therefore, we infer that the high reduction in the rotational degrees of freedom is a characteristic feature of our shape-based model. Specifically, when two shapes form a contact, the connection between the proteins is rigid due to the interlocking of their rugged surface features, and, additionally, because the energy depends on the contact angle. On the other hand, spherically symmetric models that employ a square-well potential allow for high bond flexibilityFusco et al. (2014). We hypothesize the following mechanism: since a protein-protein contact necessitates a large enthalpic gain to compensate for the loss of rotational freedom, the formation of ring-like prenucleation motifs in the HDL is strongly energetically favored. Smaller clusters such as dimers and trimers are already rigid, therefore ring closure eliminates a dangling contact, but does not incur an extra entropic penalty for the reduction of chain flexibility. As the interaction strength is increased, self-assembly into small aggregates also occurs in the LDL, reducing its . At values of below the LCST interaction strength , the enthalpic gain due to the assembly of nucleation precursors no longer compensates the rotational entropy loss, and the phases cease to coexist. The molecular geometry therefore qualitatively changes the protein phase diagram in a profound way: shape introduces a second critical point.
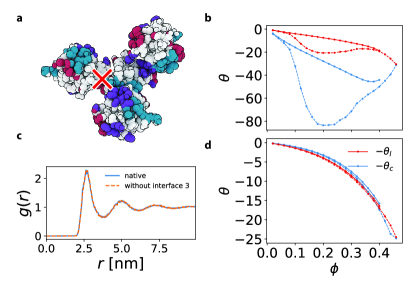
We aim to further elucidate the nature of the HDL and its character as a nucleation precursor phase. The fact that it remains elusive as a bulk phase on a typical nucleation pathway raises the question whether the HDL can exist independently of crystallization. To this end, we deactivate one of the crystal interfaces (Fig. 3a). From an analysis of the space group symmetry implied by the unique crystal interfaces Wukovitz and Yeates (1995) it follows that the smallest of the three interfaces of rubredoxin is required for symmetry (its associated symmetry operation is part of the minimal set of generators). Making that interface non-attractive () while leaving the two other interfaces unchanged results in a mutant protein that does not crystallize in our simulations. In experiment, the attractive character of this interface is controlled by salt concentration (attractive at , repulsive at NaCl) Fusco et al. (2014). We confirm that at interaction strengths above the UCST interaction strength , both structure (, Fig. 3c) and equation of state (Fig. 3d) remain unchanged (solid curve: full model, dashed curve: mutant), showing that the mutation is indeed point-like and does not affect the phase diagram for those values of . However, below the UCST, the different thermodynamic behavior is striking. The inflection in the equation of state, from which the coexisting LDL/HDL densities can be inferred in the full model via thermodynamic integration (Supplemental Material, Sec. III B), disappears in the mutant model, signifying that the LLPS is also absent in this model. This observation confirms that the HDL is indeed a nucleation precursor phase, and by introducing a mutation that prevents the formation of prenucleation motifs, the metastable LLPS can be eliminated altogether. More generally, our findings call into question whether the metastable HDL can exist independently of crystallization at all.
The best conditions for nucleation are thought to be close to the metstable LL critical point ten Wolde and Frenkel (1997). Not only do we observe an asymmetric coexistence region with both UCST and LCST, but also we find the crystal yield to be highest at intermediate values of between and . To explain the enhancement in protein crystal nucleation at those values, we analyze the free energy predicted by classical nucleation theory, . involves the chemical potential difference between solid and fluid phases, the surface tension between the solid and the fluid, and the solid density . is obtained directly from thermodynamic integration of the Gibbs free energy (Supplemental Material, Sec. III B), and it changes continuously across a phase transition. By contrast, cannot be inferred without definition of an interface, and may provide a discontinuous contribution to the nucleation barrier. We measure the surface tension of pre-critical nuclei based on their area distribution , as described in Supplemental Material. By plotting vs. (Fig. 4, solid curves) for different densities, we observe a sharp drop of one order of magnitude relative to its value above the UCST at with increasing . The surface tension has a well-defined minimum as a function of . This minimum strongly correlates with the region of optimal crystal yield (Fig. 2a).
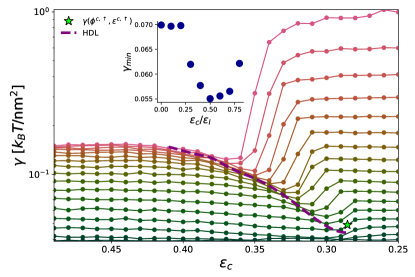
The knee in is bounded by the high density branch of the LL binodal (dashed line in Fig. 4), and the sharp inflection behavior of the vs. isochores mirrors the metastable LL transition, as can be seen from the location of the critical surface tension (star) in Fig. 4. An analogous feature in the surface tension isochores has been predicted for ternary systems (solid and two liquid phases near their critical point) by Cahn Cahn (1977), who explained it in terms of complete wetting of the solid phase by a layer of high density liquid. Despite the imperfect connection between macroscopic wetting phenomena and molecular aggregation on the nanoscale, we hypothesize that the occurence of ring-shaped, pentameric prenucleation motifs in the HDL can indeed lower the surface tension, as ring closure compensates for the enthalpic penalty associated with chain ends or incomplete motifs.
We find that the surface tension at a reference point in the phase diagram is lowest for an optimal value of the ratio of liquid-like to crystal-like interaction strength, see Fig. 4, inset. The non-monotonic dependence of the surface tension on confirms the “rule of thumb” Haxton and Whitelam (2012): for optimal crystallization the liquid-like interactions should be as strong as possible without inducing long-lived aggregates. In our case, the optimal value is . We did not find reports of the surface tension of protein crystals in the literature, so we estimate it based on the available values for purposes of comparison. For the insulin protein (PDB 4INS, molecular weight ), the known estimate of the critical step size of spiral dislocations in protein crystal growth, together with the chemical potential difference Reviakine et al. (2003), allows us to estimate the surface tension of rhombohedral insulin crystals with trimer motifs as . Such values were not found for rubredoxin. Despite the differences in molecular weight and crystal connectivity, this rough estimate is within an order of magnitude of the values displayed in Fig. 4, and suggests that the surface tension analysis predicts values of experimental relevance.
We predict a phase diagram for rubredoxin. To the best of our knowledge, such a phase diagram phase has not been experimentally established. However, our findings are in qualitative agreement with metastable liquid–liquid transitions that exhibit UCST and LCST behavior, such as observed in lysozyme Muschol and Rosenberger (1997), -lactoglobulin Zhang et al. (2011) and human serum albumin Zhang et al. (2012). In experiment, the primary factors affecting the strength of native interactions are the solvent conditions, which are controlled by pH, temperature, addition of mono- or multivalent salt and polymeric precipitants. Taken together, both the simplicity of our model and the remarkable impact of shape on the phase diagram suggests that an asymmetric, metastable LLPS loop may be the norm rather than the exception in proteins, and that it can be tuned by relatively minor surface modifications using a mutagenesis strategy.
Acknowledgments
We acknowledge fruitful discussions with Thi Vo, Peter Vekilov, Jeremy Palmer, Todd Yeates, Diana Fusco, Francesco Sciortino, Peter Poole, Richard Bowles and Tim Moore. This research used resources of the Oak Ridge Leadership Computing Facility, which is a DOE Office of Science User Facility supported under Contract DE-AC05-00OR22725; INCITE project MAT110 and an Early Science Project on the Summit supercomputer. This research used the Extreme Science and Engineering Discovery Environment (XSEDE), which is supported by National Science Foundation grant number ACI-1053575; XSEDE awards DMR 140129 and DMR160120. This material is based upon work supported by the U. S. Army Research Laboratory and the U. S. Army Research Office under contract/grant numbers W911NF-15-1-0185 and W911NF-18-1-0167.
References
- (1) http://www.rcsb.org .
- Hsia et al. (2016) Y. Hsia, J. B. Bale, S. Gonen, D. Shi, W. Sheffler, K. K. Fong, U. Nattermann, C. Xu, P.-S. Huang, R. Ravichandran, S. Yi, T. N. Davis, T. Gonen, N. P. King, and D. Baker, Nature 535, 136 (2016).
- Lai et al. (2012) Y.-T. Lai, D. Cascio, and T. O. Yeates, Science 336, 1129 (2012).
- Van Driessche et al. (2018) A. E. S. Van Driessche, N. Van Gerven, P. H. H. Bomans, R. R. M. Joosten, H. Friedrich, D. Gil-Carton, N. A. J. M. Sommerdijk, and M. Sleutel, Nature 556, 89 (2018).
- Simon et al. (2019) A. J. Simon, Y. Zhou, V. Ramasubramani, J. Glaser, A. Pothukuchy, J. Gollihar, J. C. Gerberich, J. C. Leggere, B. R. Morrow, C. Jung, S. C. Glotzer, D. W. Taylor, and A. D. Ellington, Nature Chemistry (2019), 10.1038/s41557-018-0196-3.
- Vega and Monson (1998) C. Vega and P. A. Monson, The Journal of Chemical Physics 109, 9938 (1998).
- Lomakin et al. (1999) A. Lomakin, N. Asherie, and G. B. Benedek, Proceedings of the National Academy of Sciences of the United States of America 96, 9465 (1999).
- Whitelam (2010) S. Whitelam, Physical Review Letters 105, 088102 (2010).
- Haxton and Whitelam (2012) T. K. Haxton and S. Whitelam, Soft matter 8, 3558 (2012).
- ten Wolde and Frenkel (1997) P. R. ten Wolde and D. Frenkel, Science 277, 1975 (1997).
- Fusco and Charbonneau (2013) D. Fusco and P. Charbonneau, Physical Review. E, Statistical, Nonlinear, and Soft Matter Physics 88, 012721 (2013).
- Dorsaz et al. (2012) N. Dorsaz, L. Filion, F. Smallenburg, and D. Frenkel, Faraday Discuss. 159, 9 (2012).
- Staneva and Frenkel (2015) I. Staneva and D. Frenkel, The Journal of Chemical Physics 143, 194511 (2015).
- Khan et al. (2019) A. R. Khan, S. James, M. K. Quinn, I. Altan, P. Charbonneau, and J. J. McManus, Biophysical Journal (2019), 10.1016/j.bpj.2019.07.019.
- Fusco et al. (2014) D. Fusco, J. J. Headd, A. De Simone, J. Wang, and P. Charbonneau, Soft matter 10, 290 (2014).
- Galkin and Vekilov (2000) O. Galkin and P. G. Vekilov, Proceedings of the National Academy of Sciences of the United States of America 97, 6277 (2000).
- Vekilov (2005) P. G. Vekilov, Journal of crystal growth 275, 65 (2005).
- Xu et al. (2012) L. Xu, S. V. Buldyrev, H. E. Stanley, and G. Franzese, Physical Review Letters 109, 095702 (2012).
- Bianchi et al. (2006) E. Bianchi, J. Largo, P. Tartaglia, E. Zaccarelli, and F. Sciortino, Physical Review Letters 97, 168301 (2006).
- Russo et al. (2011) J. Russo, J. M. Tavares, P. I. C. Teixeira, M. M. Telo da Gama, and F. Sciortino, Physical Review Letters 106, 085703 (2011).
- Rovigatti et al. (2013) L. Rovigatti, J. M. Tavares, and F. Sciortino, Physical Review Letters 111, 168302 (2013).
- Ishimoto and Tanaka (1977) C. Ishimoto and T. Tanaka, Physical review letters 39, 474 (1977).
- Thomson et al. (1987) J. A. Thomson, P. Schurtenberger, G. M. Thurston, and G. B. Benedek, Proceedings of the National Academy of Sciences of the United States of America 84, 7079 (1987).
- Brangwynne et al. (2009) C. P. Brangwynne, C. R. Eckmann, D. S. Courson, A. Rybarska, C. Hoege, J. Gharakhani, F. Jülicher, and A. A. Hyman, Science 324, 1729 (2009).
- Levenson et al. (2018) R. Levenson, C. Bracken, C. Sharma, J. Santos, C. Arata, P. Kohl, Y. Li, and D. E. Morse, BioRxiv (2018), 10.1101/456442.
- Falahati and Haji-Akbari (2019) H. Falahati and A. Haji-Akbari, Soft matter 15, 1135 (2019).
- Palmer et al. (2014) J. C. Palmer, F. Martelli, Y. Liu, R. Car, A. Z. Panagiotopoulos, and P. G. Debenedetti, Nature 510, 385 (2014).
- Vasisht et al. (2011) V. V. Vasisht, S. Saw, and S. Sastry, Nature physics 7, 549 (2011).
- Saika-Voivod et al. (2001) I. Saika-Voivod, F. Sciortino, and P. H. Poole, Physical Review. E, Statistical, Nonlinear, and Soft Matter Physics 63, 011202 (2001).
- Smallenburg et al. (2014) F. Smallenburg, L. Filion, and F. Sciortino, Nature physics 10, 653 (2014).
- Lee et al. (2019) S. Lee, E. G. Teich, M. Engel, and S. C. Glotzer, Proceedings of the National Academy of Sciences of the United States of America 116, 14843 (2019).
- Zhang et al. (2012) F. Zhang, R. Roth, M. Wolf, F. Roosen-Runge, M. W. A. Skoda, R. M. J. Jacobs, M. Stzucki, and F. Schreiber, Soft matter 8, 1313 (2012).
- Jiang et al. (2015) H. Jiang, S. Wang, Y. Huang, X. He, H. Cui, X. Zhu, and Y. Zheng, Cell 163, 108 (2015).
- Bau et al. (1998) R. Bau, D. C. Rees, D. M. Kurtz Jr., R. A. Scott, H. Huang, M. W. W. Adams, and M. K. Eidsness, Journal of Biological Inorganic Chemistry 3, 484 (1998).
- Barducci et al. (2008) A. Barducci, G. Bussi, and M. Parrinello, Physical Review Letters 100, 020603 (2008).
- James et al. (2019) D. James, S. Beairsto, C. Hartt, O. Zavalov, I. Saika-Voivod, R. K. Bowles, and P. H. Poole, The Journal of Chemical Physics 150, 074501 (2019).
- Wukovitz and Yeates (1995) S. W. Wukovitz and T. O. Yeates, Nature Structural Biology 2, 1062 (1995).
- Cahn (1977) J. W. Cahn, The Journal of Chemical Physics 66, 3667 (1977).
- Reviakine et al. (2003) I. Reviakine, D. K. Georgiou, and P. G. Vekilov, Journal of the American Chemical Society 125, 11684 (2003).
- Muschol and Rosenberger (1997) M. Muschol and F. Rosenberger, The Journal of Chemical Physics 107, 1953 (1997).
- Zhang et al. (2011) F. Zhang, G. Zocher, A. Sauter, T. Stehle, and F. Schreiber, Journal of Applied Crystallography 44, 755 (2011).