Static fission properties of actinide nuclei
Abstract
Fission barriers heights and excitation energies of superdeformed isomeric minima are calculated within the microscopic - macroscopic Woods - Saxon model for 75 actinide nuclei for which the experimental data are known. State - of - the - art methods were used: minimization over many deformation parameters for minima and the imaginary water flow on many - deformation energy grid for saddles, including nonaxial and reflection-asymmetric shapes. We obtain 0.82 - 0.94 MeV rms deviation between the calculated and experimental barriers and 0.53 MeV rms error in the excitation of superdeformed minima (SD). Experimental vs theory discrepancies seem to be of various nature and not easy to eliminate, especially if one cares for more than one or two observables. As an example, we show that by strengthening pairing in odd systems one can partially improve agreement in barriers, while spoiling it for masses. We also discuss the ”thorium anomaly” and suggest its possible relation to a different way in which the Ac and Th barriers are derived from experimental data.
pacs:
25.85.Ca,21.10.Gv,21.60.-n,27.90.+bI Introduction
Spontaneous fission is one of the two main causes limiting the existence of superheavy () nuclei (SHN). Known spontaneous fission half-lives of SHN are mostly in the range of ms to seconds for even - even, and 10 s - 1 h for odd ones Hessberger2017 . In actinides, show a rapid rise with a decreasing proton number, for example: 8 s for , 86 y for , 1014 y for , and reaches y for the fissile Hessberger2017 which may be considered practically stable against spontaneous fission. When viewed in the picture of quantum tunneling, such enormous differences result from 2 - 3 MeV differences in energy landscapes. Therefore, evaluation of fission rates requires a rather precise description of the potential energy surfaces. Till now, still the most effective way to calculate the latter are the semi-phenomenological microscopic-macroscopic methods in which the smooth (macroscopic) part of the energy and single - particle potential are separately fitted to, respectively, the bulk and single - particle nuclear data.
Using such an approach based on a deformed Woods-Saxon single - particle potential Cwiok1987 and the Yukawa-plus-exponential macroscopic energy Krappe1979 we have recently Jachimowicz2017_II systematically calculated static fission barrier heights for 1305 heavy and SH nuclei beyond berkelium, including even-even, odd-even, even-odd and odd-odd systems. In this paper we report a similar study for actinide nuclei for which experimental fission data are available. Energy surfaces of actinides show long barriers and various saddles and their determination requires accounting for many collective deformations; this leads to an extensive and time - consuming numerical effort. The main goal of our present work is to compare calculated ”inner” and ”outer” static fission barriers with empirical estimates. Having many - dimensional energy landscapes, without much effort we can also find the location and excitation of super-deformed minima.
Fission barriers heights are model-dependent quantities, and at the same time, very useful theoretical constructs related to fission data. It has to be remembered that while these data are usually obtained from the neutron - induced fission reactions which involve a few MeV excitation of the fissioning system, theoretical calculations are performed mostly for adiabatic configurations. Still, it is interesting to compare empirical and evaluated static fission properties and try to understand them. The present work is an extension of our previous studies on barriers in even-even actinides Kowal2010 ; Jachimowicz2012 to odd- and odd-odd nuclei, while using enlarged spaces of collective deformations. Of particular importance is the search for saddle points by using the immersion water flow technique (in the study of fission barriers first used in Mamdouh1998 ), which, in principle, should save us from inaccuracies of the minimization method, as explained in Myers96 ; Moller2000 ; Moller2009 . From the present analysis one can reckon the quality of our micro-macro approach and form some idea about its predictive power in the region of SHN.
Systematic calculations including odd- and odd-odd actinides, with inner and outer barriers, from actinium to californium, are rather scarce. We are aware of results of P. Möller and coworkers in Moller2009 and those of the HFB14 model by S. Goriely et al. Goriely2007 . On the other hand, there are many published calculations of fission barriers in even-even actinides, performed within various micro-macro (e.g the recent work POM2018 ), and mean-field models. Some of the latter studies contain a careful analysis of various approximations and/or corrections, like, for example BONNEAU04 based on the SkM* force, Delaroche2006 ; Robledo2014 ; Lemaitre2018 using Gogny models, and Abusara2010 ; Zhou2014 using relativistic functionals. They widely differ in applied methodology as to the saddle point determination and included energy corrections. Sometimes they involve arbitrary prescriptions, like for example, for the so-called collective energy corrections. Some of these results are astonishingly (taking into account applied approximations) close to the experimental estimates.
We would like to stress that experimental data on fission barriers or isomers were never used to fit the parameters of our model. Likewise, no single adjustment was made in the present work to improve the agreement of calculated fission barrier heights and excitation energies of second minima with their experimental estimates. Examples of, and comments on changes in calculated quantities introduced by modifications of selected parameters of the model are presented only to provide some orientation on their interrelation.
II Method of the calculation
We used exactly the same microscopic-macroscopic approach as in our previous global calculations of static fission barrier heights for the heaviest nuclei , Jachimowicz2017_II . Thus, the Yukawa-plus-exponential model was taken for the macroscopic part of the energy, and the Strutinsky shell correction, based on the Woods-Saxon single-particle potential was used for its microscopic part. All parameters used in the present work, that have been fixed previously (see Jachimowicz2017_II and references therein), were kept unchanged. Also the pairing correlations were taken into account in our model within the standard BCS approach without any specially adjusted parameters. Additionally, for systems with odd numbers of protons, neutrons, or both, we used a standard blocking method. Other details of the approach are also specified in Jachimowicz2017_II ; Jachimowicz2014 .
To describe nuclear shapes we used a standard parametrization which consists in the expansion of the nuclear radius vector in spherical harmonics:
| (1) |
where is the volume-fixing factor depending on deformation and is the radius of a spherical nucleus. For large elongations this parametrization cannot be very efficient, however our tests and comparisons with other parameterizations, as the modified Funny-Hills Pomorski2006 or three quadratic surfaces, e.g. Moller2009 , indicate that it is still good and effective in the region of the second barrier. One should realize that the superdeformed and the second saddle shapes in actinides are still rather compact. On the other hand, with an increasing elongation the relative importance of different spherical harmonics changes along the fission path. For this reason our searches for minima and the first and second saddles were performed independently, by using different deformation sets. This allowed to reduce the computational effort, making calculations feasible while still preserving the reliability of the results. The shape parameterizations used in different regions of potential energy surfaces (PES) are detailed below.
II.1 Ground states & second minima
For nuclear ground states (g.s.), based on our previous tests and results Jachimowicz2017_I , we confined our analysis to axially-symmetric shapes with expansion of the nuclear radius (1) truncated at :
where here and in the following the angular dependence of spherical harmonics is suppressed. Therefore, in this case, the energy was minimized over 7 degrees of freedom specified in (II.1), by using the conjugate gradient method. To avoid falling into local minima, the minimization was repeated dozens of times for each nucleus, with randomly selected starting deformations. For odd systems, the additional minimization over configurations was performed at every step of the gradient procedure.
Exactly the same procedure and deformation space (II.1) were used to determine isomeric, superdeformed (SD) minima and their excitation energies relative to the ground states. Starting points did not have to be guessed as this minimization was done after we had calculated the full energy grids (see the point C). The gradient method is, however, more accurate and therefore, in order to determine the location of these minima as precisely as possible, we have applied it for the relevant points read from the energy maps. As it turned out, the obtained secondary minima are exclusively mass-symmetric - their deformations , , are equal zero. In addition, we have also systematically checked that the nonaxiality plays no role in the region of SD minima. This result is in line with our previous conclusions in Jachimowicz2012 .
II.2 First saddle points
Much more demanding is to find all saddle points on energy grids (hypercubes). It is well known that in the region of the first barrier the triaxiality is very important CWIOK92 ; CWIOK96 ; GHERGH99 ; DUTTA00 ; DECHARGE2003 ; BONNEAU04 ; Cwiok05 ; DOB2007 ; KOWAL2009 . So, in order to find proper first saddle points we used a five dimensional deformation space, with the expansion of the nuclear radius:
where the quadrupole non-axiality is included explicitly. For each nucleus we generated the following 5D grid of deformations:
| (4) | |||||
of points (nuclear shapes); the numbers in the parentheses specify the grid steps. Additionally, for odd - and odd - odd nuclei, at each grid point we were looking for low-lying configurations by blocking particles on levels from the 10-th below to the 10-th above the Fermi level. Then, our primary grid (II.2) was extended by the fivefold interpolation in all directions. Finally, we obtained the interpolated energy grid of more than 50 million points. To find the first saddles on such a giant gird we used the imaginary water flow method, (see e.g. Moller2009 ; Jachimowicz2017_II ). It is worth mentioning that for all those saddles we carried out an additional test of their stability against mass-asymmetry. This was done by a 3 dimensional energy minimization with respect to: and , around each saddle. The result of this minimization indicates no effect of the mass asymmetry at the first saddle point, similarly as in our previous study of superheavy nuclei Jachimowicz2017_II . This justifies the omission of the mass-asymmetric shapes in the definition (II.2) of the nuclear radius.
II.3 Second saddle points
To determine the second saddle point, we used the following expansion of the nuclear radius:
where additionally the dipole distortion , important for large elongations with a sizable mass asymmetry Kowal2012 ; Jachimowicz2013 , has been used. It was treated as a constraint: for each set of other deformations the value of was fixed by setting the center of mass of the nucleus to zero (the origin of coordinates). The imaginary water flow analysis was performed on the 7-dimensional grid. The following values of deformation parameters have been used on the grid:
| (6) | |||||
with the steps given in the parentheses. These made a grid of i points for a given nucleus. In this case, we could afford a twofold interpolation. However, in performed tests we found that it had only a minor effect on heights of the second barriers. Therefore, we performed calculations on the original grid. As previously, for odd systems, the minimization over configurations (by blocking particles on levels from the 10th below to the 10th above the Fermi level) was performed at each point of the grid (II.3). Moreover, in selected nuclei we checked that the quadrupole nonaxiality, omitted in (II.3), plays a minor role at elongations close to the second saddle. The similar conclusion we found in Jachimowicz2012 for even-even actinides. Therefore, our analysis confined here to only axially symmetric shapes, should still be reliable.
III Results
III.1 Ground state masses
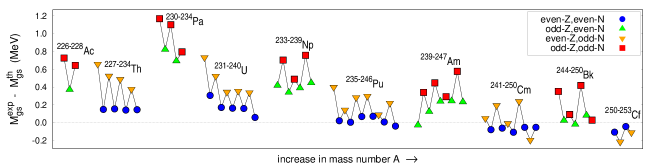
The present model was used for a description of the experimental g.s. masses of 252 nuclei with in Jachimowicz2014 . This was an extension to odd- and odd-odd nuclei of the version used previously for even-even heavy nuclei, whose parameters were fixed by a mass fit in Muntian2001 . Although excitation energies and fission barriers are calculated relative to g.s. energy, it makes sense to see the quality of the mass fit. Differences between measured Audi2003 and calculated g.s. masses are shown in Fig. 1; even-even, odd-even, even-odd, and odd-odd nuclei are indicated by different colors and shapes. A quite pronounced odd-even staggering in these differences signals a different degree of accuracy in reproducing g.s. masses in various groups of nuclei. The differences are the smallest for even-even nuclei (this was the result of the original fit in Muntian2001 ), while the largest, up to 1.2 MeV, occur for odd-odd systems, especially for Pa isotopes. One can also notice a systematic underestimate of the experimental masses in lighter elements that means that the calculated binding energies (meaning their absolute values) are too large there. Thus, we have overbinding in lighter elements, which is more pronounced in odd and odd-odd nuclei
One could think that this even-odd difference in the mass fit might be related to the blocking method which leads to a too strong reduction in the pairing gap. However, one should notice that the binding in odd nuclei is overestimated more than in even ones, so it has another cause. One can notice that an increase in pairing strength for all nuclei would decrease the staggering in the binding error between odd and even ones (as a stronger pairing increases the effect of blocking on energy) but would also deteriorate the relatively good mass fit for even-even nuclei.
On the other hand, the blocking effect may cause too high barriers in the odd systems, as a weaker pairing produces higher fission barriers. To compensate for this one could assume a slightly stronger pairing interaction for odd-particle-numbers. Such a test will be discussed in subsection III F. Although the effect is not negligible, to keep the consistency with our previous papers, all other presented results were obtained with the previously used parameters (including pairing).
III.2 Fission isomers
Fast fissioning states discovered in actinides by Polikanov et al. Pol were soon afterwards interpreted as the secondary minima at large elongation in corresponding nuclei FD66 ; St67 . Their existence disclosed a double - hump shape of fission barriers. The lowest and excited nuclear states at second minimum are extremely short-lived, with characteristic half-lives in the range of 10 ps to 10 ms, what makes their experimental study very difficult. A more detailed structure of these states (quadrupole moments, energy levels) is known only in a few nuclei. Recently, quite extensive experimental results were collected on many energy levels in the second minimum of 240Pu 240PuIIa ; Gassmann ; Thirolf .
Deformation of shape isomers is a primary information for any description of nuclear structure existing there. The excitation energies of these minima have effect on calculations of barrier transmission. Thus, it is interesting to compare the experimental vs calculated excitation energies, . It is also a test of the predictive power of our model, as its parameters were not adjusted to these data.
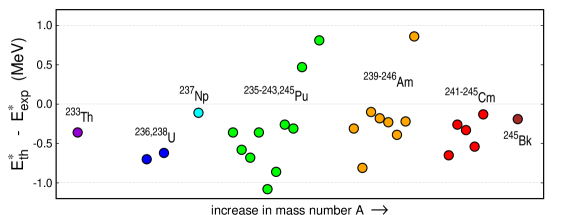
The experimental data Singh1996 are concentrated in Pu, Am and Cm nuclei; only few fission isomers are known in the lighter and in heavier actinides. One can also remark that the isomer excitation energies are measured with widely varying accuracy, many with uncertainties 0.2 - 0.4 MeV.
The calculated second minima in most cases lie too low and the spread of calculated points around experimental values is quite large. The mean deviation of theoretical values from experimental ones is 0.46 MeV while MeV. The largest difference of 1.1 MeV between our results and experimental data occurs in . However, when one discards the largest discrepancies: too low in 239,240Pu and 240Am, and too high in 245Pu and 246Am, the remaining calculated points lie within 0.5 MeV from the experimental ones. If one, additionally, allows for experimental uncertainties, the overall agreement looks better. Still, it is better than achieved by most of the various Skyrme density functionals for which differences between theoretical and experimental excitation energy of the second minimum can be as high as 4 MeV Nikolov .
Some qualitative features of the data are reproduced by our calculations. For example, the obtained excitation of the SD minimum in is smaller than in - as it is in experiment Singh1996 . One can also notice that both experimental and theoretical are relatively low in the vicinity of (unfortunately, there is only one data point for Bk - ). Quadrupole deformations of SD minima are shown in Fig. 3. One can see that this variable changes linearly with . Such a behavior of , together with a more steady position, 0.75 - 0.85, of the second saddle, is partially responsible for a reduction of the outer barrier width with increasing . Although the effect seems small, it can significantly influences tunnelling probabilities, i.e. fission half-lives.

III.3 First fission barrier heights
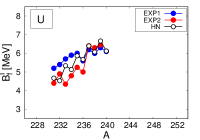
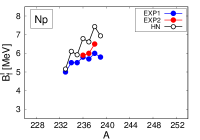
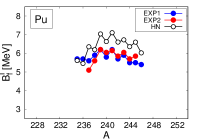
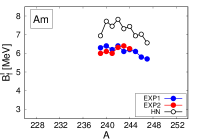
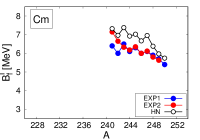
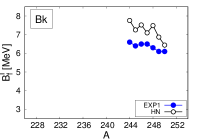
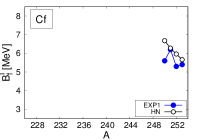
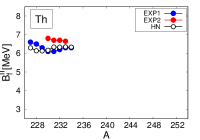
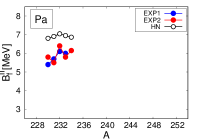
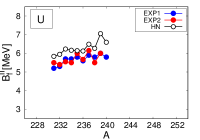
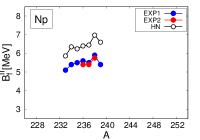
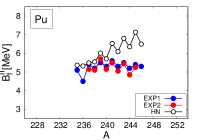
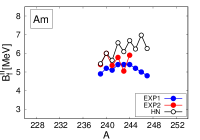
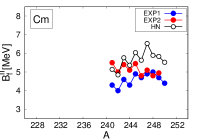
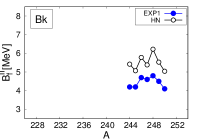
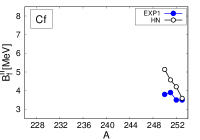
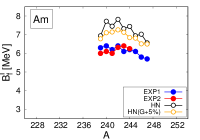
The presently calculated (black circles) and experimental, EXP1 Smirenkin1993 and EXP2 Capote2009 (blue and red dots, respectively) first fission barrier heights are shown in Fig. 4. Their numerical values are given in Table 2, including results for . The latter nuclei will be discussed later (Sec. III.5) in more detail.
The calculated barriers in Th nuclei are clearly too low compared to the experimental estimates. The difference is especially large in lighter isotopes. This discrepancy occurred in many other theoretical studies, eg. Mamdouh1998 ; Samyn2005 ; Dobrowolski2007 ; Moller2009 ; Abusara2010 , and will be discussed separately in Sec. III.5. Better agreement between calculated barriers and data occurs for protactinium and uranium isotopes for which our results lie quite close to, and sometimes between two sets of experimental points. In neptunium and plutonium nuclei our barriers become systematically higher than the empirical ones and they stay so in heavier actinides. The largest model vs experimental deviation can be observed in odd-odd americium isotopes, with discrepancies up to 1.6 MeV. With , the discrepancy between our results and data decreases in Cm, rises in Bk and becomes smaller again in Cf.
Statistical parameters describing the deviation of calculated values of from the experimental estimates can be found in Table 1. Due to the lack of the empirical data for Ac isotopes, the comparison concerns nuclei from Th to Cf. In summary, the average discrepancy and the root mean square deviation do not exceed 1 MeV for both available sets of data. The inclusion of odd nuclei into consideration, without any tuning of parameters, worsens agreement with data compared the case of only even-even nuclei.
| comparison for | ||
|---|---|---|
| vs. EXP1 Smirenkin1993 | vs. EXP2 Capote2009 | |
| 71 | 45 | |
| 0.80 | 0.73 | |
| 0.94 | 0.85 | |
Another observation concerns the odd-even staggering in barriers which is definitely too strong compared to the data. This effect was signalled in Sec. III.1 and related to a too large decrease in the pairing gap due to blocking. Sill, to better understand a source of this effect, in Sec. III.6 the role of the pairing interaction will be additionally tested in selected cases.
| Nucleus | ||||||||||||
| 89 | 137 | 226 | 23.58 | 24.31 | 4.07 | - | - | 3.05 | - | 7.16 | - | 7.8 |
| 89 | 138 | 227 | 25.48 | 25.85 | 3.94 | - | - | 2.78 | - | 6.96 | - | 7.4 |
| 89 | 139 | 228 | 28.25 | 28.90 | 4.38 | - | - | 3.01 | - | 6.80 | - | 7.1 |
| 90 | 137 | 227 | 25.15 | 25.81 | 3.74 | 5.9 | - | 2.87 | - | 6.30 | 6.6 | - |
| 90 | 138 | 228 | 26.62 | 26.77 | 3.57 | 6.2 | - | 2.48 | - | 6.14 | 6.5 | - |
| 90 | 139 | 229 | 29.06 | 29.59 | 4.17 | 5.9 | - | 2.90 | - | 6.13 | 6.3 | - |
| 90 | 140 | 230 | 30.71 | 30.86 | 3.98 | 6.1 | 6.1 | 2.62 | - | 6.17 | 6.1 | 6.8 |
| 90 | 141 | 231 | 33.33 | 33.82 | 4.78 | 6.0 | 6.0 | 2.35 | - | 6.34 | 6.1 | 6.7 |
| 90 | 142 | 232 | 35.31 | 35.45 | 4.55 | 5.8 | 5.8 | 2.11 | - | 6.33 | 6.2 | 6.7 |
| 90 | 143 | 233 | 38.36 | 38.73 | 5.21 | 6.1 | 5.1 | 1.49 | 6.35 | 6.3 | 6.65 | |
| 90 | 144 | 234 | 40.47 | 40.61 | 5.03 | 6.1 | - | 1.62 | - | 6.33 | 6.3 | - |
| 91 | 139 | 230 | 31.01 | 32.17 | 5.10 | 5.4 | 5.6 | 3.91 | - | 6.81 | 5.4 | 5.8 |
| 91 | 140 | 231 | 32.60 | 33.43 | 4.98 | 5.7 | 5.5 | 3.66 | - | 6.91 | 5.7 | 5.5 |
| 91 | 141 | 232 | 34.85 | 35.95 | 5.72 | 6.0 | 5.0 | 3.44 | - | 7.05 | 6.1 | 6.4 |
| 91 | 142 | 233 | 36.80 | 37.49 | 5.54 | 6.0 | 5.7 | 3.13 | - | 6.95 | 6.0 | 5.8 |
| 91 | 143 | 234 | 39.55 | 40.34 | 6.23 | - | 6.3 | 2.45 | - | 6.87 | - | 6.15 |
| 92 | 139 | 231 | 33.07 | 33.81 | 4.64 | 5.2 | 4.4 | 3.41 | - | 5.84 | 5.2 | 5.5 |
| 92 | 140 | 232 | 34.30 | 34.61 | 4.52 | 5.4 | 4.9 | 3.10 | - | 5.95 | 5.3 | 5.4 |
| 92 | 141 | 233 | 36.40 | 36.92 | 5.29 | 5.7 | 4.35 | 2.86 | - | 6.23 | 5.7 | 5.55 |
| 92 | 142 | 234 | 37.98 | 38.15 | 5.12 | 5.9 | 4.8 | 2.57 | - | 6.16 | 5.7 | 5.5 |
| 92 | 143 | 235 | 40.57 | 40.92 | 5.86 | 6.0 | 5.25 | 1.94 | - | 6.14 | 5.8 | 6.0 |
| 92 | 144 | 236 | 42.28 | 42.45 | 5.69 | 5.6 | 5.0 | 2.05 | 6.13 | 5.6 | 5.67 | |
| 92 | 145 | 237 | 45.04 | 45.39 | 6.45 | 6.2 | 6.4 | 1.92 | - | 6.49 | 5.9 | 6.15 |
| 92 | 146 | 238 | 47.15 | 47.31 | 6.06 | 6.0 | 6.3 | 1.94 | 2.56 | 6.27 | 5.8 | 5.5 |
| 92 | 147 | 239 | 50.23 | 50.57 | 6.70 | 6.3 | 6.45 | 2.02 | - | 7.05 | 6.0 | 6.0 |
| 92 | 148 | 240 | 52.66 | 52.72 | 6.13 | 6.1 | - | 2.04 | - | 6.59 | 5.8 | - |
| 93 | 140 | 233 | 37.53 | 37.95 | 5.14 | 5.0 | - | 3.46 | - | 5.86 | 5.1 | - |
| 93 | 141 | 234 | 39.25 | 39.96 | 6.10 | 5.5 | - | 3.31 | - | 6.35 | 5.4 | - |
| 93 | 142 | 235 | 40.71 | 41.04 | 5.89 | 5.5 | - | 3.06 | - | 6.24 | 5.5 | - |
| 93 | 143 | 236 | 42.89 | 43.38 | 6.79 | 5.8 | 5.9 | 2.58 | - | 6.40 | 5.6 | 5.4 |
| 93 | 144 | 237 | 44.48 | 44.87 | 6.54 | 5.7 | 6.0 | 2.69 | 6.44 | 5.5 | 5.4 | |
| 93 | 145 | 238 | 46.70 | 47.46 | 7.41 | 6.0 | 6.5 | 2.67 | - | 6.98 | 5.9 | 5.75 |
| 93 | 146 | 239 | 48.87 | 49.31 | 6.98 | 5.8 | - | 2.56 | - | 6.60 | 5.4 | - |
| 94 | 141 | 235 | 41.78 | 42.18 | 5.64 | 5.7 | - | 2.64 | 5.37 | 5.1 | - | |
| 94 | 142 | 236 | 42.88 | 42.90 | 5.49 | 5.7 | - | 2.42 | 5.32 | 4.5 | - | |
| 94 | 143 | 237 | 44.95 | 45.09 | 6.26 | 5.6 | 5.10 | 1.92 | 5.48 | 5.4 | 5.15 | |
| 94 | 144 | 238 | 46.16 | 46.16 | 6.24 | 5.9 | 5.6 | 2.04 | 5.55 | 5.2 | 5.1 | |
| 94 | 145 | 239 | 48.31 | 48.59 | 7.08 | 6.2 | 6.2 | 2.02 | 6.01 | 5.5 | 5.7 | |
| 94 | 146 | 240 | 50.06 | 50.13 | 6.61 | 5.8 | 6.05 | 1.94 | 5.71 | 5.3 | 5.15 | |
| 94 | 147 | 241 | 52.66 | 52.96 | 7.08 | 6.2 | 6.15 | 1.94 | 6.53 | 5.6 | 5.50 | |
| 94 | 148 | 242 | 54.65 | 54.72 | 6.60 | 5.7 | 5.85 | 1.97 | 6.09 | 5.3 | 5.05 | |
| 94 | 149 | 243 | 57.66 | 57.76 | 6.70 | 5.9 | 6.05 | 2.17 | 6.80 | 5.5 | 5.45 | |
| 94 | 150 | 244 | 59.80 | 59.81 | 6.37 | 5.5 | 5.7 | 2.14 | - | 6.35 | 5.2 | 4.85 |
| 94 | 151 | 245 | 62.88 | 63.11 | 6.58 | 5.5 | 5.85 | 2.81 | 7.13 | 5.4 | 5.25 | |
| 94 | 152 | 246 | 65.43 | 65.40 | 6.02 | 5.4 | - | 2.44 | - | 6.50 | 5.3 | - |
| 95 | 144 | 239 | 49.42 | 49.39 | 6.94 | 6.3 | 6.00 | 2.19 | 5.44 | 4.9 | 5.40 | |
| 95 | 145 | 240 | 51.17 | 51.51 | 7.72 | 6.4 | 6.10 | 2.19 | 6.00 | 5.2 | 6.00 | |
| 95 | 146 | 241 | 52.81 | 52.94 | 7.46 | 6.2 | 6.00 | 2.10 | 5.63 | 5.1 | 5.35 | |
| 95 | 147 | 242 | 55.02 | 55.47 | 7.82 | 6.4 | 6.32 | 2.02 | 6.57 | 5.4 | 5.78 | |
| 95 | 148 | 243 | 56.94 | 57.18 | 7.31 | 6.1 | 6.40 | 2.07 | 6.09 | 5.4 | 5.05 | |
| 95 | 149 | 244 | 59.59 | 59.88 | 7.44 | 6.2 | 6.25 | 2.41 | 6.68 | 5.4 | 5.9 | |
| 95 | 150 | 245 | 61.66 | 61.90 | 6.93 | 6.1 | - | 2.23 | 6.23 | 5.2 | - | |
| 95 | 151 | 246 | 64.42 | 64.99 | 7.02 | 5.8 | - | 2.86 | 6.98 | 5.0 | - | |
| 95 | 152 | 247 | 66.92 | (67.15) | 6.56 | 5.7 | - | 2.43 | - | 6.26 | 4.8 | - |
| 96 | 145 | 241 | 53.65 | 53.70 | 7.33 | 6.4 | 7.15 | 1.65 | 5.14 | 4.3 | 5.5 | |
| 96 | 146 | 242 | 54.88 | 54.81 | 6.96 | 6.0 | 6.65 | 1.64 | 4.85 | 4.0 | 5.0 | |
| 96 | 147 | 243 | 56.99 | 57.18 | 7.34 | 6.5 | 6.33 | 1.57 | 5.76 | 4.6 | 5.4 | |
| 96 | 148 | 244 | 58.51 | 58.45 | 6.91 | 6.1 | 6.18 | 1.66 | 5.36 | 4.3 | 5.10 | |
| 96 | 149 | 245 | 61.01 | 61.00 | 7.10 | 6.3 | 6.35 | 1.97 | 6.04 | 4.9 | 5.45 | |
| 96 | 150 | 246 | 62.72 | 62.62 | 6.68 | 6.0 | 6.0 | 1.89 | - | 5.63 | 4.7 | 4.80 |
| 96 | 151 | 247 | 65.29 | 65.53 | 6.98 | 6.1 | 6.12 | 2.60 | - | 6.53 | 4.9 | 5.10 |
| 96 | 152 | 248 | 67.44 | 67.39 | 6.38 | 5.9 | 5.8 | 2.24 | - | 5.89 | 5.0 | 4.80 |
| 96 | 153 | 249 | 70.94 | 70.75 | 6.02 | 5.7 | 5.63 | 2.20 | - | 5.83 | 4.7 | 4.95 |
| 96 | 154 | 250 | 73.04 | 72.99 | 5.72 | 5.4 | - | 2.12 | - | 5.52 | 4.4 | - |
| 97 | 147 | 244 | 60.36 | 60.72 | 7.68 | 6.6 | - | 1.26 | - | 5.42 | 4.2 | - |
| 97 | 148 | 245 | 61.79 | 61.82 | 7.19 | 6.4 | - | 1.37 | 5.07 | 4.2 | - | |
| 97 | 149 | 246 | 63.88 | 63.97 | 7.40 | 6.5 | - | 1.85 | - | 5.78 | 4.7 | - |
| 97 | 150 | 247 | 65.51 | 65.49 | 7.02 | 6.5 | - | 1.66 | - | 5.38 | 4.6 | - |
| 97 | 151 | 248 | 67.66 | (68.08) | 7.49 | 6.3 | - | 2.31 | - | 6.22 | 4.8 | - |
| 97 | 152 | 249 | 69.77 | 69.85 | 6.77 | 6.1 | - | 1.98 | - | 5.53 | 4.5 | - |
| 97 | 153 | 250 | 72.92 | 72.95 | 6.35 | 6.1 | - | 1.69 | - | 5.04 | 4.1 | - |
| 98 | 152 | 250 | 71.28 | 71.17 | 6.67 | 5.6 | - | 1.83 | - | 5.14 | 3.8 | - |
| 98 | 153 | 251 | 74.35 | 74.13 | 6.25 | 6.2 | - | 1.63 | - | 4.58 | 3.9 | - |
| 98 | 154 | 252 | 76.08 | 76.03 | 5.97 | 5.3 | - | 1.58 | - | 4.21 | 3.5 | - |
| 98 | 155 | 253 | 79.41 | 79.30 | 5.61 | 5.4 | - | 1.06 | - | 3.59 | 3.5 | - |
III.4 Second fission barrier heights
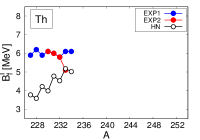
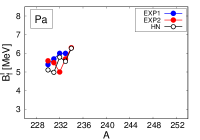
A comparison between experimental and calculated second barrier heights is presented in Fig. 5 as well as in the last columns of Table 2. It should be emphasized that the two sets of experimental data for second fission barriers differ more than 0.5 MeV in Th and Cm; for example, in 242Cm this difference amounts to 1 MeV. They also differ in a subtle way: the Am data taken from Capote2009 indicate a quite strong odd - even staggering while those from Smirenkin1993 do not. In Cm nuclei the odd-even staggering for both experimental data sets is already similar.
As one can see, our are almost always higher than the experimental ones. In uranium and neptunium isotopes the general trend of the experimental data seems to be reproduced quite well. The largest discrepancy of 1.5 - 2 MeV between calculated and experimental barriers occurs for odd-odd americium isotopes (as for the first barriers) and for odd-neutron Pu and Cm chains.
There are also discrepancies suggesting more involved reasons. In Pu and Am isotopes the barriers increase with while no such effect is observed in the data. A similar increase was also produced in other micro-macro Moller2009 ; Dobrowolski2007 and non-relativistic self-consistent calculations - see Delaroche2006 ; Robledo2014 and BENDER2004 (in Fig. 3, for Sly6 interaction). This problem seems to be absent in the RMF approach, see Zhou2014 and BENDER2004 for NL-Z2 and NL3 models.
It is worth noting that for light actinides the odd - even staggering in second barriers is practically absent. It becomes more pronounced for the mass numbers greater than 238, and is clearly visible in plutonium isotopes, as well as in the heavier isotopic chains. Then, it disappears for the neutron numbers greater than 152.
The mean discrepancy and rms deviation of the second barriers can be found in Table. 3. Comparison was done starting from Ac and ending at Cf nuclei. As for the first barriers before, the statistical deviations between our second fission barriers and data are less than 1 MeV. For the even-even systems, the present barriers can be compared with our previous results Jachimowicz2012 . Despite the fact that the currently used method is slightly different in including the dipole deformation , the second barriers stay as they were.
| comparison for | ||
|---|---|---|
| vs. EXP1 Smirenkin1993 | vs. EXP2 Capote2009 | |
| 71 | 48 | |
| 0.82 | 0.70 | |
| 0.92 | 0.82 | |
III.5 Fission barriers of Ac and Th isotopes
As mentioned before, the calculated first fission barriers () in light Th nuclei are significantly lower than the second ones () and, at the same time, much smaller than the experimental first barriers - see Table 2. For example, in 228Th the latter difference is greater than 2 MeV. Curiously, the three experimental inner barriers in 227-229Th show a reversed odd-even staggering, with the highest barrier in the even - even isotope.
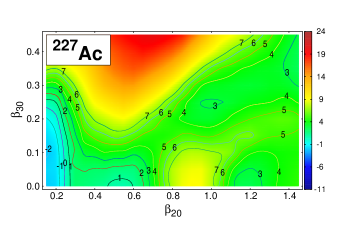
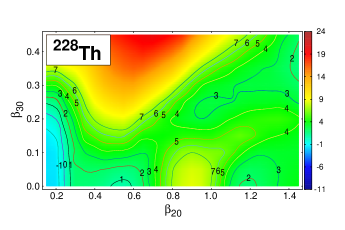
To study the intriguing puzzle of too-low first fission barriers in light thorium nuclei, the so called ”thorium anomaly”, we turned to comparisons of PES’s obtained for Th with those for slightly lighter Ac isotopes. According to the empirical data, the outer fission barrier in (pre-)actinides is much higher than the first (inner) one Nemilov1983 and this is probably why in many experimental studies the single-humped barrier is considered as the correct one, cf Table 2 for , where the single experimental barriers are close to our calculated second barriers rather than the first. In Fig. 6, we show energy surfaces for 227Ac and 228Th obtained, as other PES’s presented below, from the 7-dimensional grid (II.3) by the energy minimization over 5 not displayed deformations (with dipole deformation fixed by the center of mass condition). The ground state in 227Ac is calculated at , the second minimum at , and a very shallow third minimum at . As can be seen in the map, the second fission barrier is much higher and more elongated than the rather unprominent first one. It should be also kept in mind that the first barrier is still reduced by the triaxiality, not included in Fig. 6. The PES for , also in Fig. 6, is very similar to that of , and both second barriers are close to the experimental estimates. From the point of view of our results it would be natural to interpret barriers in both nuclei in the same manner. However, in the empirical interpretation there is no first barrier in 227Ac, while the one in 228Th is nearly as high (6.2 MeV) as the second one (6.5 MeV). Surely, it would be good to understand the reason of such an abrupt change.
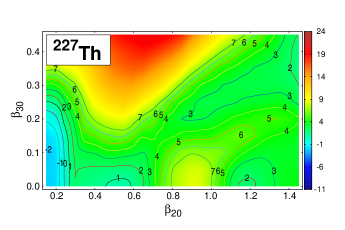
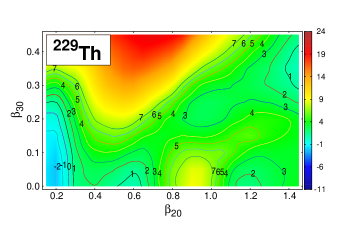
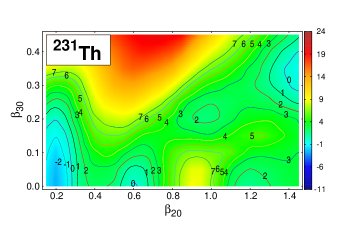
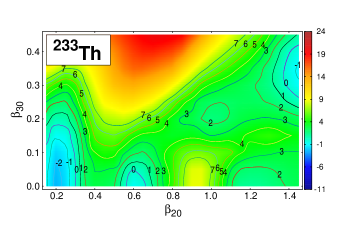
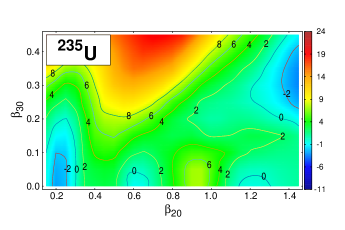
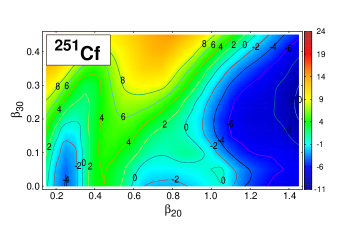
A sequence of four maps in Fig. 7 for odd-neutron thorium isotopes illustrates the calculated evolution - i.e. heights and mutual positions - of the first and second fission saddles (the PES’s for even-even thorium isotopes show very similar picture). As one can see, with increasing neutron number, the first fission barrier, corresponding to , becomes more pronounced while initially shallow second minimum becomes more deep. For , the second fission barrier splits into two peaks divided by a shallow third minimum about 0.5 MeV deep. For heavier actinides, the second barrier becomes much shorter and the first one becomes dominant. Two representative cases of such different energy landscapes are shown in Fig. 8: in , both calculated barrier heights and are similar, while in the second peak nearly vanishes. This illustrates the evolution of both fission barriers in actinides with increasing number of protons.
The calculated evolution of the barriers is not fully reflected in experimental evaluations. In particular, the curvature of the fission barrier (at the saddle point), on which the transmission coefficient depends exponentially, was assumed constant for groups of nuclei in Capote2009 , with the following values (in MeV):
| nucleus: | |||
| even-even | odd | odd-odd | |
| inner hump : | 0.9-1.0 | 0.8 | 0.6 |
| outer hump : | 0.6 | 0.5 | 0.4 |
A conceptual difficulty in comparing calculated and experimental fission barriers is the multidimesionality, i.e. a multitude of deformation parameters involved in the fission process. While inherent in the PES approach, it is omitted in the empirical estimates which are based on one-dimensional models. This can be clearly appreciated when viewing one of the maps, e.g. for 235U in Fig. 8, where it may be seen that the curvature at the saddle will depend on the direction it is traversed - in this map it will be the choice of the direction in the quadrupole - octupole plane, but in general it will involve all employed deformations. This relates to the nature of fission as a dynamic process, while the picture used here is static.
Finally, the occurrence of the third minimum and the third barrier additionally complicates the description of fission. In these calculations, the third barriers in are smaller than 0.5 MeV, while for they are larger than 0.5 MeV and visible in Fig.7. One should note, however, that the third barriers come out lower when one allows for an independent change in (i.e. when is not fixed by the center of mass condition as here), as in Kowal2012 ; Jachimowicz2013 .
III.6 Effect of the pairing-strength increase
Here, we address the already mentioned overestimate of the calculated fission barriers in odd - or/and odd - systems by a too large effect of blocking. We stress that we do not consider an overall (i.e. through all nuclei) increase of the pairing strengths. For sure, this would decrease all barriers bringing them into a better statistical agreement with the data, but, as indicated in subsection III A, at the cost of spoiling the fit to atomic masses.
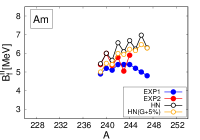
In order to evaluate the effect on the barriers in odd and odd - odd nuclei we repeated the whole calculation for Am isotopes with pairing stronger for odd protons and odd neutrons. The results - inner and outer barrier heights, marked by orange circles, are shown in Fig. 9, together with the previous ones (black circles) and experimental data. As one can see, the calculated barriers are now lowered by up to 0.6 MeV, and thus closer to the experimental estimates. This change in Am nuclei leads to a decrease in statistical deviations of our barriers from the two sets of experimental data given in Tables I and III: by 0.05 - 0.07 MeV for the first, and by 0.02 - 0.04 MeV for the second barriers.
A larger increase in pairing strengths for odd-particle number systems would lead to the inversion of the odd - even staggering in barriers that is not seen in the data, and counter-intuitive in face of longer fission half-lives in odd- nuclei Hessberger2017 . So, the test indicates 0.5 - 0.6 MeV as the maximal possible overestimate of barrier heights in odd and odd - odd nuclei introduced by blocking. Quite similar conclusion had been obtained earlier in the region of superheavy nuclei Jachimowicz2017_II . It may be mentioned that the applied increase in the pairing strengths only moderately increases the discrepancy between calculated and experimental g.s. masses - on average by , up to 0.3 MeV.
IV Discussion and Summary
We have systematically determined inner and outer fission barrier heights for 75 actinides, within the range from actinium to californium, including odd- and odd-odd systems, for which experimental estimates were accessible. Obtained barriers are in most cases higher than the experimental estimates. For odd- and odd-odd nuclei, a (smaller) part of this effect may be a consequence of the decrease in the pairing gap due to blocking. Our test performed for Am nuclei have shown that blocking can rise barriers by up to 0.6 MeV, what is consistent with our previous tests and results in the region of superheavy nuclei.
A statistical comparison of our fission barrier heights with available experimental estimates gives the average discrepancy and the rms deviation not greater than 0.82 MeV and 0.94 MeV, respectively. This concerns both: first and second fission barriers. Determined excitation energies of superdeformed secondary minima reproduce quite well the general trends of experimental data. The largest discrepancies do not exceed 1.1 MeV.
The most direct comparison of our results with other calculations is possible with Moller2009 and Goriely2007 . The second fission barriers calculated by P. Möller et al. Moller2009 show only a slightly larger statistical deviation from the experimental values than ours ( 1.07 and 0.90 MeV for the sets I and II, respectively); their first barriers are statistically more distant from the evaluated data ( 1.48 and 1.36 MeV for sets I and II). On the other hand, the rms deviations obtained within the HFB Skyrme model in Goriely2007 are astonishingly small, 0.67 and 0.65 MeV, for the first and second barriers, respectively. The comparison of results of Goriely2007 and ours is, however, less direct, as different nuclei (52 with first barriers, but only part of them actinides, and a much smaller number for second barriers - cf Fig. 5 in Goriely2007 ) are included. The relatively small rms deviation from the experimental data was obtained in Goriely2007 thanks to the subtraction of a purely phenomenological collective correction term. Effective mostly at large deformations, it served exclusively to correct the Skyrme BSk14 HFB fission barriers, without spoiling the mass fit too much.
Concerning the results for even-even actinides obtained by other authors, their agreement with the (smaller number of) data seems to depend on corrections applied to the pure mean-field results. Generally, the selfconsistent non-relativistic models produce too large barriers if one defines them as the energy difference between the saddle and the g.s. minimum. They can be brought to a better agreement with experimental estimates when additional corrections are applied, like the subtraction of the collective rotational energy. A very careful analysis of such corrections for SkM* interaction was given in BONNEAU04 and the obtained agreement with experimental barriers illustrated for six actinide nuclei. The dependence of results obtained with the Gogny force on the assumed corrections, i.e. the way the barrier is interpreted, is well documented in Delaroche2006 ; Robledo2014 ; Lemaitre2018 . The barriers obtained in Robledo2014 with the D1M interaction for 14 nuclei are overestimated by 2-4 MeV. Second barriers obtained in calculations with the D1S force Delaroche2006 are overestimated by 1-2 MeV for . The first barriers were either too high when calculated in a more standard way, or closer to the data when defined, rather arbitrarily, as the energy difference between the state with the wave function concentrated in the barrier region and the ground state. In the recent study Lemaitre2018 , the first and second barriers in 14 actinide nuclei were reproduced with the rms deviation of 0.52 and 0.45 MeV, respectively, when the collective energy correction with adiabatic mass parameters was applied. It has to be mentioned though that the triaxiality was included in a rather crude way in this latter study. The relativistic mean-field calculations with the NL3* interaction Abusara2010 reproduced 22 first barriers with the average deviation from experimental values of 0.76 MeV. An even better agreement with experimental data of calculated 19 first and 15 second barriers was obtained in the RMF model with the PC-PK1 interaction in Zhou2014 .
One can notice that the overall increase in pairing strengths would bring our calculated barriers closer on average (e.g. in the sense of rms deviation) to the experimental estimates. However, it would deteriorate the agreement between the calculated and experimental masses in actinides. Moreover, the statistical improvement would be accompanied by local deteriorations. This concerns most of Pa and U isotopes, where calculated first fission barriers would become too low vs empirical estimates. Already large discrepancies in inner barriers for Th isotopes would increase.
It should be stressed that some discrepancies seem common to many models. It is the case of Th anomaly. In calculations, there is a gradual change in widths and heights of inner and outer barriers with /. In Th, inner barriers gain prominence with , while in experimental evaluations, high and wide inner barriers are assumed in all Th isotopes. As we pointed out, in nearby Ac nuclei, calculated PES’s are similar to those in Th, while the inner barrier vanishes from experimental evaluations. Such an abrupt change in assumptions between Ac and Th seems mysterious.
The other example is an increase with in the second barriers in Pu and Am, resulting from many micro-macro and non-relativistic self-consistent calculations, but not seen in data. It seems to point to a more general problem in models or in our understanding.
There is also an intriguing question of third minima, which in our calculations, if appear at all, are rather shallow - in most cases do not exceed 0.5 - 0.6 MeV in depth. Again, there were experimental evaluations claiming much deeper third minima, see e.g. Krasz98 ; Csige2009 .
Finally, it seems that while a moderate reduction in deviation of the calculated fission barriers from experimental estimates is still possible in our and other models, it is not obvious how to achieve it without spoiling other observables one would also like to reproduce.
References
- (1) F. P. Hessberger, Eur. Phys. J. A 53, 75 (2017).
- (2) S. Ćwiok, J. Dudek, W. Nazarewicz, J. Skalski, and T. Werner, Comput. Phys. Commun. 46, 379 (1987).
- (3) H. J. Krappe, J. R. Nix, and A. J. Sierk, Phys. Rev. C 20, 992 (1979).
- (4) P. Jachimowicz, M. Kowal, and J. Skalski, Phys. Rev. C 95, 014303 (2017).
- (5) M. Kowal, P. Jachimowicz, and A. Sobiczewski, Phys. Rev. C 82, 014303 (2010).
- (6) P. Jachimowicz, M. Kowal, and J. Skalski, Phys. Rev. C 85, 034305 (2012).
- (7) A. Mamdouh, J. M. Pearson, M. Rayet, and F. Tondeur, Nucl. Phys. A 644, 389 (1998).
- (8) W. D. Myers, and W. J. Swiatecki, Nucl. Phys. A 601, 141 (1996).
- (9) P. Möller, A. Iwamoto, Phys. Rev. C 61, 047602 (2000).
- (10) P. Möller et al., Phys. Rev. C 79, 064304 (2009).
- (11) S. Goriely, M. Samyn, and J. M. Pearson, Phys. Rev. C 75, 064312 (2007).
- (12) K. Pomorski, B. Nerlo-Pomorska, J. Bartel, and C. Schmitt, Phys. Rev. C 97, 034319 (2018).
- (13) L. Bonneau, P. Quentin and D. Samsoen, Eur. Phys. J. A 21, 391 (2004).
- (14) J.-P. Delaroche, M. Girod, H. Goutte, and J. Libert, Nucl. Phys. A 771, 103 (2006).
- (15) R.-Rodriguez-Guzman, and L. M. Robledo, Phys. Rev. C 89, 054310 (2014).
- (16) J. F. Lemaitre, S. Goriely, S. Hilaire, and N. Dubray, Phys. Rev. C 98, 024623 (2018).
- (17) H. Abusara, A. V. Afanasjev, and P. Ring, Phys. Rev. C 82, 044303 (2010).
- (18) B. N. Lu, J. Zhao, E.-G. Zhao, and S.-G. Zhou, Phys. Rev. C 89, 014323 (2014).
- (19) P. Jachimowicz, M. Kowal, and J. Skalski, Phys. Rev. C 89, 024304 (2014).
- (20) K. Pomorski, J. Bartel, Int. J. Mod. Phys. E 15 (2), 417 (2006).
- (21) P. Jachimowicz, M. Kowal, and J. Skalski, Phys. Rev. C 95, 034329 (2017).
- (22) S. Ćwiok and A. Sobiczewski, Z. Phys. A 342, (1992).
- (23) S. Ćwiok, J. Dobaczewski, P. -H. Heenen, P. Magierski, and W. Nazarewicz, Nucl. Phys. A 611, 211 (1996).
- (24) R. A. Gherghescu, J. Skalski, Z. Patyk and A. Sobiczewski, Nucl. Phys. A 651, (1999).
- (25) A. K. Dutta, J. M. Pearson, F. Tondeur, Phys. Rev. C 61, 054303 (2000).
- (26) J. Dechargé, J.F. Berger, M. Girod, and K. Dietrich, Nucl. Phys. A 716, 55 (2003).
- (27) S. Ćwiok, P.-H. Heenen, W. Nazarewicz, Nature 433, 709 (2005).
- (28) A. Dobrowolski, K. Pomorski, J. Bartel, Phys. Rev. C 75, 024613 (2007).
- (29) M. Kowal, A. Sobiczewski, Int. J. Mod. Phys. E18 4, 914, (2009).
- (30) M. Kowal and J. Skalski, Phys. Rev. C 85, 061302(R) (2012).
- (31) P. Jachimowicz, M. Kowal, and J. Skalski, Phys. Rev. C 87, 044308 (2013).
- (32) I. Muntian, Z. Patyk, and A. Sobiczewski, Acta Phys. Pol. B 32, 691 (2001).
- (33) G. Audi, A.H. Wapstra, and C. Thibault, Nucl. Phys. A 729, 337 (2003).
- (34) S. M. Polikhanov et al., Sov. Phys. JETP 15, 1016 (1962).
- (35) G. N. Flerov and V. A. Druin, Preprint R-2539, JINR, Dubna (1966).
- (36) V. M. Strutinsky, Nucl. Phys. A 95, 420 (1967).
- (37) D. Pansegrau et al, Phys. Lett. B 484, 1 (2000).
- (38) D. Gassmann et al., Physics Letters B 497, 3-4, 11 (2001).
- (39) P. G. Thirolf and D. Habs, Prog. Part. Nucl. Phys. 49, 325 (2002); P. Thirolf, D.Dc. Thesis, Ludwig-Maximilians-Universitat München (2003).
- (40) Balraj Singh, Richard B. Firestone, and S.Y. Frank Chu, Nuclear Data Sheets 78, 1 (1996).
- (41) N. Nikolov, N. Schunck, W. Nazarewicz, M. Bender, and J. Pei, Phys. Rev. C 83, 034305 (2011).
- (42) G. N. Smirenkin, IAEA Report No. INDC(CCP)-359, Vienna, 1993.
- (43) T. Bürvenich, M. Bender, J. A. Maruhn, and P.-G. Reinhard, Phys. Rev. C 69, 014307 (2004).
- (44) R. Capote et al., At. Data. and Nucl. Data Tables 110, 3107 (2009).
- (45) M. Samyn, S. Goriely, and J. M. Pearson, Phys. Rev. C 72, 044316 (2005).
- (46) A. Dobrowolski, K. Pomorski, and J. Bartel, Phys. Rev. C 75, 024613 (2007).
- (47) Yu. A. Nemilov et al., Yad. Fiz. 37, 819 (1983).
- (48) A. Krasznahorkay et al., Phys. Rev. Lett. 80, 2073 (1998).
- (49) L. Csige et al., Phys. Rev. C 80, 011301(R) (2009).