Eva: Attribute-Aware Network Segmentation
Abstract
Identifying topologically well-defined communities that are also homogeneous w.r.t. attributes carried by the nodes that compose them is a challenging social network analysis task. We address such a problem by introducing Eva, a bottom-up low complexity algorithm designed to identify network hidden mesoscale topologies by optimizing structural and attribute-homophilic clustering criteria. We evaluate the proposed approach on heterogeneous real-world labeled network datasets, such as co-citation, linguistic, and social networks, and compare it with state-of-art community discovery competitors. Experimental results underline that Eva ensures that network nodes are grouped into communities according to their attribute similarity without considerably degrading partition modularity, both in single and multi node-attribute scenarios111Paper accepted at the 8th International Conference on Complex Networks and their Applications, 2019 - Lisbon, Portugal..
Keywords Communty Discovery Attributed Networks
1 Introduction
Among the most frequent data mining tasks, segmentation requires a given population, to partition it into internally homogeneous clusters so to better identify different cohorts of individuals sharing a common set of features. Classical approaches [1] model this problem on relational data, each individual (data point) described by a structured list of attributes. Indeed, in several scenarios, this modeling choice represents an excellent proxy to address context-dependent questions (e.g., segment retail customers or music listeners by their adoption behaviors). However, such methodologies by themselves are not able to answer a natural, yet non-trivial question: what does it mean to segment a population for which the social structure is known in advance?
A first way of addressing such an issue can be identified in the complex network counterpart to the data mining clustering problem, Community Discovery. Node clustering, also known as community discovery, is one of the most productive subfields of the complex network analysis playground. Many algorithms have been proposed so far to efficiently and effectively partition graphs into connected clusters, often maximizing specifically tailored quality functions. One of the reasons this task is considered among the most challenging, and intriguing ones, is its ill-posedness: there not exist a single, universally shared, definition of what a community should look like. Every algorithm, every study, defines node partitions by focusing on specific topological aspects (internal density, separation…) thus leading to the possibility of identifying different, even conflicting, clusters on top of the same topology. Generalizing, we can define the community discovery problem using a meta definition such as the following:
Definition 1 (Community Discovery (CD))
Given a network , a community is a set of distinct nodes of . The community discovery problem aims to identify the set of all the communities in .
Classical approaches to the CD problem focus on identifying a topologically accurate segmentation of nodes. Usually, the identified clusters – either crisp or overlapping, producing complete or partial node coverage – are driven only by the distribution of edges across network nodes. Such constraint, in some scenarios, is not enough. Nodes, the proxies for the individuals we want to segment, are carriers of semantic information (e.g., age, gender, location, spoken language…). However, segmenting individuals by only considering their social ties might produce well defined, densely connected, cohorts, whose homogeneity w.r.t. the semantic information is not guaranteed. Usually, when used to segment a population embedded into a social context, CD approaches are applied assuming an intrinsic social homophily of individuals, often summarized with the motto “birds of a feather flock together". Indeed, such a correlation in some scenarios might exist; however, it is not always given, and its strength could be negligible. To address such issue, in this work, we approach a specific instance of the CD problem, namely Labeled Community Discovery:
Definition 2 (Labeled Community Discovery (LCD))
Let be a labeled graph where is the set of vertices, the set of edges, and a set of categorical attributes such that , with , identifies the set of labels associated to . The labeled community discovery problem aims to find a node partition of that maximizes both topological clustering criteria and label homophily within each community.
LCD focuses on obtaining topologically well-defined partitions (as in CD) that also results in homogeneous labeled communities. An example of contexts in which an LCD approach could be helpful is, for instance, the identification, and impact evaluation, of echo chambers in online social networks, a task that cannot be easily addressed relying only on standard CD methodologies.
In this work, we introduce a novel LCD algorithm, Eva (Louvain Extended to Vertex Attributes), tailored to extract label-homogeneous communities from a complex network. Our approach configures as a multi-criteria optimization one and extends a classical hierarchical algorithmic schema used by state-of-art CD methodologies.
The paper is organized as follows. In Section 2 we introduce Eva. There we discuss its rationale and its computational complexity. In Section 3 we evaluate the proposed method on real-world datasets, comparing its results with state-of-art competitors. Finally, in Section 4 the literature relevant to our work is discussed, and Section 5 concludes the paper.
2 The Eva algorithm
In this section, we present our solution to the LCD problem: Eva222Python code available at: https://github.com/GiulioRossetti/EVA.
Eva is designed as a multi-objective optimization approach.
It adopts a greedy modularity optimization strategy, inherited by the Louvain algorithm [2], pairing it with the evaluation of intra-community label homophily.
Eva main goal is maximizing the intra-community label homophily while assuring high partition modularity.
In the following, we will detail the algorithm rationale and study its complexity.
Eva is designed to handle networks whose nodes possess one or more labels having categorical values.
Algorithm Rationale.
The algorithmic schema of Eva is borrowed from the Louvain one: a bottom-up, hierarchical approach designed to optimize a well-known community fitness function called modularity.
Definition 3 (Modularity)
Modularity is a quality score that measures the strength of the division of a network into modules. It takes values in [-1, 1] and, intuitively, measures the fraction of the edges that fall within the given partition minus the expected fraction if they were distributed following a null model. Formally:
| (1) |
where is the number of graph edges, is the entry of the adjacency matrix for , the degree of and identifies an indicator function taking value 1 iff belong to the same cluster, 0 otherwise.
Eva leverages the modularity score to incrementally update community memberships. Conversely, from Louvain, such an update is weighted in terms of another fitness function tailored to capture the overall label dispersion within communities, namely purity.
Definition 4 (Purity)
Given a community its purity is the product of the frequencies of the most frequent labels carried by its nodes. Formally:
| (2) |
where is the label set, is a label, is an indicator function that takes value 1 iff . The purity of a partition is then the average of the purities of the communities that compose it:
| (3) |
Purity assumes values in [0,1] and it is maximized when all the nodes belonging to the same community share a same attribute profile.
The primary assumption underlying the purity definition is that node labels can be considered as independent and identically distributed random variables: in such a scenario, considering the product of maximal frequency labels is equivalent to computing the probability that a randomly selected node in the given community has exactly that specific label profile.
Eva takes into account both modularity and purity while incrementally identifying a network partition. To do so, it combines them linearly, thus implicitly optimizing the following score:
| (4) |
where is a trade-off parameter that allow to tune the importance of each component for better adapt the algorithm results to the analyst needs.
Eva pseudocode is highlighted in Algorithm 1. Our approach takes as input a labeled graph, and a trade-off value, and returns a partition . As a first step, line 2, Eva assigns each node to a singleton community and computes the initial quality as a function of both modularity and purity. After the initialization step, the algorithm main-loop is executed (lines 5-9). Eva computation, as Louvain, can be broken in two main components: (i) greedy identification of the community merging move that produces the optimal increase of the partition quality (row 6), and (ii) network reconstruction (line 7). In Algorithm 2 is detailed the procedure applied to identify the best move among the possible ones. Eva inner loop cycles over the graph nodes and, for each of them, evaluate the gain in terms of modularity and purity while moving a single neighboring node to its community (lines 18-24). For each pair the local gain produced by the move is computed: Eva compares such value with the best gain identified so far and, if needed, updates the latter to keep track of the newly identified optimum: in case of ties, the move that results in a higher increase of the community size is preferred (lines 25-28). Such a procedure is repeated until no more moves are possible (line 29).
As a result of Algorithm 2, the original allocation of nodes to communities is updated.
After this step, the aggregate function (Algorithm 1, line 7) hierarchically updates the original graph transforming its communities in nodes, thus allowing to repeat the algorithm main loop until there are no moves able to increase the partition quality (lines 8-9).
Eva Complexity.
Being a Louvain extension, Eva shares the same time complexity, namely .
Regarding space consumption, the increase w.r.t. Louvain is related only to the data structures used for storing node labels.
Considering labels, the space required to associate them to each node in is : assuming we get a space complexity of .
3 Experiments
To experimentally evaluate Eva, in this section, we applied it to five real-world network datasets providing node attributes.
Moreover, we compared the obtained partitions, in terms of modularity and purity, to alternative ones identified by state-of-art CD and LCD approaches.
Datasets.
In our analysis, we included the following networks:
-
•
Cora[3] (2708 nodes, 5279 edges) is a co-citation network among computer science research papers, each labeled with one of 7 possible topics;
-
•
G+ (22355 nodes, 29032 edges) is a subgraph of the Google+ social network[4] whose nodes are labeled by their education (12 different levels);
-
•
IMDB[5] (1169 nodes, 20317 edges) is a movie network, whose nodes are labeled with a binary value identifying them as blockbusters or not;
-
•
Sense2vec[6] (5309 nodes, 15170 edges) is a complex semantic network built on top of word vectors pre-trained on Reddit comments. Node labels identify the word part of speech;
-
•
Amherst (2235 nodes, 90954 edges) is one of the 100 networks of Facebook100[7]: nodes are labeled with five different categorical attributes, each having multiple values. We identify with Amh1 to Amh5 the network enriched by, respectively, 1 to 5 node attributes.
Nodes of the first four datasets are characterized by a single attribute having multiple values, e.g., , while, for the last one, five attributes compose each node profile, e.g., .
Analytical Results. To evaluate Eva, we focus on answering the following research questions:
-
1)
does increasing affect the number of identified communities?
-
2)
does increasing affect partition topological quality to favor purity?
-
3)
does the number of attributes in the node profile affect Eva communities?
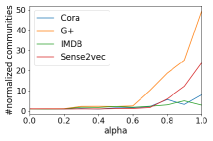
Partition set cardinality. We applied Eva to each dataset varying in [0,1], with steps of , thus obtaining 11 partitions, each of whom we identify as .
It should be noted that, by definition, we can easily characterize the partitions in the two limit cases: (i) corresponds to the Louvain partition; (ii) identifies the locally biggest connected components whose nodes share the same label profile.
It should be noted that in a fully connected graph (as well as in a strongly positive assortative one) imposing generates a number of communities equal to the existing combination of attribute profiles in the graph.
We identify the number of community in with .
To better compare partition cardinality trends across datasets, we normalize each of them point-wise w.r.t. their .
The results, visually summarized in Figure 1, underline that Eva produces more fragmented partitions while increasing the value of .
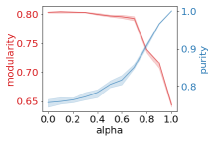
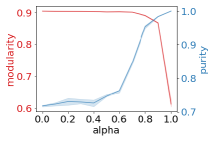
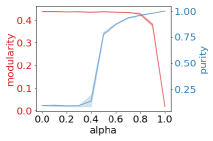
Modularity vs. Purity. Indeed, given the positive correlation between and , we need to study how to set the former so to balance partition modularity and purity. To such extent, we studied how such measures vary w.r.t. our control parameter, – as shown in Figure 2(a-c), where we report the modularity and purity trends as a function of in a two y-axes chart. We observe that, until reaching high values, modularity does not degrade considerably. Moreover, the partitions obtained with and are the ones that usually better harmonize the two quality functions. In particular, focusing on the case, we can observe that in G+ a modularity decreases of approximately points, in Cora and Sense2vec of and in IMDB the absence of such a degradation.
To better understand Eva performances on the analyzed datasets, such results are compared with the ones obtained by five among CD and LCD state-of-art algorithms (Leiden, Infomap, LP, Louvain, and Sac1): Table 1 reports the complete comparison. Indeed, there are several reasons to compare Eva to standard CD algorithms exploiting only topological information, among them:
-
i)
quantify the modularity degradation w.r.t. those approaches that are designed to maximize such function (i.e., Leiden[8] and Louvain[2]). We can observe how such algorithms can guarantee slightly higher modularity than Eva, at the cost of a huge gap in purity. Such behavior is probably due to the resolution limit[9] that affects modularity optimization that in Eva is mitigated by a modified objective function that reduces avalanche effects;
- ii)
Moving to the LCD playground, we compared Eva to Sac1[12], which adopts a similar rationale and is designed to address the same problem. Table 1 underlines how Sac1 always produces the lowest modularity partition while not outperforming Eva in terms of purity.
Indeed, to understand if the purities of the partitions identified by the compared algorithms are statistically significant, we have to compare them to the ones we should expect by randomly clustering graph nodes. To do so, we performed a z-test.
| Modularity | Purity | |||||||
| Cora | G+ | IMDB | Sense2vec | Cora | G+ | IMDB | Sense2vec | |
| Louvain | .80 | .91 | .71 | .90 | .75 | .42 | .73 | .81 |
| Leiden | .80 | .92 | .71 | .90 | .75 | .42 | .72 | .74 |
| Infomap | .63 | .73 | .69 | .63 | .86 | .59 | .82 | .80 |
| LP | .64 | .72 | .65 | .78 | .90 | .63 | .82 | .81 |
| Sac1 | .00 | - | -.002 | .00 | .49 | - | .68 | .79 |
| Eva0.8 | .74 | .82 | .71 | .89 | .89 | .90 | .86 | .94 |
| Eva0.9 | .76 | .76 | .71 | .86 | .96 | .98 | .94 | .98 |
| z-score | p-value | |||||||
|---|---|---|---|---|---|---|---|---|
| Cora | G+ | IMDB | Sense2vec | Cora | G+ | IMDB | Sense2vec | |
| Louvain | -2.18 | -1.15 | -2.13 | -0.9 | 0.01 | 0.1 | 0.01 | 0.1 |
| Leiden | -0.22 | -1.18 | -2.13 | -1.03 | 0.02 | 0.1 | 0.03 | 0.1 |
| Infomap | -2.98 | -1.78 | -1.80 | -1.28 | 0.01 | 0.03 | 0.02 | 0.01 |
| LP | -3.40 | -1.80 | -1.60 | -1.21 | 0.00 | 0.03 | 0.05 | 0.1 |
| Eva0.8 | -3.80 | -5.78 | -2.15 | -2.98 | 0.00 | 0.00 | 0.01 | 0.00 |
| Eva0.9 | -7.80 | -9.27 | -3.63 | -6.90 | 0.00 | 0.00 | 0.00 | 0.00 |
We consider as null model, for each network, the frequency of the most frequent node attribute value. The underlying idea is that the more the partition purity deviates from the null model, the less the attribute homophily within each community could have also be obtained by randomly sampling the same number of nodes. Formally we compute the z-score as:
| (5) |
where is the relative frequency of the most frequent attribute value, is the purity as defined in Section 2 (for each dataset, the values are reported in Table 1), and is its standard deviation.
of Cora is , of G+ is , of IMDB and Sense2vec is (with the difference that IMDB vertices can be labeled by two binary values equally distributed among the network, while Sense2vec nodes attribute can assume more than two values while the half of word vectors are labeled as nouns).
Table 2 reports the z-score, and relative p-value, for all the datasets and compared algorithms.
We can observe how the purity of the partitions identified can be considered statistically significant for very low p-values (with modularity based CD approaches registering the highest cut-off values, and LCD the lowest ones).
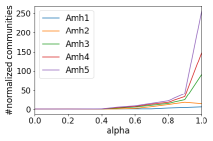
Multi-Attribute profiles. The last question regards the multi-attribute case: in particular, we are interested in quantifying how the number of distinct node-attributes affects the number of communities identified as well as their purity.
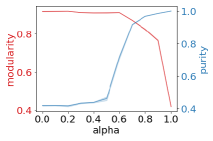
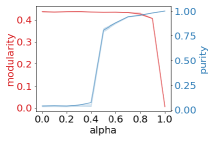
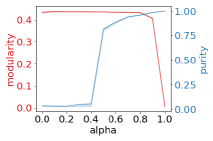
Indeed, we have already seen that increasing the number of Eva communities increases as well in single-attribute networks: Figure 1(b) confirms such trend also on multi-attribute ones. However, we can also observe that the number of attributes considered deeply affects such a trend, at least for high values of . Figure 2(d-f) shows the modularity and purity trends for multi-attribute datasets. Even varying the number of attributes we can observe a relative absence of considerable disruption of partition modularity and a progressive increase of its purity that, for rapidly reach saturation. Table 3 compares modularity and purity for four different instantiations of Eva on the Amh dataset while varying the number of node attributes from 1 to 5. We can observe that both quality functions are stable w.r.t. the number of attributes and that offers a viable compromise to our aim.
| Modularity | Purity | |||||||||
|---|---|---|---|---|---|---|---|---|---|---|
| Amh1 | Amh2 | Amh3 | Amh4 | Amh5 | Amh1 | Amh2 | Amh3 | Amh4 | Amh5 | |
| Eva0.1 | .43 | .43 | .43 | .43 | .43 | .49 | .13 | .09 | .04 | .03 |
| Eva0.5 | .43 | .43 | .43 | .43 | .43 | .49 | .73 | .77 | .79 | .80 |
| Eva0.8 | .43 | .42 | .42 | .42 | .43 | .95 | .93 | .95 | .94 | .96 |
| Eva0.9 | .42 | .36 | .38 | .40 | .40 | .97 | .95 | .97 | .95 | .98 |
4 Related work
In this section, a brief overview of previous studies addressing LCD is presented. As previously discussed, classic CD algorithms deal only with the topological information since their clustering schemes are established by optimizing structural quality functions. In this scenario, LCD is a challenging and more sophisticated task, aiming to balance the weight of topological and attribute related information expressed by data enriched networks to extract coherent and well-defined communities.
At the moment, an emerging LCD algorithm classification proposal[13] organizes the existing algorithms in three families on the basis of the different methodological principles they leverage: i) topological-based LCD, the attribute information is used to complement the topological one that guides the partition identification; ii) attributed-based LCD, topology is used as refinement for partitions identified leveraging the information offered by node attributes; iii) hybrid LCD approach, the two types of information are exploited complementary to obtain the final partition.
Examples of topological-based LCD are of three types, those that weight the edges taking account of the attribute information[14], those that use a label-augmented graph[15] and those that extend a topological quality function in order also to consider the attribute information[12, 16]. All three methodologies share the idea that the attribute information should be attached to the topological one, while, in an attributed-based LCD, attributes are merged with the structural information into a similarity function between vertices[12, 17]. Finally, examples of hybrid LCD approaches are those that use an ensemble method to combine the found partitions[18] and those that use probabilistic models treating vertex attributes as hidden variables[19].
5 Conclusion
In this paper, we introduced Eva, a scalable algorithmic approach to address the LCD problem that optimizes the topological quality of the communities alongside to attribute homophily. Experimental results highlight how the proposed method outperforms CD and LCD state of art competitors in terms of community purity and modularity, allowing to identify high-quality results even in multi-attribute scenarios.
As future works, we plan to generalize Eva methodology, allowing the selection of alternative quality functions, both topological (e.g., the conductance rather than the modularity) and attribute related – e.g., performing different assumptions for the purity computation than the independence of the vertex attributes. Moreover, we plan to integrate our approach within the CDlib project[20] and to extend it to support numeric node attributes.
Acknowledgment
This work is partially supported by the European Community’s H2020 Program under the funding scheme “INFRAIA-1-2014-2015: Research Infrastructures” grant agreement 654024, http://www.sobigdata.eu, “SoBigData”.
References
- [1] J. MacQueen et al., “Some methods for classification and analysis of multivariate observations,” in Proceedings of the fifth Berkeley symposium on mathematical statistics and probability, vol. 1, pp. 281–297, Oakland, CA, USA, 1967.
- [2] V. D. Blondel, J.-L. Guillaume, R. Lambiotte, and E. Lefebvre, “Fast unfolding of communities in large networks,” Journal of statistical mechanics: theory and experiment, vol. 2008, no. 10, p. P10008, 2008.
- [3] A. K. McCallum, K. Nigam, J. Rennie, and K. Seymore, “Automating the construction of internet portals with machine learning,” Information Retrieval, vol. 3, pp. 127–163, Jul 2000.
- [4] J. Leskovec and J. J. Mcauley, “Learning to discover social circles in ego networks,” in Advances in Neural Information Processing Systems, pp. 539–547, 2012.
- [5] J. Neville, D. Jensen, L. Friedland, and M. Hay, “Learning relational probability trees,” in Proceedings of the Ninth ACM SIGKDD International Conference on Knowledge Discovery and Data Mining, KDD ’03, pp. 625–630, ACM, 2003.
- [6] A. Trask, P. Michalak, and J. Liu, “sense2vec - A fast and accurate method for word sense disambiguation in neural word embeddings,” CoRR, vol. abs/1511.06388, 2015.
- [7] A. L. Traud, P. J. Mucha, and M. A. Porter, “Social structure of facebook networks,” CoRR, vol. abs/1102.2166, 2011.
- [8] V. A. Traag, L. Waltman, and N. J. van Eck, “From louvain to leiden: guaranteeing well-connected communities,” CoRR, vol. abs/1810.08473, 2018.
- [9] S. Fortunato and M. Barthelemy, “Resolution limit in community detection,” Proceedings of the national academy of sciences, vol. 104, no. 1, pp. 36–41, 2007.
- [10] M. Rosvall and C. T. Bergstrom, “Maps of random walks on complex networks reveal community structure,” Proceedings of the National Academy of Sciences, vol. 105, no. 4, pp. 1118–1123, 2008.
- [11] U. N. Raghavan, R. Albert, and S. Kumara, “Near linear time algorithm to detect community structures in large-scale networks,” Physical review E, vol. 76, p. 036106, Sep 2007.
- [12] T. A. Dang and E. Viennet, “Community detection based on structural and attribute similarities,” International Conference on Digital Society (ICDS), 2012.
- [13] I. Falih, N. Grozavu, R. Kanawati, and Y. Bennani, “Community detection in attributed network,” in Companion Proceedings of the The Web Conference 2018, pp. 1299–1306, 2018.
- [14] J. Neville, M. Adler, and D. Jensen, “Clustering relational data using attribute and link information,” in 18th International Joint Conference on Artificial Intelligence, pp. 9–15, 2003.
- [15] Y. Zhou, H. Cheng, and J. X. Yu, “Graph clustering based on structural/attribute similarities,” Proc. VLDB Endow., vol. 2, pp. 718–729, Aug. 2009.
- [16] D. Combe, C. Largeron, M. Géry, and E. Egyed-Zsigmond, “I-louvain: An attributed graph clustering method,” in Advances in Intelligent Data Analysis XIV, (Cham), pp. 181–192, Springer International Publishing, 2015.
- [17] I. Falih, N. Grozavu, R. Kanawati, and Y. Bennani, “Anca : Attributed network clustering algorithm,” in Complex Networks & Their Applications VI, (Cham), pp. 241–252, Springer International Publishing, 2018.
- [18] H. Elhadi and G. Agam, “Structure and attributes community detection: Comparative analysis of composite, ensemble and selection methods,” in Proceedings of the 7th Workshop on Social Network Mining and Analysis, SNAKDD ’13, pp. 10:1–10:7, ACM, 2013.
- [19] J. Yang, J. McAuley, and J. Leskovec, “Community detection in networks with node attributes,” in 2013 IEEE 13th International Conference on Data Mining, pp. 1151–1156, Dec 2013.
- [20] G. Rossetti, L. Milli, and R. Cazabet, “Cdlib: a python library to extract, compare and evaluate communities from complex networks,” Applied Network Science, vol. 4, no. 1, p. 52, 2019.