MSD-Kmeans: A Novel Algorithm for Efficient Detection of Global and Local Outliers
Abstract
Outlier detection is a technique in data mining that aims to detect unusual or unexpected records in the dataset. Existing outlier detection algorithms have different pros and cons and exhibit different sensitivity to noisy data such as extreme values. In this paper, we propose a novel cluster-based outlier detection algorithm named MSD-Kmeans that combines the statistical method of Mean and Standard Deviation (MSD) and the machine learning clustering algorithm K-means to detect outliers more accurately with the better control of extreme values. There are two phases in this combination method of MSD-Kmeans: (1) applying MSD algorithm to eliminate as many noisy data to minimize the interference on clusters, and (2) applying K-means algorithm to obtain local optimal clusters. We evaluate our algorithm and demonstrate its effectiveness in the context of detecting possible overcharging of taxi fares, as greedy dishonest drivers may attempt to charge high fares by detouring. We compare the performance indicators of MSD-Kmeans with those of other outlier detection algorithms, such as MSD, K-means, Z-score, MIQR and LOF, and prove that the proposed MSD-Kmeans algorithm achieves the highest measure of precision, accuracy and F-measure. We conclude that MSD-Kmeans can be used for effective and efficient outlier detection on data of varying quality on IoT devices.
Keywords:
Outlier DetectionMSDK-meansMSD-Kmeans1 Introduction
Modern taxis are equipped with networked Global Positioning System (GPS) devices, a type of IoT devices, from which sufficient information on trip time, distances, fares, routes and speeds can be collected for administrative purposes or further analysis [16, 19, 8, 21]. Taxis play an important role in public transport provision in urban life, plugging the gaps left by buses and trains. Due to taxi fares being calculated by distance and waiting time, longer taxi trips can lead to higher fares. Factors such as traffic congestion and urban road planning could prolong taxi trips but are beyond human control. However, some greedy drivers intentionally and fraudulently take detours to push up taxi fares and pocket in more profits. Due to increased complaints of such taxi fraud received from passengers[8, 16], taxi fraud detection and regulation is becoming an essential but challenging issue. One proposed method to combat it is to monitor the big data of taxi routes and driving patterns to attempt to identify suspicious outliers deviating from the average taxi routes and fares that could indicate fraud activities [8]. Based on the frequency of occurrence, data outliers can be either random or continuous [25]; continuous outliers of longer taxi routes and higher fares are more likely to be caused by environmental factors such as traffic congestion, while random occasional ones are more likely to be due to fraudulent activities [16, 8].
Various algorithms have been proposed and developed to detect data outliers that could possibly indicate taxi fare fraud. In previous works, the main approaches include trajectories-based and parameter-based detection. Trajectories-based detection approaches analyze data of trajectories to determine whether the vehicles from starting points to destinations have detoured unnecessarily [15]. The full path from the starting point to the destination can be partitioned into small segments named sub-trajectories, to compare with the dataset of full paths with different sub-trajectories to detect abnormal sub-trajectories [15]. The analysis of GPS trajectory data can be further enhanced with social media data, when people post complaints of taxi detours [19]. Parameter-based approaches investigate one or more parameters such as distances, locations and speeds etc, to detect data deviating from the average or usual norm. For example, Speed-based Fraud Detection System could detect abnormal activities by calculating and identifying the excessively fast or slow speeds using data from the GPS database [16]. Both trajectories-based and parameter-based approaches could assist in not only identifying taxi fare fraud but also planning urban road networks [26, 16].
Problem Statement. While the proposed implementations have made significant progress in identifying data outliers, some of them have not proven their scalability on larger complicated datasets. In this study, we use a combination of statistical method MSD and machine learning method K-means, to further improve detection accuracy on larger datasets while minimizing the impact of noisy data. To evaluate our implementation, we used the New York City (NYC) Yellow Taxi Data, a dataset of about 1.71GB collected from registered taxis in NYC in January 2016.
Summary of Original Contributions
-
1.
We present the novel MSD-Kmeans outlier detection algorithm that combines the features from the statistical method of MSD and the machine learning method of K-means.
-
2.
We apply the MSD-Kmeans on NYC Yellow Taxi Data dataset to identify possible taxi fare fraud then demonstrates that it can efficiently detect global and local outliers.
-
3.
We compare the performance of MSD-Kmeans with other outlier detection algorithms and demonstrates that MSD-Kmeans can effectively eliminate noisy data while achieving satisfactory detection results.
2 Related work
Outlier Detection has been implemented in previous surveys and review papers using different datasets and different algorithms. Statistical methods were developed first, to measure how each individual piece of data deviate from the statistical norm or average values; its effectiveness to detect anomaly can largely depend on the model design and means of data analysis [10, 2, 20]. Machine Learning algorithms were later developed to assist in data analysis and became a popular technique for detecting outliers, such as the cluster-based K-means [5] and the density-based Local Outlier Factor (LOF) [3]. Cluster-based method plays a key role in data mining, especially in data partition[23] and classification and outlier detection[18].
K-means is a classic clustering algorithm used in outlier detection because of easiness of implementation [11]. However, K-means can be sensitive to noisy data when used to detect outlier [1]. A few studies proposed improvements of K-means for outlier detection. In [18], the Network Data Mining (NDM) method was used to extract features from packet and flow data captured in a network before performing clustering with a distance-based K-means algorithm. In [18], it was processed both classification and outlier detection simultaneously, making it suitable for scalable real-time detection, but additional work must be done to determine the optimum number of clusters.
Due to the limitations of K-means, several studies proposed to combine K-means with other methods for better detection outcomes. In [17], the Density Based Improved K-means Clustering (Dbkmeans) algorithm was proposed to combine K-means and Density Based Spatial Clustering of Applications with Noise (DBSCAN) algorithm to get the advantage of both algorithms. Although [17] could better handle clusters of circularly distributed data points and slightly overlapped clusters, the study used synthetically created data, and further work is required to conduct empirical analysis using real-world data. The outcome of this hybrid methodology showed a higher precision in outlier detection. In [23], it was proposed to improve K-means by applying density-based detection methods and adding the discovery and processing steps of the noise data to the original algorithm. The extra pre-processing step in [23] to exclude the interference of outliers is more time-consuming when applied to larger datasets, limiting the scalability and applicability of this algorithm. In [9], a hybrid algorithm named the Gravitational Search Algorithm and K-means (GSA-KM) was designed to combine GSA and K-means for better clustering, but it required minimum number of function evaluations to reach the optimal solution. In [22], the Triangle Area-based Nearest Neighbours (TANN) method was proposed to use K-means to acquire centroids of each cluster, before using triangle area from each cluster centroid to get new datasets and applying K-NN classification method to classify attacks. Although the implementation achieved higher accuracy and detection rates and the lower false negative rates, the study did not discuss whether K-means was the optimal clustering technique for TANN, and further work is required to examine the performance of TANN with the datasets containing different numbers of classes.
While the previous work made practical applications of outlier detection, they have not proven their scalability on larger datasets or resistance to noisy data. In this paper, we will demonstrate that the combination of both statistical outlier detection MSD and the machine learning of the K-means algorithm to detect anomaly could achieve more efficient outlier detection while minimizing the interference of noisy data.
3 Introducing New MSD-Kmeans
The newMSD-Kmeans (Algorithm 1) is proposed here in this paper that combines the features of MSD (Algorithm 1, step 1) and K-means (Algorithm 1, step2). Our proposal utilities MSD to eliminate as many global outliers (extreme values) as possible to minimize their interference on efficient clustering by K-means. Since the number of normal data points is generally greater than the number of outliers, if the extreme value can be eliminated before clustering via K-means, the efficiency and accuracy and local optima can be improved.
In the first phase of MSD-Kmeans, the statistical algorithm of MSD is used to eliminate extreme value that is defined as first stage outliers. In the second phase, utilizing the remaining normal data from the MSD method to partition into clusters by using the K-means algorithm is conducted. Two phases of outlier detection can be processed as follows:
-
1.
Calculating the mean value :
(1) where ia a dataset ; is the number of dataset of fare values from source to destination.
-
2.
Calculating the standard deviation value
(2) -
3.
Figure out both normal fare value dataset and global outlier dataset . The formula shows as follows
(3) (4) -
4.
K-means clustering based on normal dataset .
In our implementation of MSD-Kmeans, we used 1 standard deviation and the mean value to fence in the normal values and to fence out the global outliers (formula 4). After the global outliers had been eliminated by MSD algorithm, the remaining normal data and local outliers (formula 3) were grouped into two clusters by applying K-means clustering algorithm.
The K-means algorithm (Algorithm 1, step2) is demonstrated here to detect local outlier values (e.g. a value that may be within the normal range of the entire dataset but unusually low or high against surrounding values [27]), by assigning data into clusters with the closest mean values; those deviating from the mean value by more than 1.5 times the standard deviation are considered local outliers [20]. Here, we applied K-means as second stage to detect local and the remaining global outliers among fare values. This method was implemented in Python using the module to group the dataset into clusters. If the dataset assumed that all data points in each clustering are closed to each other, outliers can be detected in each cluster based on the threshold of each cluster. The threshold in this research is calculated based on the intra-cluster distance of each cluster. Intra-cluster distance is the Euclidean Distance calculated from each data point (fare value) to the centroid fare value of the cluster.
According to [13] and our experiments, appeared to have produced the best clustering results comparing to using 3 or more clusters, when some clusters could end up containing too many extreme values and affect the calculation of mean and standard deviation values. According to step in Algorithm 1, the intra-cluster distance, from each data point to the centroid of the cluster it belongs to, is calculated. All intra-cluster distances are sorted into descending orders in each cluster. Finally, the threshold of local outlier values has been calculated, which is the sum of the mean value and times the standard deviation of intra-cluster distances in each cluster.
4 Experiment Results
We evaluates our proposed MSD-Kmeans with the NYC Yellow Taxi Data dataset, and demonstrates it was effective in identifying out-of-ordinary taxi fares which can warrant further administrative investigations.
4.1 Identifying Sources and Destinations
The correct identification of pick-up (source) and drop-off (destination) locations is essential in calculating the routes traveled by taxis in order to estimate the expected fare values. Many source and destination locations have been collected by GPS devices from taxi drivers and made available in the NYC Taxi dataset. Defining outliers in those multiple sources and destinations was a challenging task, as the same source could be paired with different destinations and vice versa. In order to detect outliers from source to destination, all fare charges collected from a pair of two blocks of the area as the source (Lower Manhattan suburb of SOHO) and destination (John F. Kennedy International (JFK) Airport) places, and obtained 79,954 records. The 79,954 records included both global and local outliers, random and continuous, and were processed using our MSD-Kmeans.
4.2 Data Analysis
In this experiment, we are interested in random local outliers that are more likely to be due to taxi fare fraud. The outlying fare data in this dataset could either be global outliers, possibly due to error in data collection, or local outliers that could be caused by prolonged trips. As many global outliers as possible were to be identified and removed using MSD as part of the data cleansing before proceeding to the second stage of K-means. The continuous outliers could be due to traffic congestion or traffic control, whereas random outliers could actually indicate an individual decision by a taxi driver to detour unnecessarily to hike fares. When using K-means to perform clustering on the fare values, random outliers are more likely to stand out than continuous outliers.
4.3 Results and Evaluation
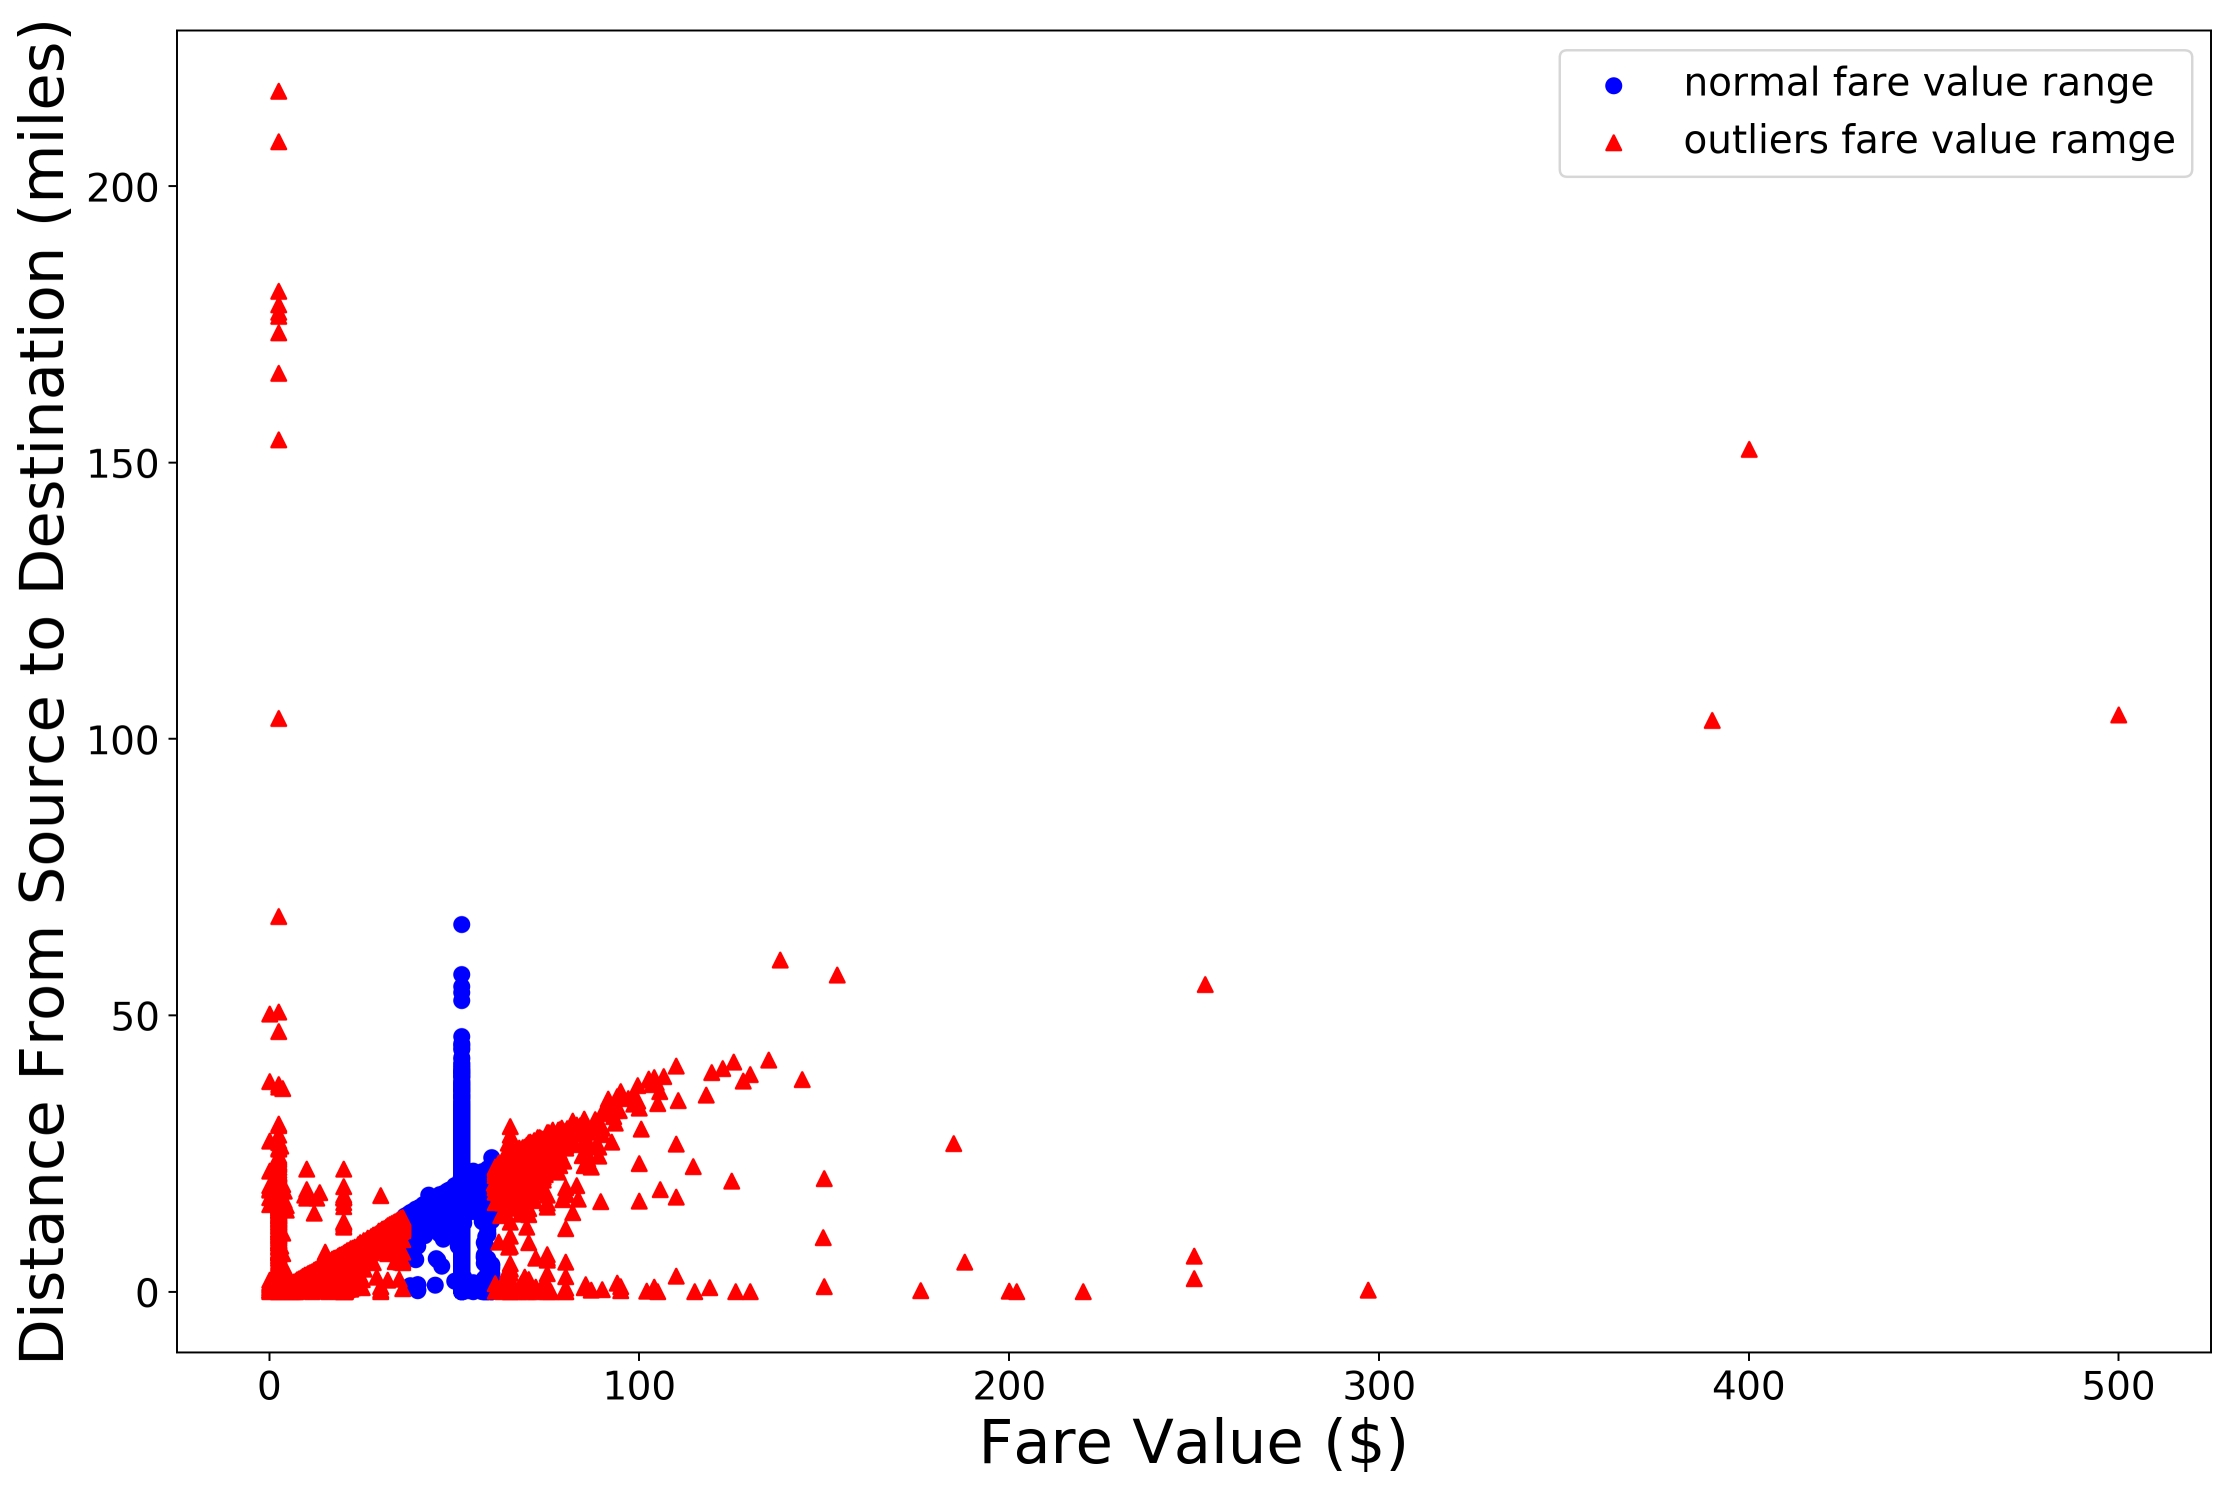
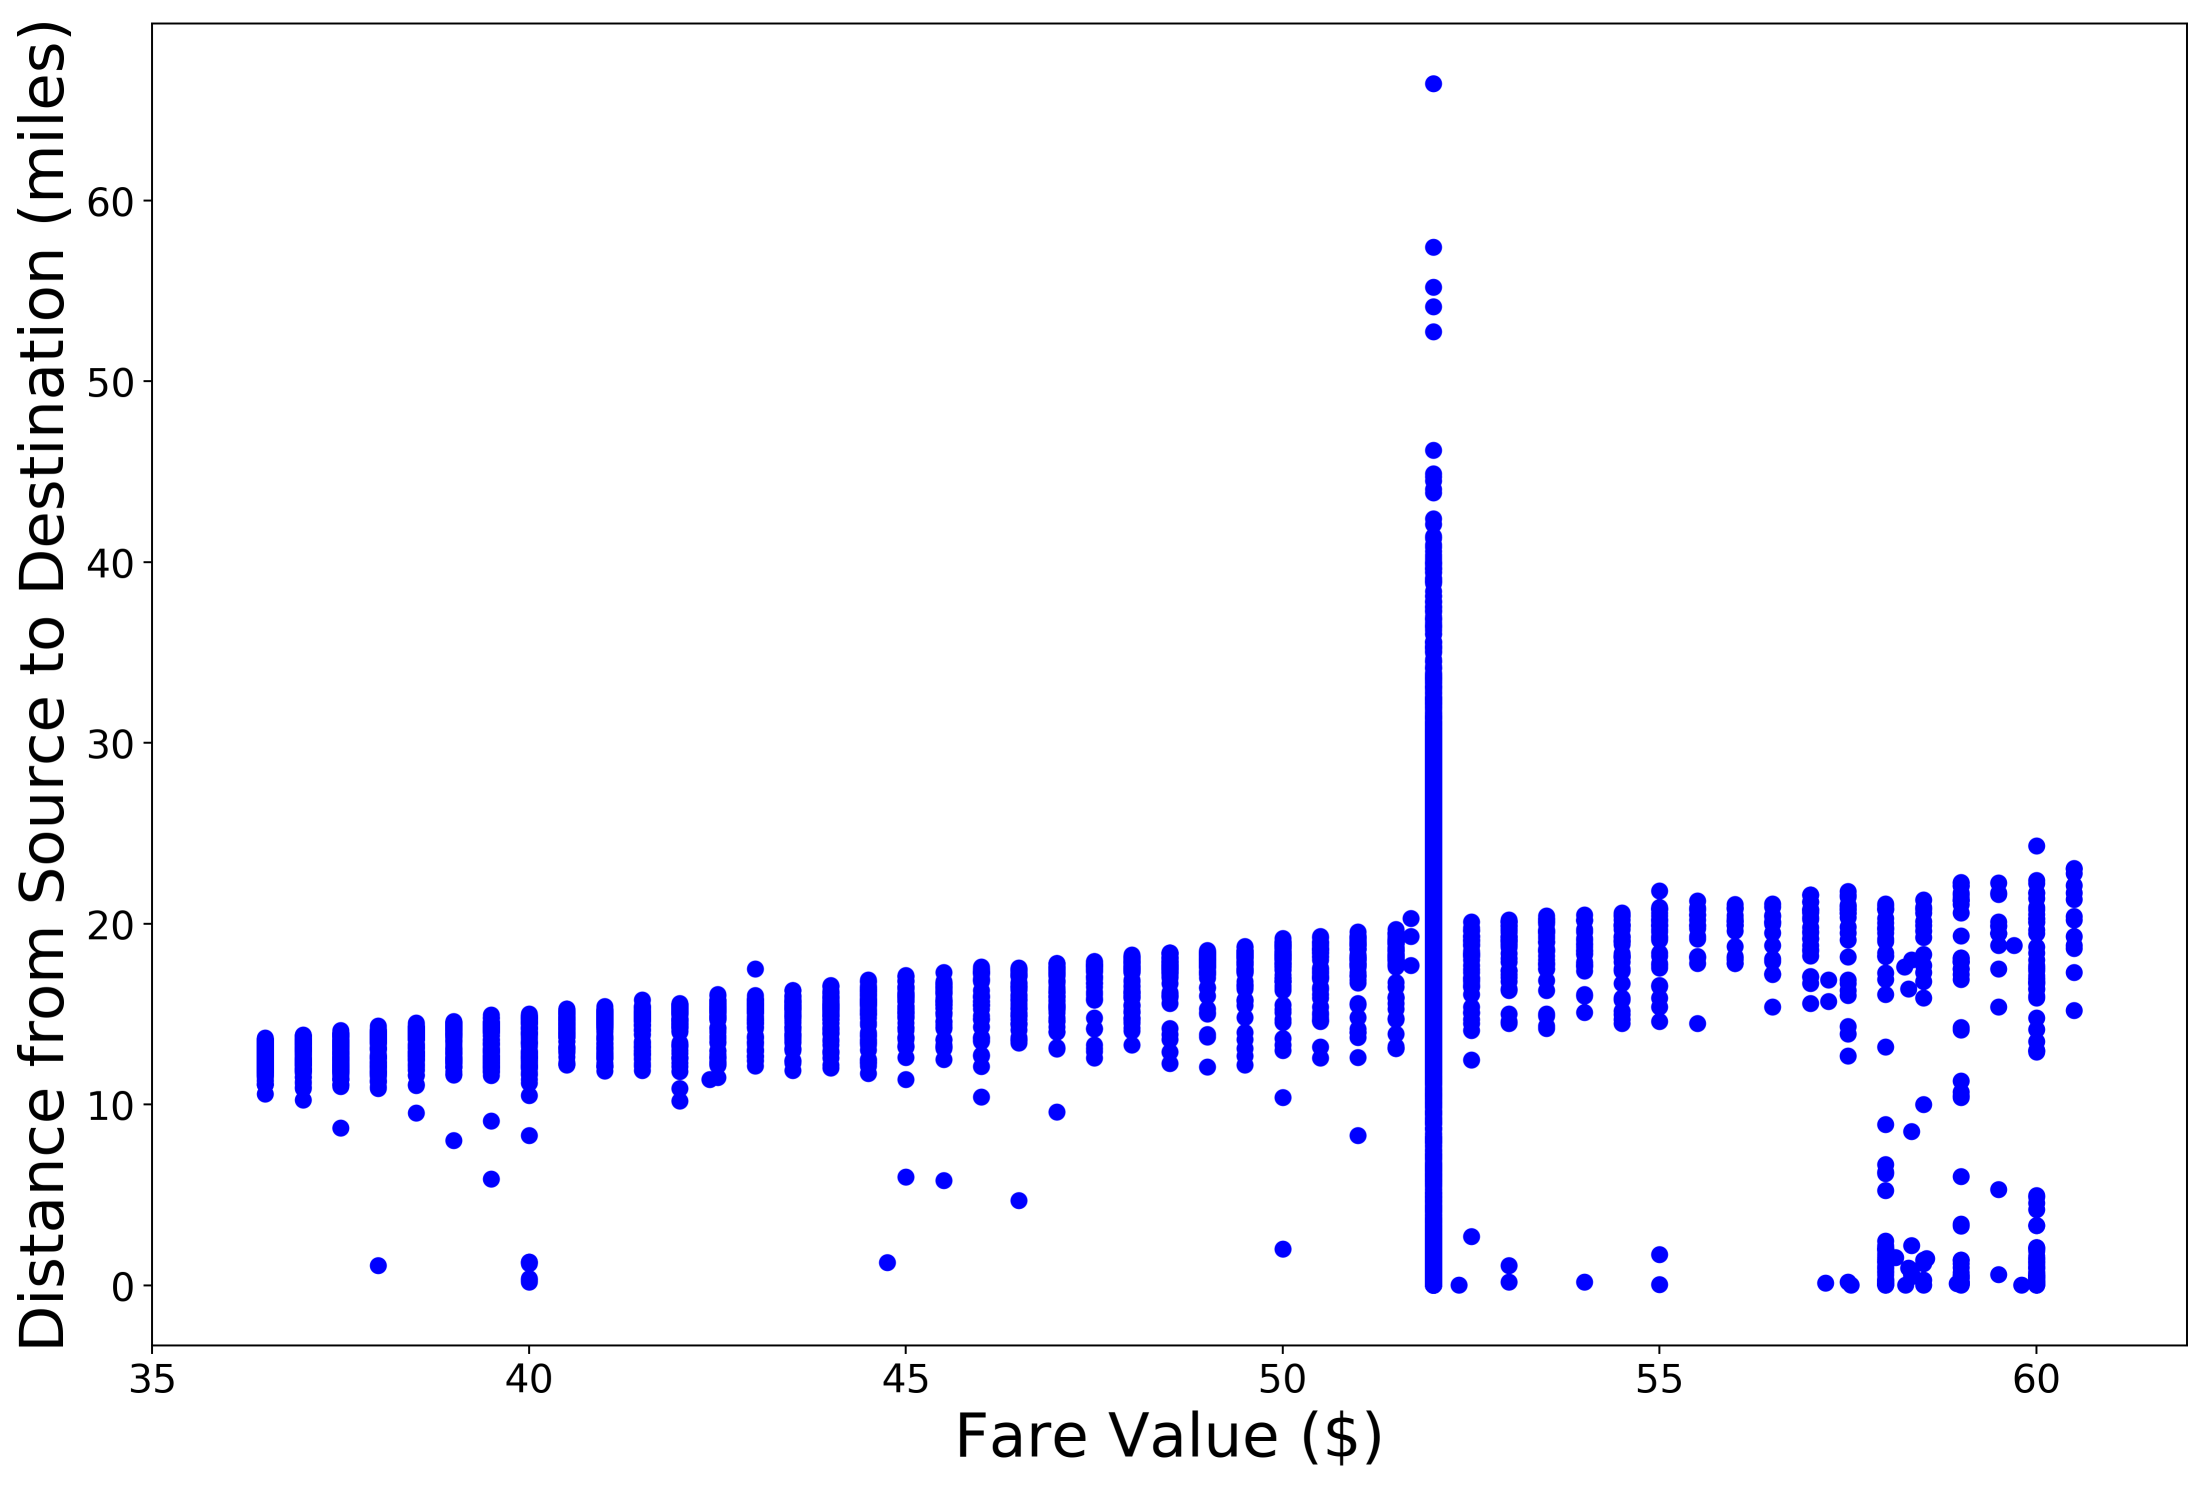
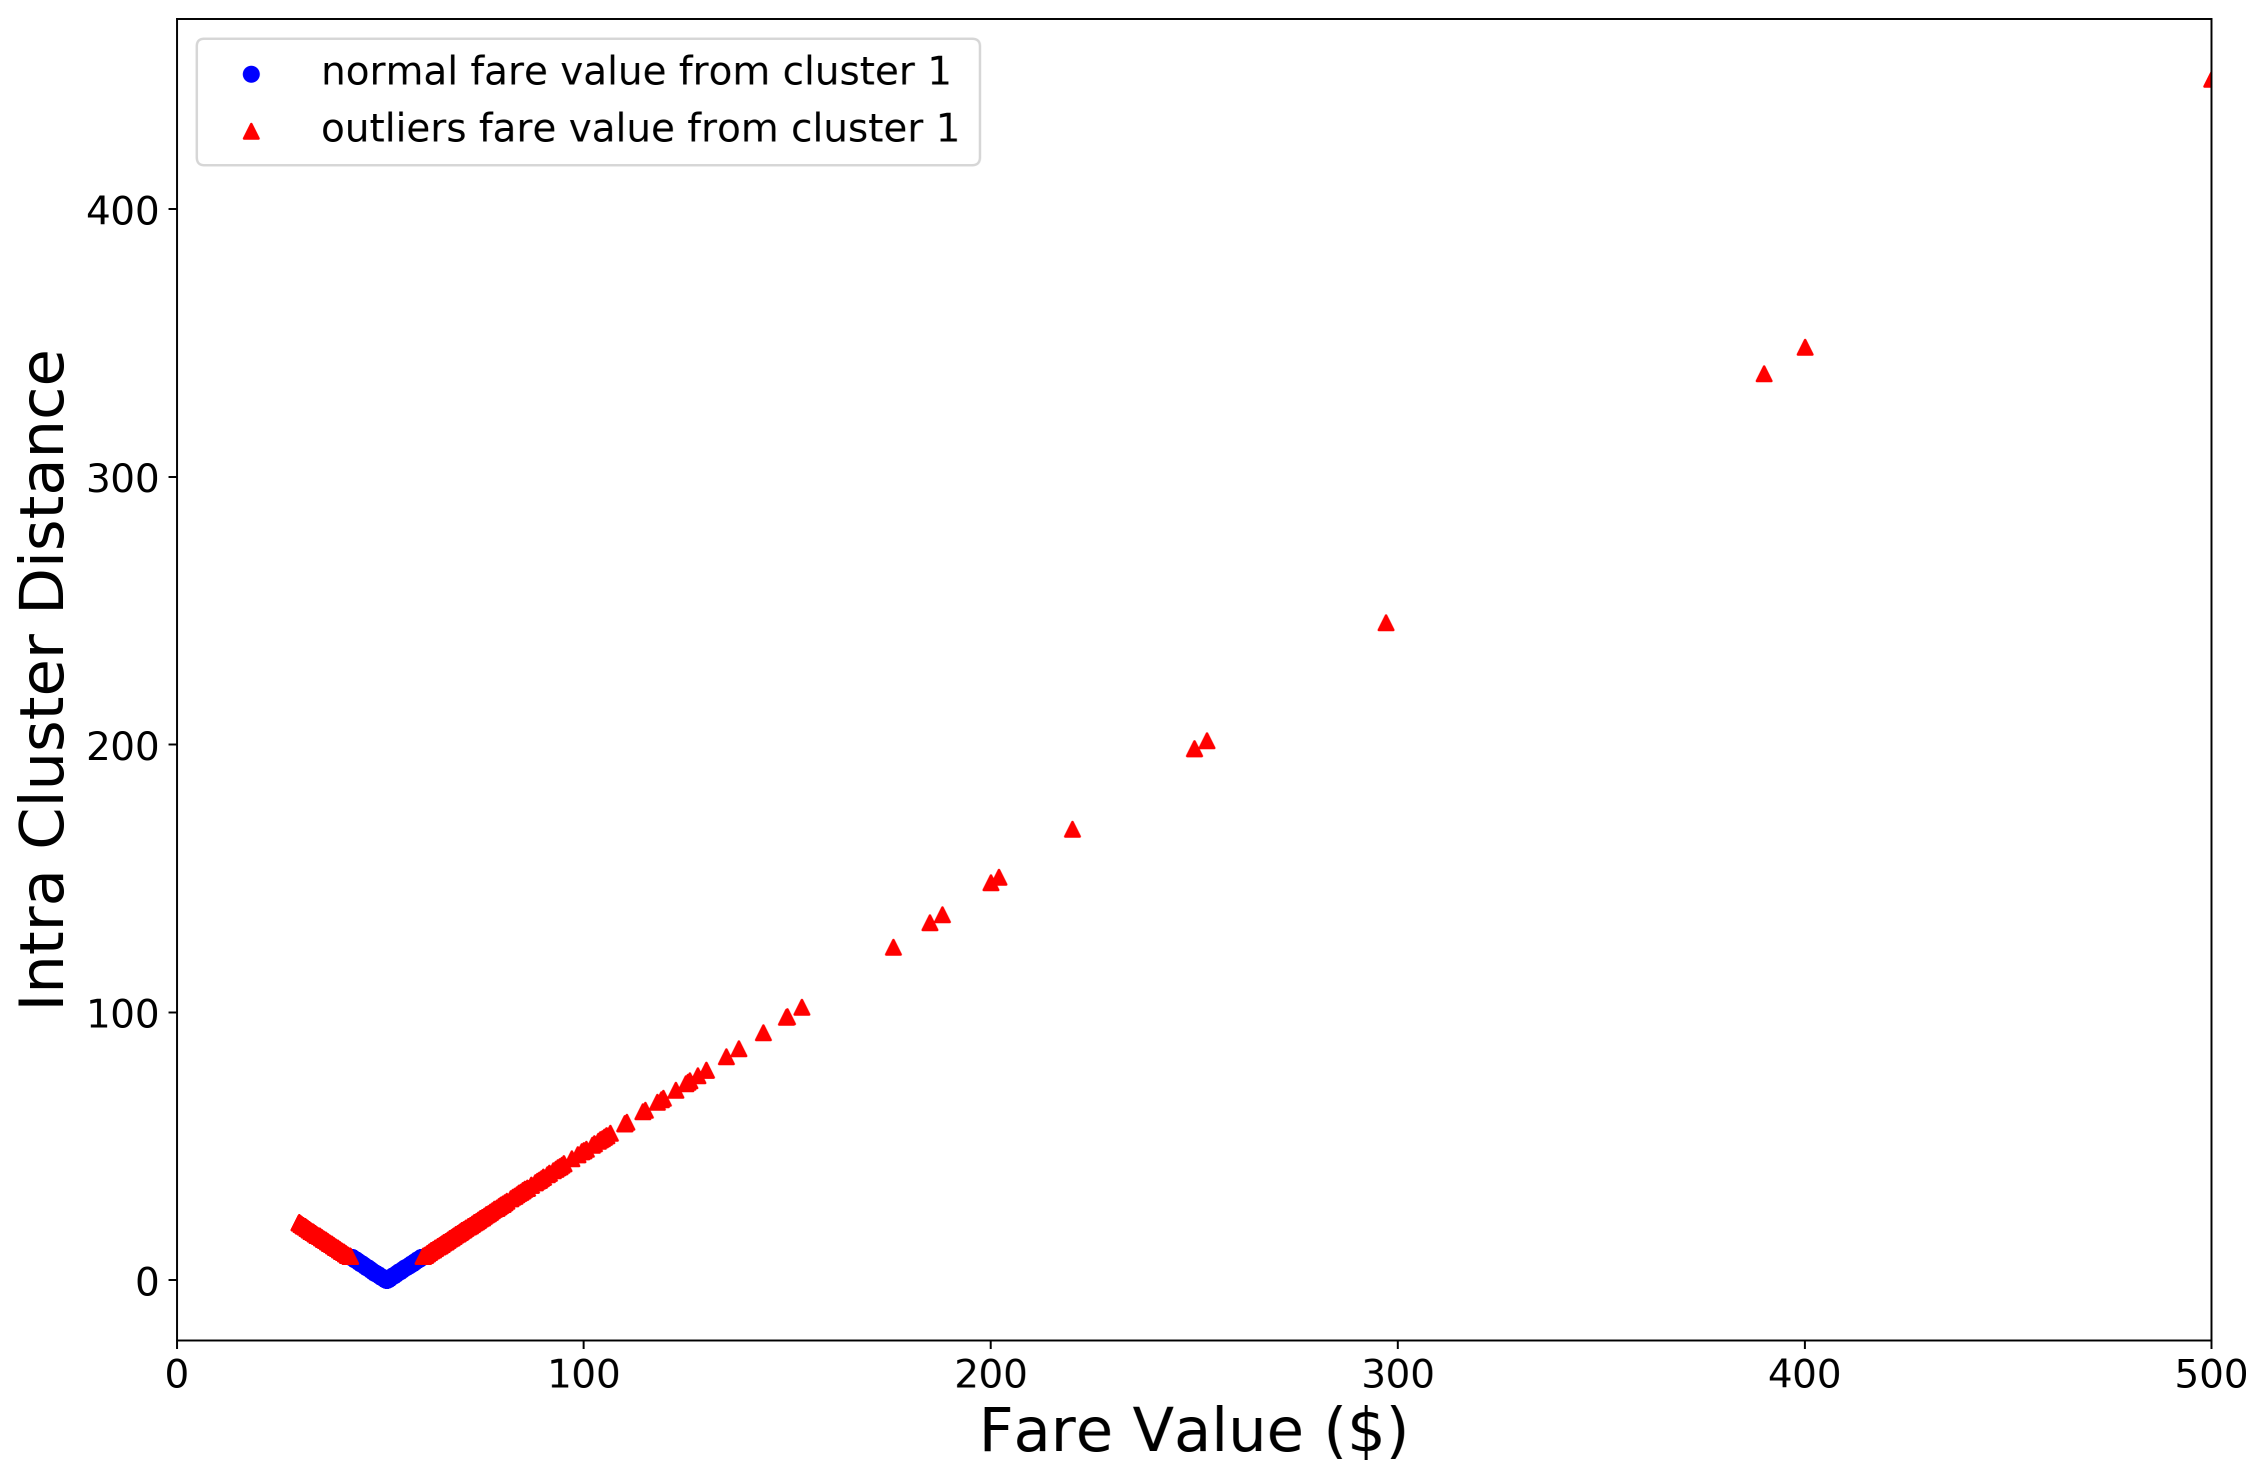
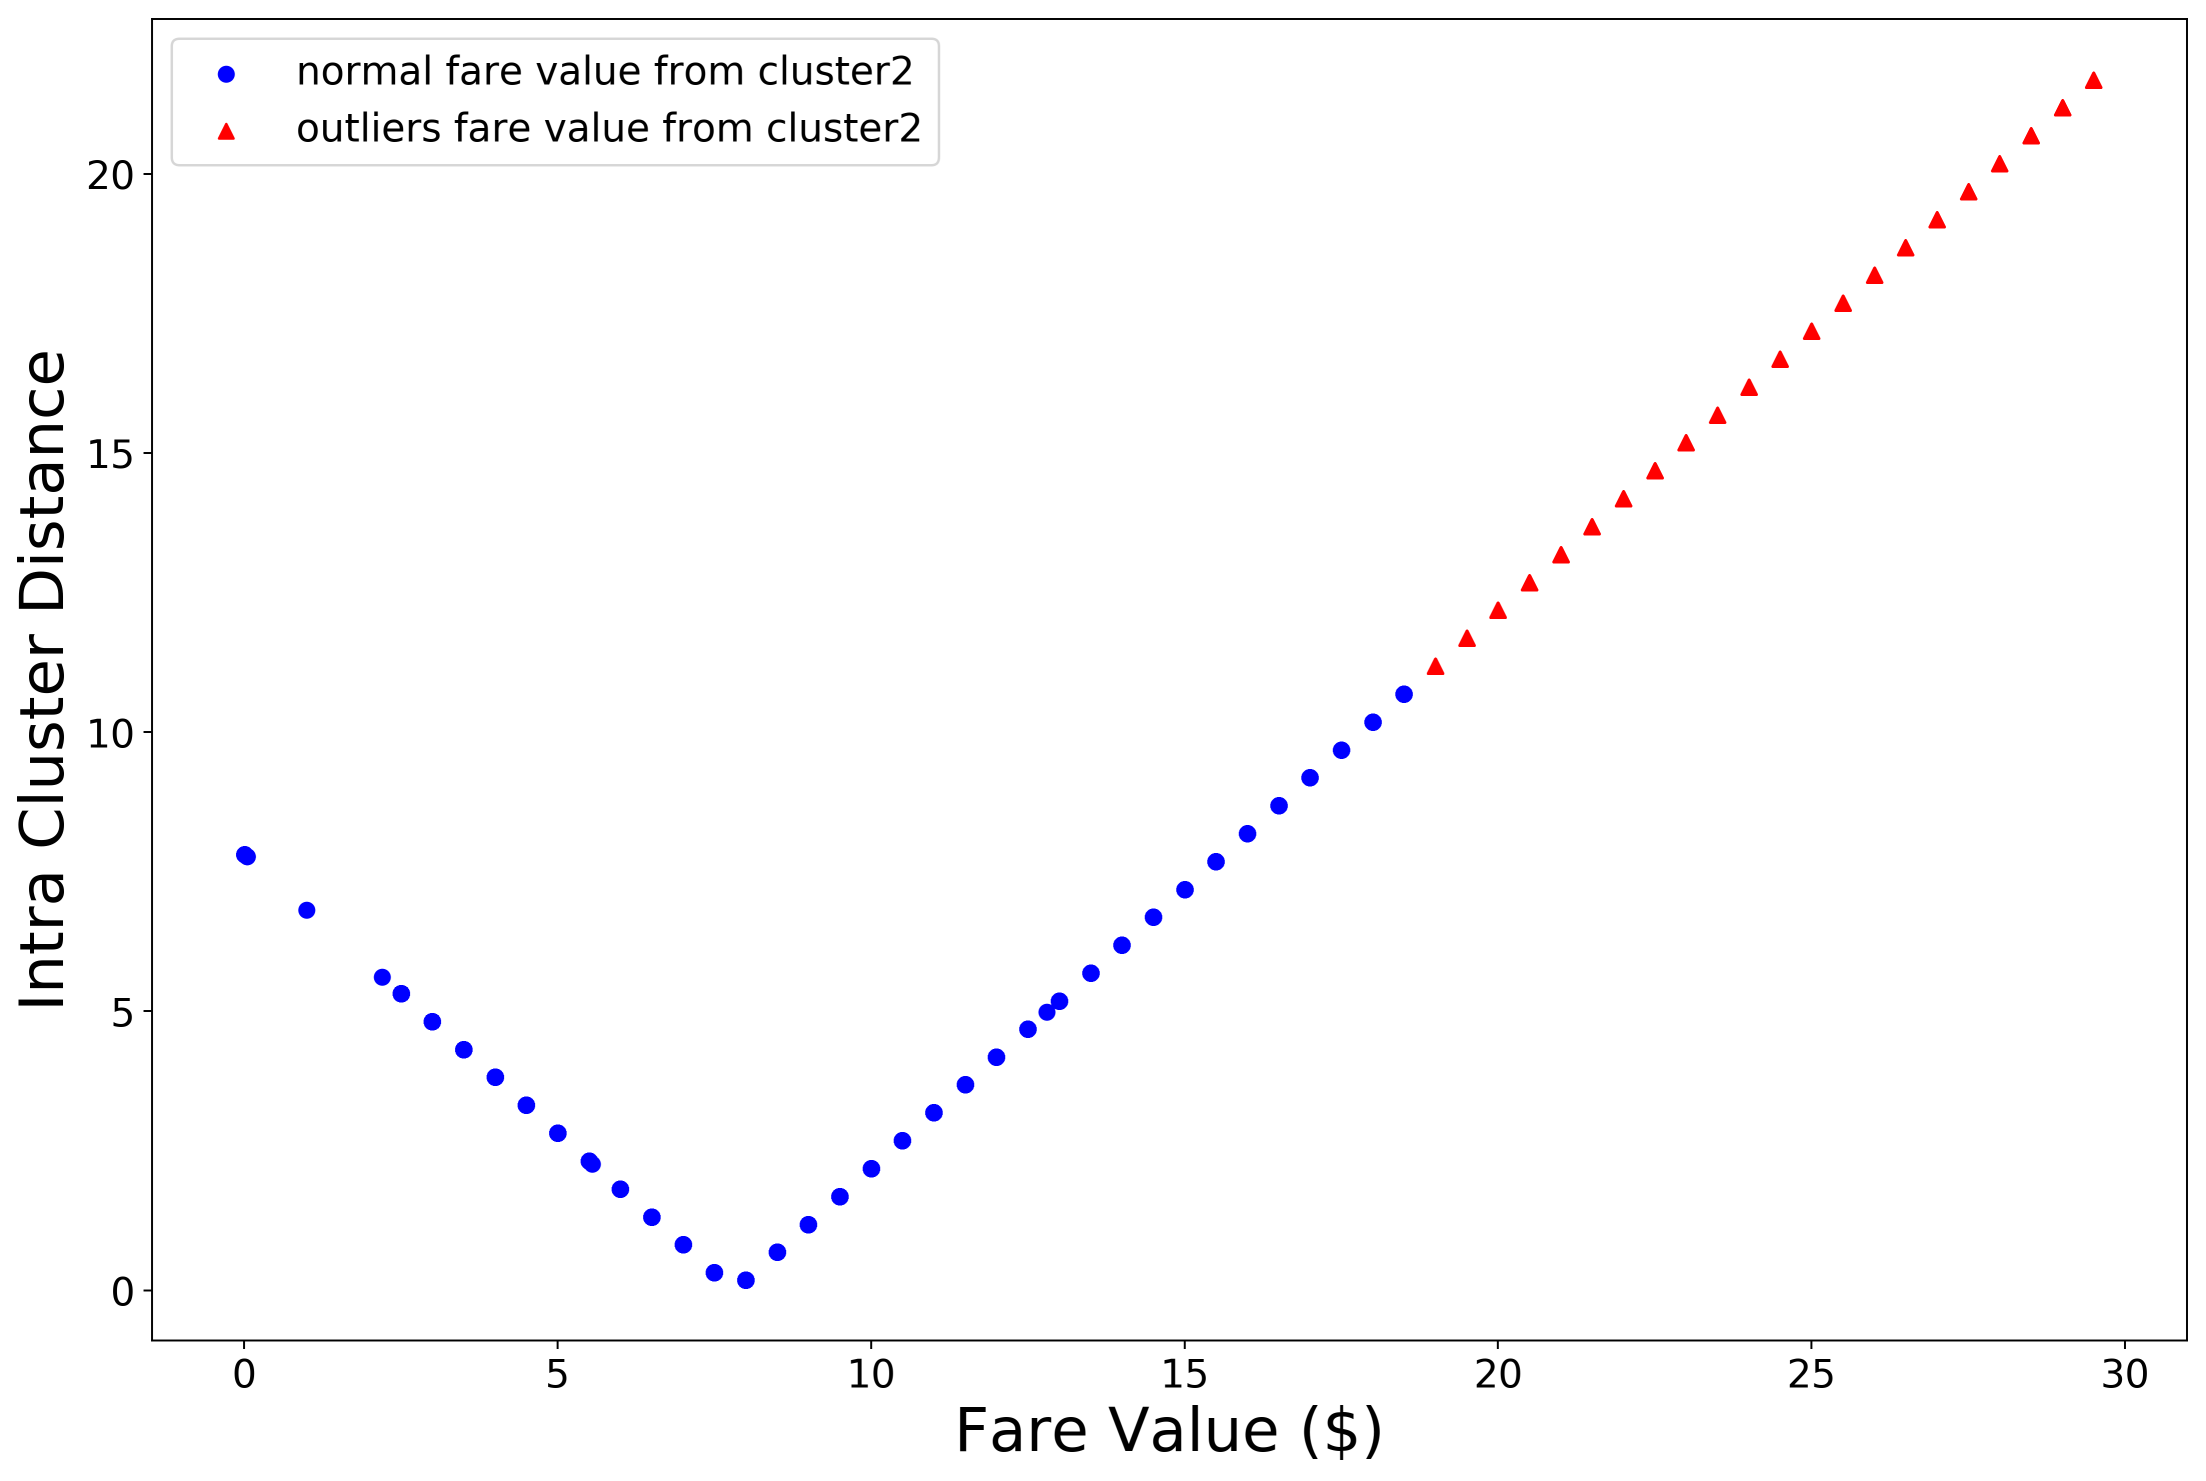
It was found that the majority of the trips from SOHO to JFK was between 10 to 20 miles, and most trips cost between USD $36 to $60 (Fig. 2). As can be seen in Fig. 2, the blue dots illustrated the normal fare value data distribution, while the red triangles illustrated the global outlier distribution found by using the MSD statistical method as the first stage of MSD-Kmeans. The remaining fare value data (Fig. 2) were later processed with K-means as the second stage of MSD-Kmeans. In the second stage, K-means clustered all data into 2 clusters. (Fig. 4) collected the normal data (blue dots), some local outliers and the remaining global outliers (red triangles); the centroid fare value was calculated as $51 and the threshold of intra-cluster distances was calculated as 8.87. (Fig. 4) collected the rest of the normal fare value (blue dots) with the other local outliers (red triangles); the centroid value was calculated as $7.7 and the threshold of intra-cluster distances was calculated as 10.83. The result of the 2 clusters was then aggregated together, and there were 5.11% outliers in total fare amount.
When the results of stage 1 MSD and stage 2 K-means were combined together, we obtained a set of data only containing normal fare values and local fare outliers (Fig. 5), which was the result of applying our MSD-Kmeans. The new outlier threshold of intra-cluster distances was 4.58 in and 0.92 in , while the centroid fare value was $52 in and $40 in . The blue dots indicated normal fare values both in and , whereas the red stars indicated outliers in and the black triangles in .
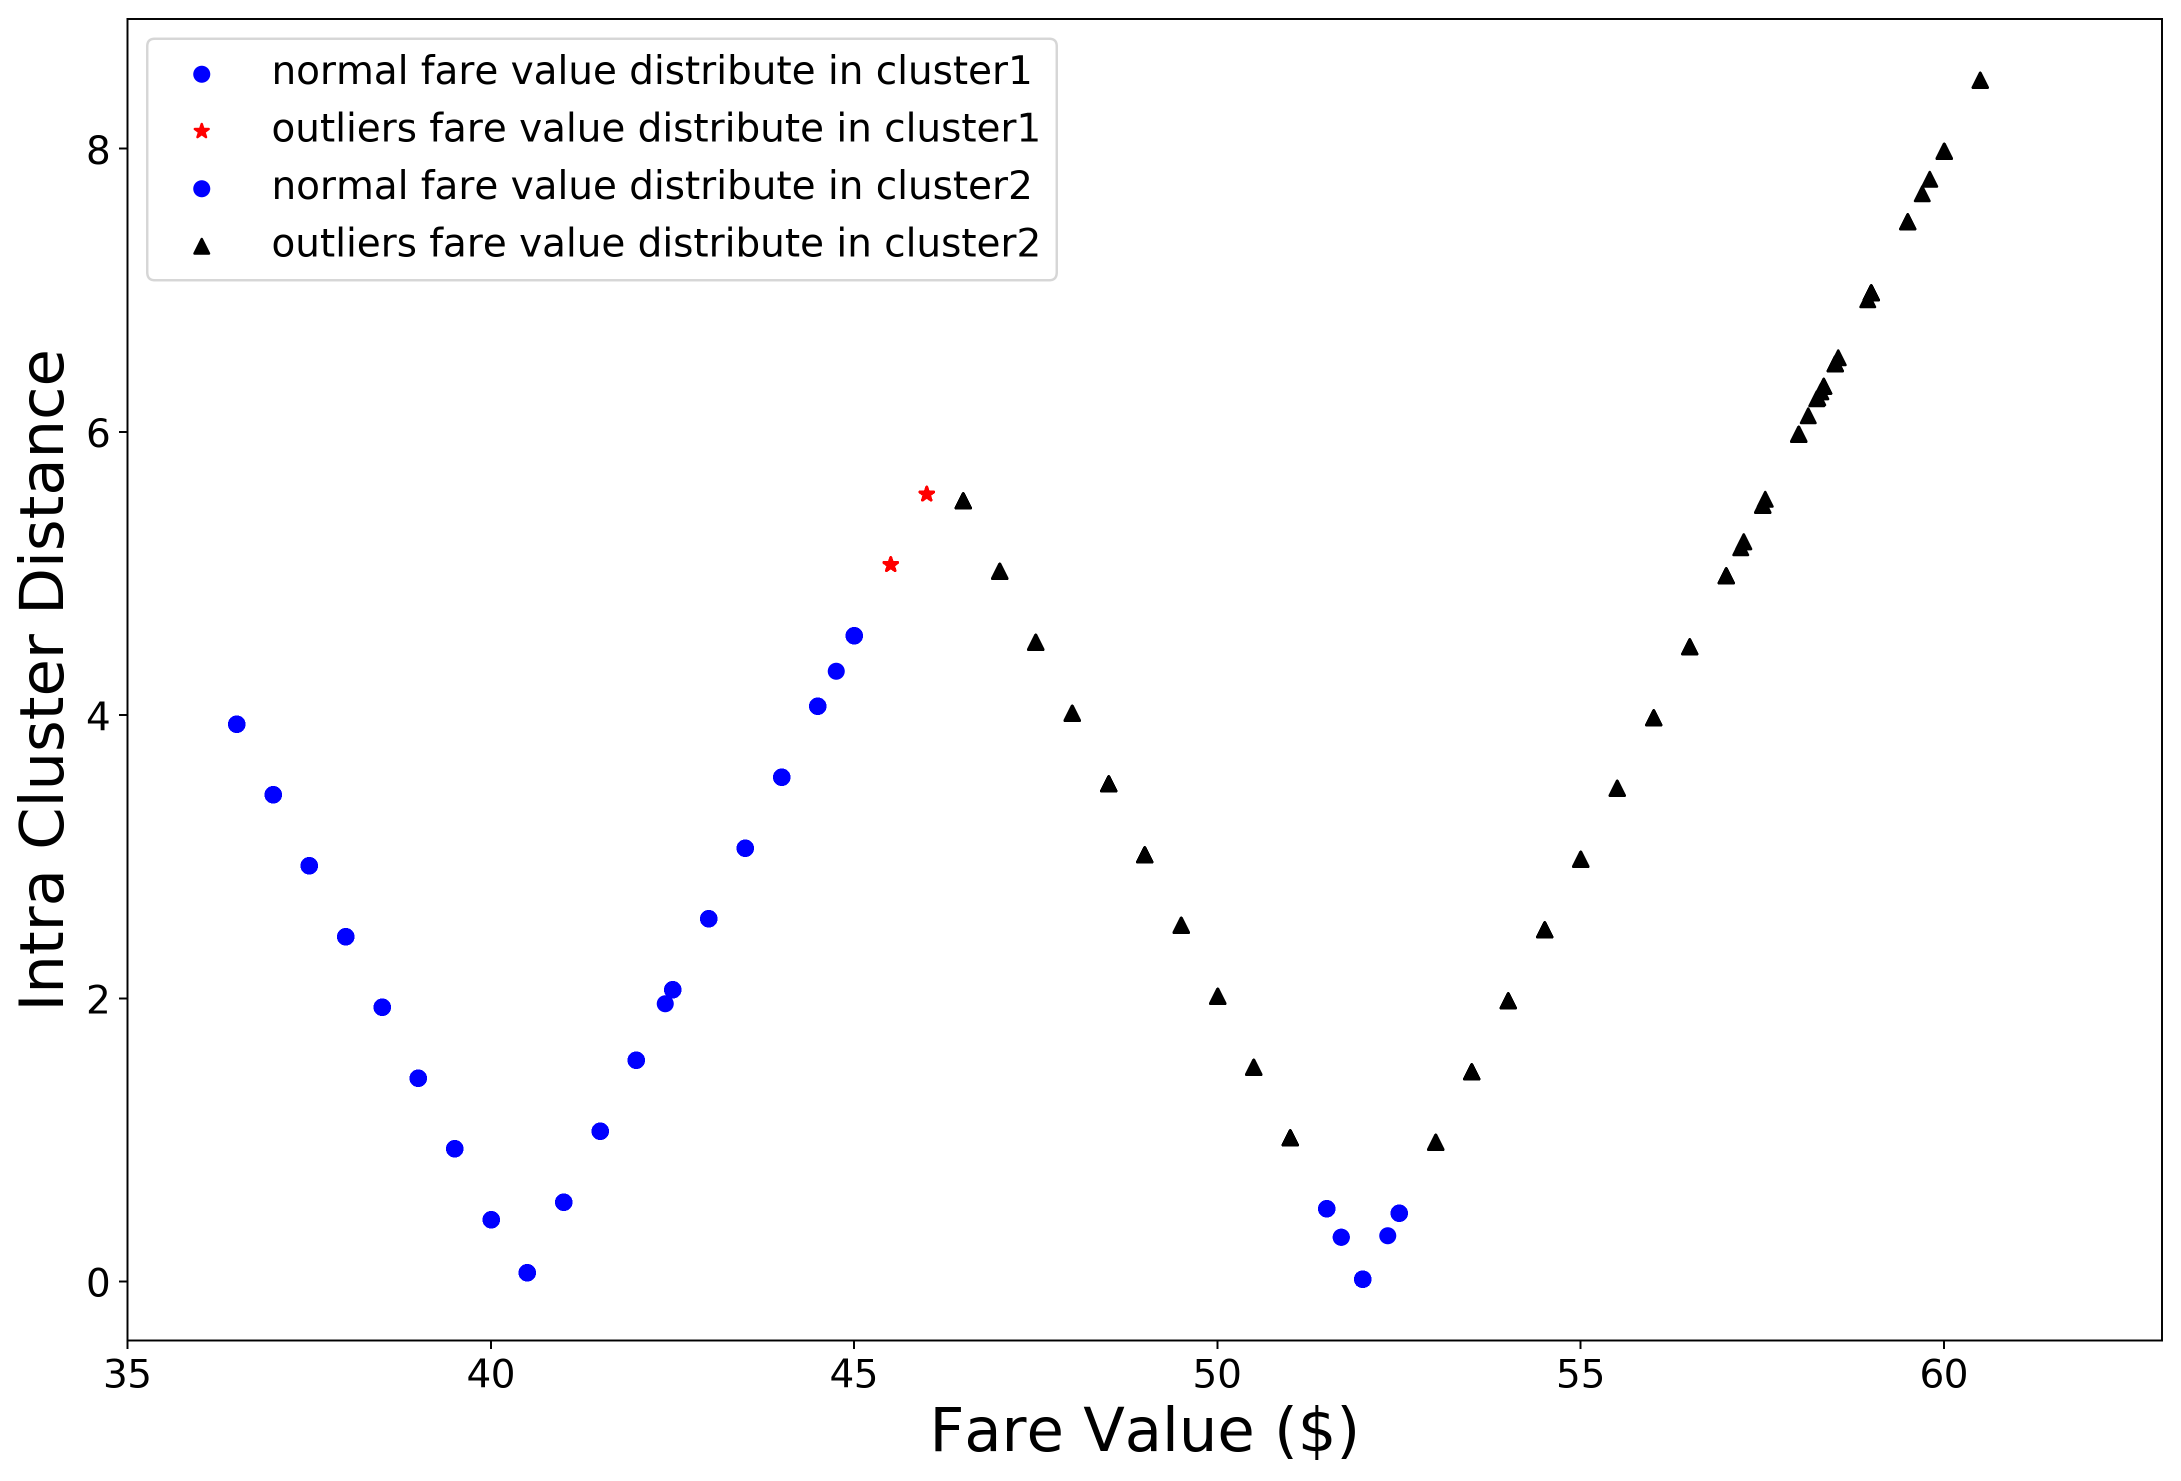
Compared with K-means algorithm alone in Fig. 4 and Fig. 4, MSD-Kmeans obtained shorter intra-cluster distances due to the fare values closer to each other, shown in Fig. 5. In other words, the further away a data point is from the centroid, it is more likely to be considered as an local outlier. K-means clustering method identified the lowest percentage of outliers (Table 1), because it was sensitive to the influences of global outliers but not efficient in identifying or eliminating them. In addition, choosing the optimal number of clusters is a challenging issue; often has to be determined in experiments when the value is chosen to achieve the highest clustering efficiency and the best clustering results [1]. The MSD stage of our MSD-Kmeans algorithm is also sensitive to extreme values because the mean and standard deviation values can be shifted by the presence of those values [10].
The proposed method of MSD-Kmeans is better for reducing extreme values and performing high-efficiency clustering. Using MSD-Kmeans, there were 11.14% outliers identified compared to MSD (9.75% identified) or K-means (5.11% identified). Despite that LOF identified the highest number of outliers (19.72% identified), the precision (26.1%) and accuracy (38.0%) were lower than those of other algorithms (Table 2).
| Algorithm |
|
|
|
Outliers (%) | ||||||||
| MSD | 79,954 | 71,416 | 7,799 | 9.75 | ||||||||
| Z-score | 79,954 | 75,460 | 4,494 | 5.62 | ||||||||
| MIQR | 79,954 | 69,418 | 10,473 | 13.10 | ||||||||
| K-means | 79,954 | 75,864 | 4,090 | 5.11 | ||||||||
| LOF | 261 | 218 | 43 | 19.72 | ||||||||
| MSD-Kmeans | 79,954 | 71,044 | 8,910 | 11.14 |
|
|
|
|
|
|
|
|
|||||||||||||||||
|---|---|---|---|---|---|---|---|---|---|---|---|---|---|---|---|---|---|---|---|---|---|---|---|---|
| MSD | 99.9 | 24.2 | 96.6 | 96.9 | 99.9 | 98.2 | 21 | |||||||||||||||||
| Z-score | 100 | 48.9 | 94.3 | 94.6 | 100 | 97.1 | 157 | |||||||||||||||||
| MIQR | 97.8 | 12.6 | 98.1 | 96.4 | 97.8 | 98.0 | 54 | |||||||||||||||||
| K-means[5] | 99.7 | 55.6 | 93.5 | 93.7 | 99.7 | 96.6 | 1,132 | |||||||||||||||||
| LOF[3] | 98.2 | 79.3 | 26.1 | 38.0 | 98.2 | 41.3 | 31,483 | |||||||||||||||||
| MSD-Kmeans | 98.5 | 11.6 | 98.6 | 97.4 | 98.5 | 98.6 | 824 |
5 Discussion
In our evaluation, we demonstrated that our novel MSD-Kmeans is a promising clustering algorithm that was efficient, accurate and resistant to the interference of extreme values.
5.1 Performance Comparison
The performance of outlier detection algorithms can be evaluated using six possible performance indicators: TPR, FPR, Precision, Accuracy, Recall and F-measure [7]. We have calculated our results and compared with those of other outlier detection algorithms applied on the same NYC taxi fare value data. The results are shown in Table 2. It was found that the MSD-Kmeans algorithm had the lowest FPR (11.6%; lower is better), the highest Precision (98.6%), Accuracy (97.4%) and F-measure (98.6%; higher is better), although its TPR was not as high as that of MSD, Z-Score or K-means, only higher than the TPR of MIQR. MSD-Kmeans was found to have higher Precision and Accuracy than those of MSD or K-means , as MSD or K-means alone is more sensitive to noisy data and could produce skewed results. Because the MSD algorithm looks for outlier based on standard deviation, a large number of extreme values can increase its standard deviation values, decreasing the accuracy of MSD. K-means algorithm itself suffers the similar issue of sensitivity to noisy data. As in Fig. 4, the fare amount is from to dollars. However, based on criteria fare amount from to dollars, the whole cluster 2 is defined as outlier. It demonstrated that too much noisy data has impact on clustering. The proposed MSD-Kmeans combination algorithm in general performed well. As can be seen in Table 2, as a result, the proposed method of MSD-Kmeans achieved the highest precision and accuracy, which means MSD-Kmeans obtained the results more correctly.
5.2 Improving MSD-Kmeans by Parallelizing of K-means
The efficiency of our proposed MSD-Kmeans can be further improved by parallelizing K-means, since MSD-Kmeans is performed in two stages (MSD and K-means respectively). Parallel computing is a technique to divide a larger problem into smaller problems, to carry out the execution of computation simultaneously on more than one computation unit, and to aggregate the final results back to one in the end [14]. Parallel programming has been introduced to data mining and processing, and many algorithms have adopted to be parallelized [4]. To our best knowledge, parallel implementations of MSD have not been found in current literature, which could be an ongoing challenge for future researchers. However, parallelizing K-means has been well-researched in [6, 12, 28, 29], achieving from twice the efficiency [28] on CPU to 68 times on GPU [6] when the number of clusters is 2. As can be seen in table 2, the parallel performance run-time in MSD-Kmeans algorithm cost less time consumption (), compared to other machine learning algorithms here, such as K-means () and LOF (). Many modern IoT devices are now equipped with multi-core CPUs and GPUs. It may be possible to boost the efficiency of MSD-Kmeans by parallelizing the second stage of K-means computation. This is outside the scope of this paper and would require further research and testing.
In summary, MSD-Kmeans can obtain better results in detecting outliers than MSD alone or K-means alone. However, in this research, MSD-Kmeans is used for detecting outliers based on univariate of fare value. The challenge to detect multivariate of other features can be attempted in further work.
6 Conclusion
In this paper, we proposed a novel outlier detection algorithm named MSD-Kmeans that combined MSD and K-means to detect global and local outlier values, and applied it to identify outlying amounts of taxi fares based on distance traveled in NYC taxi dataset, which could indicate taxi fare fraud. We also applied a few other algorithms including MSD and K-means algorithms individually to the same dataset to compare the results. The MSD algorithm as a statistical method can be used in not only outlier detection but also identifying extreme values, but is sensitive to the presence of extreme values. The K-means algorithm is a machine learning based algorithm but suffers similar issues. Our proposed hybrid method MSD-Kmeans applies the MSD algorithm to eliminate as many extreme values as possible, before applying K-means clustering algorithm to cluster normalized dataset in different groups. Our experimental result demonstrated that MSD-Kmeans achieved the best precision, accuracy, and F-measure, with the lowest false positive rate, compared to other outlier detection algorithms applied on the same dataset. We believe MSD-Kmeans is a promising algorithm in outlier detection that could benefit processing of sensor data[24] from networked IoT devices. Further work could be done to different datasets to test its practicability and scalability.
References
- [1] Abbas, O.A.: Comparisons between data clustering algorithms. International Arab Journal of Information Technology (IAJIT) 5(3) (2008)
- [2] Aggarwal, C.C.: Probabilistic and statistical models for outlier detection. In: Outlier Analysis, pp. 35–64. Springer (2017)
- [3] Breunig, M.M., Kriegel, H.P., Ng, R.T., Sander, J.: Lof: identifying density-based local outliers. In: ACM sigmod record. vol. 29, pp. 93–104. ACM (2000)
- [4] Chen, F., Deng, P., Wan, J., Zhang, D., Vasilakos, A.V., Rong, X.: Data mining for the internet of things: literature review and challenges. International Journal of Distributed Sensor Networks 11(8), 431047 (2015)
- [5] Duan, L., Xu, L., Liu, Y., Lee, J.: Cluster-based outlier detection. Annals of Operations Research 168(1), 151–168 (2009)
- [6] Farivar, R., Rebolledo, D., Chan, E., Campbell, R.H.: A parallel implementation of k-means clustering on gpus. In: Pdpta. vol. 13, pp. 212–312 (2008)
- [7] Fawcett, T.: An introduction to roc analysis. Pattern recognition letters 27(8), 861–874 (2006)
- [8] Ge, Y., Xiong, H., Liu, C., Zhou, Z.H.: A taxi driving fraud detection system. In: Data Mining (ICDM), 2011 IEEE 11th International Conference on. pp. 181–190. IEEE (2011)
- [9] Hatamlou, A., Abdullah, S., Nezamabadi-Pour, H.: A combined approach for clustering based on k-means and gravitational search algorithms. Swarm and Evolutionary Computation 6, 47–52 (2012)
- [10] Hodge, V., Austin, J.: A survey of outlier detection methodologies. Artificial intelligence review 22(2), 85–126 (2004)
- [11] Jain, A.K.: Data clustering: 50 years beyond k-means. Pattern recognition letters 31(8), 651–666 (2010)
- [12] Kantabutra, S., Couch, A.L.: Parallel k-means clustering algorithm on nows. NECTEC Technical journal 1(6), 243–247 (2000)
- [13] Karypis, M.S.G., Kumar, V., Steinbach, M.: A comparison of document clustering techniques. In: TextMining Workshop at KDD2000 (May 2000) (2000)
- [14] Kumar, V.: Introduction to Parallel Computing: Design and Analysing of Algorithms. Springer (1994)
- [15] Lee, J.G., Han, J., Li, X.: Trajectory outlier detection: A partition-and-detect framework. In: 2008 IEEE 24th International Conference on Data Engineering. pp. 140–149. IEEE (2008)
- [16] Liu, S., Ni, L.M., Krishnan, R.: Fraud detection from taxis’ driving behaviors. IEEE Transactions on Vehicular Technology 63(1), 464–472 (2014)
- [17] Mumtaz, K., Duraiswamy, K.: A novel density based improved k-means clustering algorithm–dbkmeans. International Journal on computer science and Engineering 2(2), 213–218 (2010)
- [18] Münz, G., Li, S., Carle, G.: Traffic anomaly detection using k-means clustering. In: GI/ITG Workshop MMBnet. pp. 13–14 (2007)
- [19] Pan, B., Zheng, Y., Wilkie, D., Shahabi, C.: Crowd sensing of traffic anomalies based on human mobility and social media. In: Proceedings of the 21st ACM SIGSPATIAL International Conference on Advances in Geographic Information Systems. pp. 344–353. ACM (2013)
- [20] Prasad, Y.S., Krishna, G.R.: Statistical anomaly detection technique for real time datasets. International Journal of Computer Trends and Technology (IJCTT) 6(2), 89–94 (2013)
- [21] Sun, L., Zhang, D., Chen, C., Castro, P.S., Li, S., Wang, Z.: Real time anomalous trajectory detection and analysis. Mobile Networks and Applications 18(3), 341–356 (2013)
- [22] Tsai, C.F., Lin, C.Y.: A triangle area based nearest neighbors approach to intrusion detection. Pattern recognition 43(1), 222–229 (2010)
- [23] Wang, J., Su, X.: An improved k-means clustering algorithm. In: Communication Software and Networks (ICCSN), 2011 IEEE 3rd International Conference on. pp. 44–46. IEEE (2011)
- [24] Weyers, R., Jang-Jaccard, J., Moses, A., Wang, Y., Boulic, M., Chitty, C., Phipps, R., Cunningham, C.: Low-cost indoor air quality (iaq) platform for healthier classrooms in new zealand: Engineering issues. In: 2017 4th Asia-Pacific World Congress on Computer Science and Engineering (APWC on CSE). pp. 208–215. IEEE (2017)
- [25] Yu, T., Wang, X., Shami, A.: Recursive principal component analysis-based data outlier detection and sensor data aggregation in iot systems. IEEE Internet of Things Journal 4(6), 2207–2216 (2017)
- [26] Zhang, D., Li, N., Zhou, Z.H., Chen, C., Sun, L., Li, S.: ibat: detecting anomalous taxi trajectories from gps traces. In: Proceedings of the 13th international conference on Ubiquitous computing. pp. 99–108. ACM (2011)
- [27] Zhang, Y., Meratnia, N., Havinga, P.J.: Outlier detection techniques for wireless sensor networks: A survey. IEEE Communications Surveys and Tutorials 12(2), 159–170 (2010)
- [28] Zhang, Y., Xiong, Z., Mao, J., Ou, L.: The study of parallel k-means algorithm. In: 2006 6th World Congress on Intelligent Control and Automation. vol. 2, pp. 5868–5871. IEEE (2006)
- [29] Zhao, W., Ma, H., He, Q.: Parallel k-means clustering based on mapreduce. In: IEEE International Conference on Cloud Computing. pp. 674–679. Springer (2009)