Building Information Modeling and Classification by Visual Learning At A City Scale
Abstract
In this paper, we provide two case studies to demonstrate how artificial intelligence can empower civil engineering. In the first case, a machine learning-assisted framework, BRAILS, is proposed for city-scale building information modeling. Building information modeling (BIM) is an efficient way of describing buildings, which is essential to architecture, engineering, and construction. Our proposed framework employs deep learning technique to extract visual information of buildings from satellite/street view images. Further, a novel machine learning (ML)-based statistical tool, SURF, is proposed to discover the spatial patterns in building metadata.
The second case focuses on the task of soft-story building classification. Soft-story buildings are a type of buildings prone to collapse during a moderate or severe earthquake. Hence, identifying and retrofitting such buildings is vital in the current earthquake preparedness efforts. For this task, we propose an automated deep learning-based procedure for identifying soft-story buildings from street view images at a regional scale. We also create a large-scale building image database and a semi-automated image labeling approach that effectively annotates new database entries. Through extensive computational experiments, we demonstrate the effectiveness of the proposed method.
1 Introduction
Natural disasters often bring huge losses to human society. One of the main consequences is the destruction of buildings, usually accompanied by casualties and loss of property. As the major component of a human-built environment, buildings are an important consideration in disaster prevention, response, and reconstruction, on which researchers have made significant efforts.
In recent years, the computer vision (CV) community has embraced notable improvement. Deep learning (DL), as a part of machine learning (ML), is arguably one of the most popular research topics nowadays. A typical deep convolutional neural network (CNN) is a stack of convolutional layers and fully connected layers. Except for the last layer, each layer serves as a feature extractor. Compared with traditional methods for CV tasks, which require researchers to select the ‘optimal’ feature representation, a CNN model can instead learn to extract features by itself. A series of CNN-based models have been proposed and achieved impressive results in a variety of CV tasks, like face verification Sun, et al (2014) and object detection Girshick (2015); Ren, et al (2015).
In this work, we explore the potential of ML/DL in civil engineering, especially in disaster prevention with regard to buildings. Two case studies are introduced: In the first case, a ML-assisted framework, BRAILS Wang, et al (2019), is proposed for city-scale building information modeling. Building information model (BIM) is an efficient way of describing buildings. Beyond the conventional modeling methods which rely on metadata such as height and number of stories, we employ a CNN to extract visual features of individual buildings from satellite/street view images to create a more informative BIM database. In addition, a ML-based statistical tool termed SURF is brought up to discover the spatial patterns in building metadata, which can further enhance the BIM database. The second case focuses on the application of DL in analyzing seismic damage vulnerability of buildings, particularly soft-story buildings. Such buildings are prone to collapse even in a moderate earthquake due to their structure. We propose a DL-based procedure for identifying soft-story buildings from street view images at a regional scale. Based on our newly collected database, we demonstrate the effectiveness of the proposed method. Next, we will explain each case in details.
2 Case Studies
2.1 Create a City-Scale BIM Database
Framework
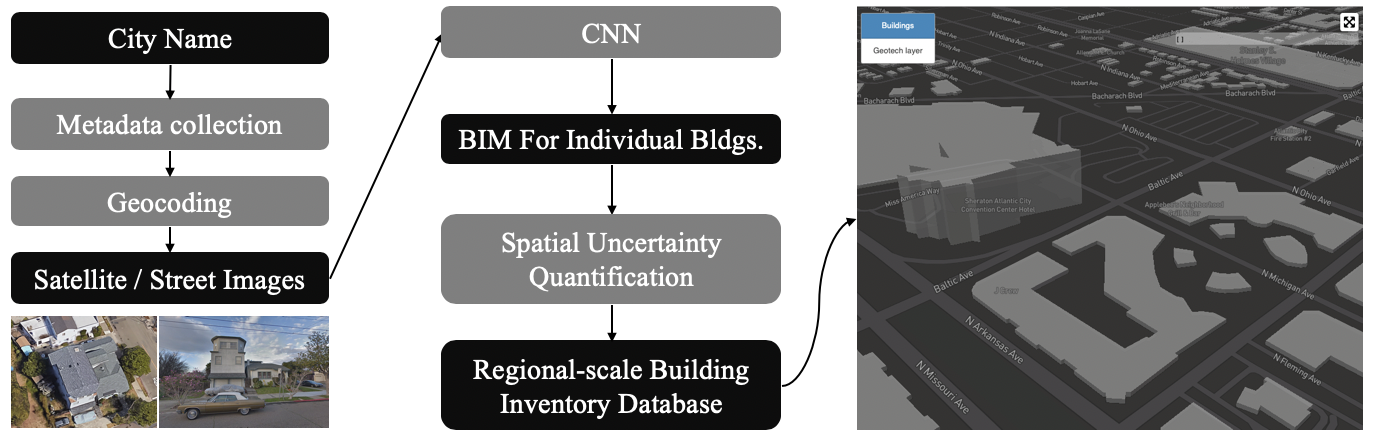
The workflow of the current version of BRAILS Wang, et al (2019) for creating a city-scale BIM database is shown in Fig. 1.
-
•
Step 1: Given a city of interest, scrape building metadata from property tax website, which contains building information such as building address and number of stories.
-
•
Step 2: Associate each scraped building with a geocode (i.e., latitude and longitude) in order to get the precise location of individual buildings.
-
•
Step 3: Following the geocodes, fetch images of each building and use CNN to extract visual information from these images. Building information obtained in the first and third step form the skeleton of the BIM database.
-
•
Step 4: a ML-based spatial uncertainty quantification tool, SURF, is proposed to enhance the database. It can predict missing values based on the spatial patterns found in the skeleton. At the end of the pipeline, a regional BIM database is created.
Collect Metadata Property tax records are public resources available on various government websites. Useful information for describing a building can be extracted from these records, such as number of stories, exterior structural material, and year of construction. Based on the extracted information, we can create a preliminary BIM database for each building. This BIM database is called the metadata-BIM database. Note that a considerable portion of the building information is unavailable in the public records. In the final step, a ML-based approach is introduced to compensate for these missing values.
Geocoding The process of geocoding is to associate individual building (properties) with its geographic coordinates (latitude and longitude). This step is necessary: First, the coordinates are the ‘index’ when retrieving satellite or street view images for individual buildings; Second, in order to enhance the incomplete database (to be explained later), the geographic coordinates will be used for spatial distribution analysis. Google Geocoding API is employed to retrieve the geographic coordinates.
Extract visual features from building images using CNN In addition to the building information obtained from property tax records, a CNN model is utilized to predict building attributes based on their visual features present in satellite or street view images. We train CNNs based on building-related attributes which are collected from OpenStreetMap (OSM)111OSM is a platform hosting real-world infrastructure information labeled by humans.. The pipeline of extracting a specific building property from images is listed below:
-
•
Identify an attribute (e.g., exterior construction material) that is intended to be extracted.
-
•
Retrieve satellite/street view images via Google Map API.
-
•
Label the retrieved images using tags obtained from OpenStreetMap.
-
•
Train a CNN on labeled images.
-
•
Use the trained CNN to predict the attribute for unlabeled images.
Through repeating the above steps for each building attribute, we create a vision-BIM database. It can be merged with the metadata-BIM to form a more informative BIM database. In later versions of BRAILS, all building features will be obtained using the vision-based method, because scarping metadata from websites is a time consuming task and can not be automated.
Enhance database by exploring spatial correlation Based on previous steps, a BIM database can be created. However, there is a considerable portion of building information missing in the metadata- and vision-based BIM database. Therefore, a ML-based approach termed SURF Wang (2019), which stands for Spatial Uncertainty Research Framework, is brought up to enhance the database by exploiting spatial patterns in building distribution.
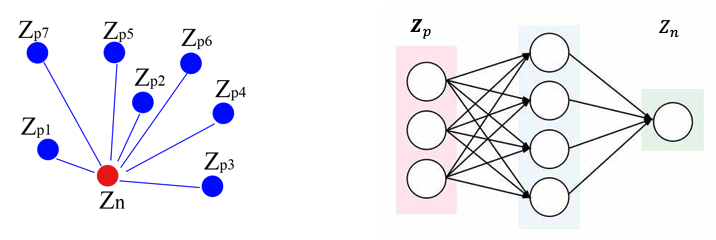
SURF is powered by two engines: random fields Vanmarcke (2010) and neural networks. As shown in Fig. 2 (Left), the red dot represents a building with its location known but its property unknown. The blue dots represent nearby buildings with their locations and properties known. We can use either random field theory or neural network to construct a mapping function, which is used to map neighbour information into . SURF learns this mapping function and predicts the missing values based on known values of neighbour buildings. Hence, the BIM database is enhanced. More theoretical information of SURF can be found in Wang (2019), where there are links to its GitHub, documents, etc.
Application example
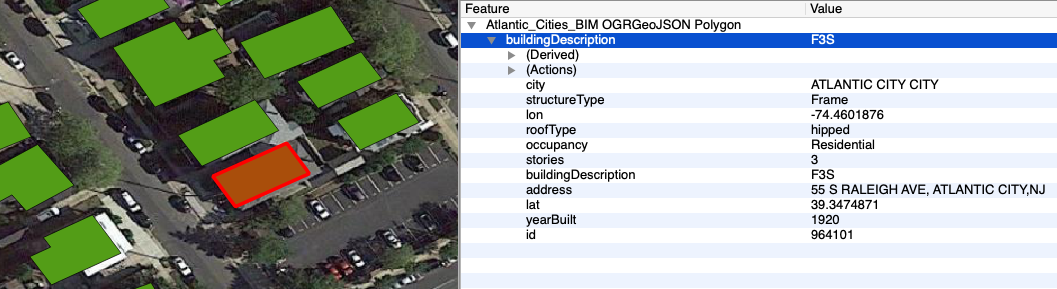
Following the framework introduced above, we can create a BIM database based on building information. Fig. 3 shows an example building with its information in the created BIM database. A BIM database can be used for estimating regional loss in natural hazards, such as earthquakes and hurricanes. An example application has been conducted by Elhaddad, et al (2018).
2.2 Train a Soft-story Building Classifier
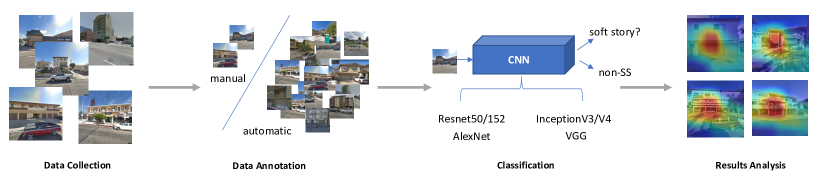
In the second case, we propose a deep learning-based framework for soft-story (SS) building classification. To be specific, we collect a large-scale building database using Google Street View Static API222Google Street View Static API: https://developers.google.com/maps/documentation/streetview/intro.. Based on the new database, a CNN model is developed to classify a SS building from a street view image. The database contains 25K images, corresponding to buildings of five cities: Santa Monica, Oakland, San Francisco, San Jose, and Berkeley. Training a classifier requires labels, while annotating such a large amount of images is labor-intensive and time-consuming. To handle this problem, we introduce a semi-automatic labeling strategy. Then we train four advanced deep neural networks on these images. Next we will detail the process of creating the new database and training a classifier, as shown in Fig. 4.
Create a Building Database
The process of collecting a database contains two steps, image collection and annotation.
Image Collection We first obtain building addresses of each city from their official websites. Based on these addresses, we use Google Street View Static API to download the corresponding street view images of individual buildings. Parameters of the API, such as field of view, pitch, and heading, are manually set and kept consistent across different cities. Images are grouped into four subsets according to their source cities, with the exception that we merged images of San Jose and Berkeley due to their limited data.
Image Annotation Manually annotating the whole database can be expensive and time-consuming. Inspired by the idea of active learning, we propose a semi-automatic labeling strategy. The basic idea is training a classifier on a small manually annotated subset first, then applying this classifier to categorize a larger subset. This process can be repeated based on requirements. Specifically, we first ask an expert to annotate a small subset of images. Only the images contain sufficient and clear visual cues are labeled as SS buildings. Based on annotated data, a balanced dataset is formed. Next, a CNN model is trained based on . Once the classifier is trained, it is then used to classify the rest of unlabeled data. In our case, we randomly sample 1,302 images from Santa Monica as . An ImageNet pre-trained ResNet50 is employed as .
The preliminary classifier can achieve 86.9% accuracy on . Next, we apply it to categorize the rest images of Santa Monica (15K) and Oakland (1.3K). We admit that the annotated data still contain noise while the quality can be further improved by conducting this labeling process repeatedly. The final version of the new database contains 25,340 building images.
Train a Building Classifier
Our goal is to develop a classifier which can recognize a SS building in a street view image. There are two classes in our database, SS and non-SS building; thus, we employ a cross-entropy loss to train our model, as shown in Eq. 1. and are the predicted probability of an input image and its ground truth label. We take advantage of the existing large-scale auxiliary database by using an ImageNet Deng, et al (2009) pre-trained model for initialization. The number of output digits is changed from 1000 to 2 to fit our task. During training, we first fine-tune the new fully connected layer while all previous layers are frozen, and then fine-tune all layers. It can help to speed up the convergence. We select four popular CNNs with various architectures or depths as the backbones and compare their performance in Table 1.
| (1) |
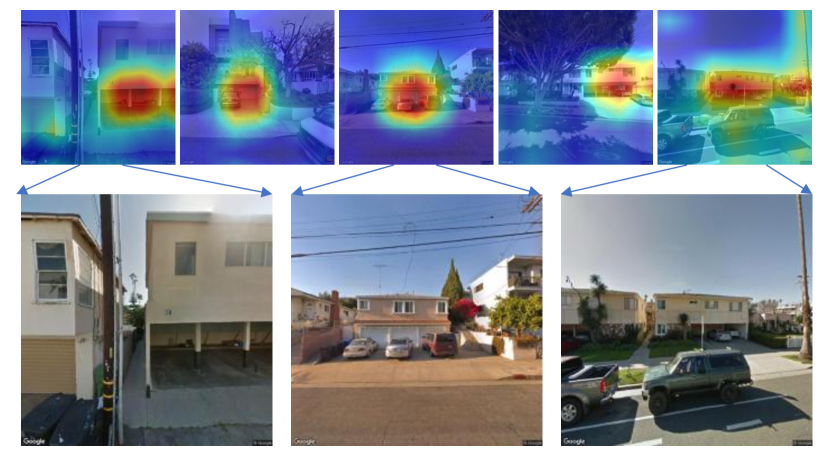
Visualizations We employ CAM Zhou, et al (2016) to visualize feature maps learned by our model. CAM is a visualization method; given a target class, CAM highlights the class-specific discriminative regions. We can use this method to see the regions used by the trained model to make a prediction. Figure 5 (Left) provides several examples. In the top row of Fig. 5 (Left), the highlighted parts indicate regions the model uses to predict a soft-story building. It is clear to see our model attends to building area when predicting whether it is a soft-story or not. This observation is in alignment with Zhou, et al (2016), and our trained model can be used as a building detector.
| Model | average acc. | P | R | F1 |
|---|---|---|---|---|
| ResNet50He, et al (2016) | 85.94% | 84.16% | 82.80% | 83.47% |
| ResNet152He, et al (2016) | 85.03% | 82.32% | 83.12% | 82.71% |
| InceptionV3Szegedy, et al (2016) | 84.38% | 81.39% | 83.77% | 82.56% |
| InceptionV4Szegedy, et al (2017) | 83.20% | 80.52% | 80.52% | 80.52% |
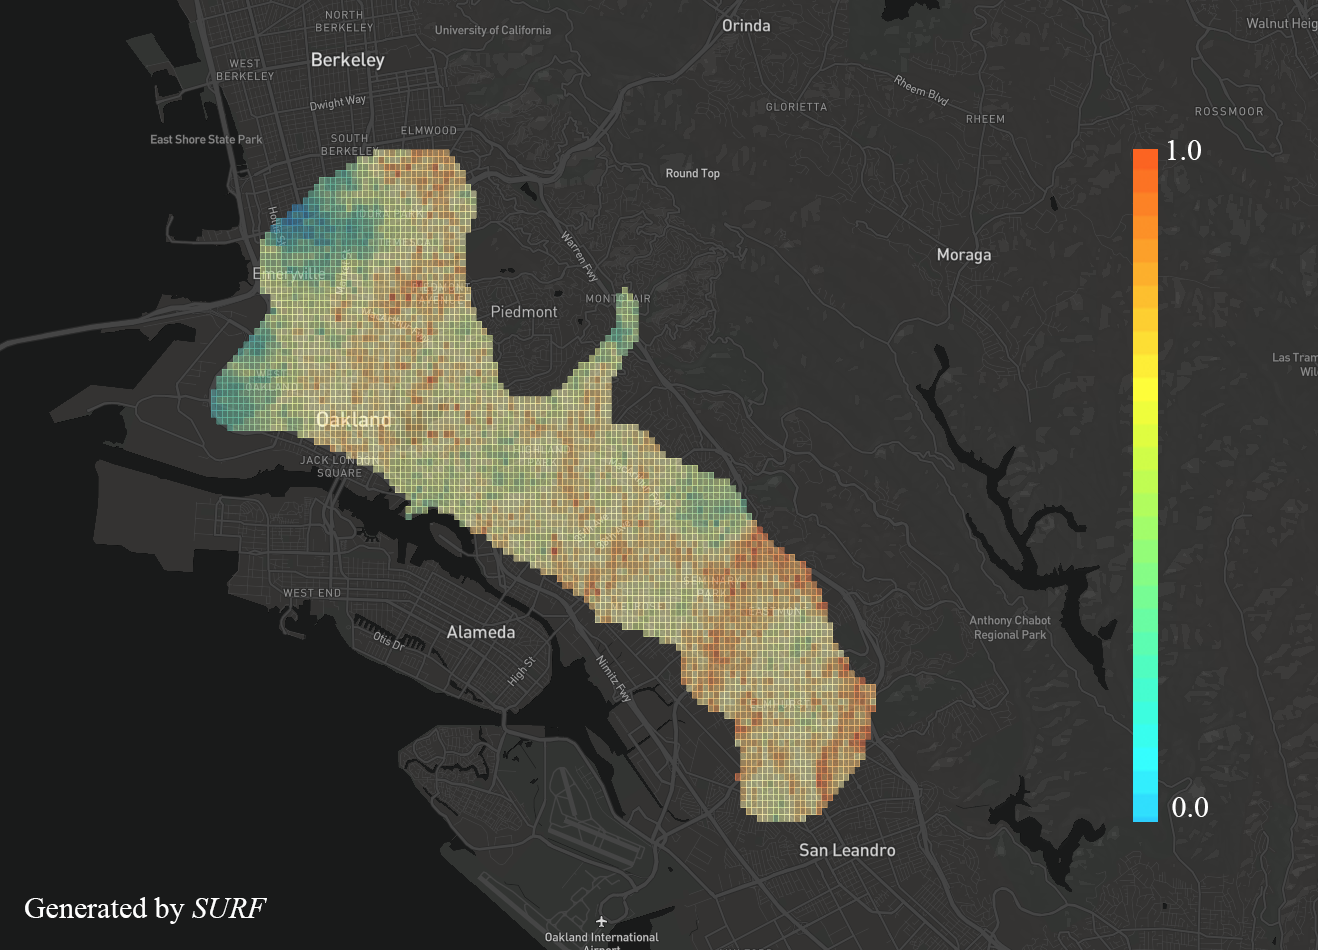
Application The goal of the proposed framework is to provide a prediction given an input street view image. When city-wide images are available, this framework can efficiently process large amounts of data, and the predictions can be used to generate a Soft-story distribution map.
Here we take the city Oakland as an example. In our collected database, there are 1,359 street view images taken in Oakland. Based on these images and their predictions, we generate a distribution map of SS buildings using SURF, which is introduced in the first case study. As shown in Fig. 5, a heat map is produced to show which parts of the region are likely to be occupied by SS buildings.
3 Conclusion
This work demonstrates how ML/DL can benefit civil engineering by introducing two case studies, one being a ML/DL-based approach of creating a BIM database, and the other being a DL-based procedure of creating a database and training a classifier. Apart from this work, other works such as Naik, et al (2014); Law, et al (2018); Kang, et al (2018); Gebru, et al (2017) have applied DL in various applications, like predicting housing price Bency, et al (2017); Law, et al (2018), evaluating the safety of the neighborhoodNaik, et al (2014); Liu, et al (2017), and estimating the demographic makeup of neighborhoods Gebru, et al (2017). The impressive results achieved by DL in these applications demonstrate its great potential in civil engineering.
Based on this work, for the first case study, we will explore how to use DL/ML techniques to predict geometric parameters based on a single image. For the second case, we will focus on several practical problems, such as data imbalance and data noise. Moreover, we will also investigate the task of multi-class building classification.
OSM is more complete in higher income countries, densely urbanized areas, and targeted areas of humanitarian mapping intervention, comapred to low and middle income contries and regions. Google maps (street and satellite images) have similar issue. Since the current version of the framework utilizes data from OSM and Google maps, the genealizability of this framework requires more validation work to be performed outside the data rich zones.
Both cases are parts of a larger effort, where the objective is to detect the features of buildings from images at a large scale. To this end, the BRAILS Wang, et al (2019) project is now a hub for them and the development is still on going.
References
- Sun, et al [2014] Yi Sun, Yuheng Chen, Xiaogang Wang, and Xiaoou Tang. Deep learning face representation by joint identification-verification. In Advances in Neural Information Processing Systems, 2014.
- Girshick [2015] Ross Girshick. Fast r-cnn. In Proceedings of the IEEE international conference on computer vision, 2015.
- Ren, et al [2015] Shaoqing Ren, Kaiming He, Ross Girshick, and Jian Sun. Faster r-cnn: Towards real-time object detection with region proposal networks. In Advances in Neural Information Processing Systems, 2015.
- Wang, et al [2019] Charles Wang, Qian Yu, Frank McKenna, Barbaros Cetiner, Stella Yu, Ertugrul Taciroglu, and Kincho H. Law. NHERI-SimCenter/BRAILS: v1.0.1. https://doi.org/10.5281/zenodo.3483208, October 2019.
- Wang [2019] Charles Wang. NHERI-SimCenter/SURF: v0.2.0. https://doi.org/10.5281/zenodo.3463676, September 2019.
- Vanmarcke [2010] Erik Vanmarcke. Random fields: analysis and synthesis. World Scientific, 2010.
- Elhaddad, et al [2018] Wael Elhaddad, Frank McKenna, John B. Lowe, and Mats Rynge. NHERI-SimCenter/WorkflowRegionalEarthquake: Regional Earthquake Loss Estimation Workflow. https://doi.org/10.5281/zenodo.1442914, October 2018.
- Deng, et al [2009] Jia Deng, Wei Dong, Richard Socher, Li-Jia Li, Kai Li, and Li Fei-Fei. ImageNet: A Large-Scale Hierarchical Image Database. In Proceedings of the IEEE Conference on Computer Vision and Pattern Recognition, 2009.
- Zhou, et al [2016] Bolei Zhou, Aditya Khosla, Agata Lapedriza, Aude Oliva, and Antonio Torralba. Learning deep features for discriminative localization. In Proceedings of the IEEE Conference on Computer Vision and Pattern Recognition, 2016.
- He, et al [2016] Kaiming He, Xiangyu Zhang, Shaoqing Ren, and Jian Sun. Deep residual learning for image recognition. In Proceedings of the IEEE Conference on Computer Vision and Pattern Recognition, 2016.
- Szegedy, et al [2016] C. Szegedy, V. Vanhoucke, S. Ioffe, J. Shlens, and Z. Wojna. Rethinking the inception architecture for computer vision. In Proceedings of the IEEE Conference on Computer Vision and Pattern Recognition, 2016.
- Szegedy, et al [2017] Christian Szegedy, Sergey Ioffe, Vincent Vanhoucke, and Alexander A Alemi. Inception-v4, inception-resnet and the impact of residual connections on learning. In Proceedings of the 31st AAAI Conference on Artificial Intelligence, 2017.
- Naik, et al [2014] Nikhil Naik, Jade Philipoom, Ramesh Raskar, and César Hidalgo. Streetscore-predicting the perceived safety of one million streetscapes. In Proceedings of the IEEE Conference on Computer Vision and Pattern Recognition Workshops, 2014.
- Law, et al [2018] Stephen Law, Brooks Paige, and Chris Russell. Take a look around: using street view and satellite images to estimate house prices. arXiv preprint arXiv:1807.07155, 2018.
- Kang, et al [2018] Jian Kang, Marco Körner, Yuanyuan Wang, Hannes Taubenböck, and Xiao Xiang Zhu. Building instance classification using street view images. ISPRS Iournal of Photogrammetry and Remote Sensing, 145:44–59, 2018.
- Gebru, et al [2017] Timnit Gebru, Jonathan Krause, Yilun Wang, Duyun Chen, Jia Deng, Erez Lieberman Aiden, and Li Fei-Fei. Using deep learning and google street view to estimate the demographic makeup of neighborhoods across the united states. Proceedings of the National Academy of Sciences, 114(50):13108–13113, 2017.
- Bency, et al [2017] Archith J Bency, Swati Rallapalli, Raghu K Ganti, Mudhakar Srivatsa, and BS Manjunath. Beyond spatial auto-regressive models: Predicting housing prices with satellite imagery. In Proceedings of the IEEE Winter Conference on Applications of Computer Vision, 2017.
- Liu, et al [2017] Xiaobai Liu, Qi Chen, Lei Zhu, Yuanlu Xu, and Liang Lin. Place-centric visual urban perception with deep multi-instance regression. In Proceedings of the 25th ACM international conference on Multimedia, 2017.