Carbon-Deficient Red Giants
Abstract
Carbon-deficient red giants (CDRGs) are a rare class of peculiar red giants, also called “weak G-band” or “weak-CH” stars. Their atmospheric compositions show depleted carbon, a low isotopic ratio, and an overabundance of nitrogen, indicating that the material at the surface has undergone CN-cycle hydrogen-burning. I present Strömgren uvby photometry of nearly all known CDRGs. Barium stars, having an enhanced carbon abundance, exhibit the “Bond-Neff effect”—a broad depression in their energy distributions at 4000 Å, recently confirmed to be due to the CH molecule. This gives Ba II stars unusually low Strömgren photometric indices. I show that CDRGs, lacking CH absorption, exhibit an “anti-Bond-Neff effect”: higher indices than normal red giants. Using precise parallaxes from Gaia DR2, I plot CDRGs in the color-magnitude diagram (CMD) and compare them with theoretical evolution tracks. Most CDRGs lie in a fairly tight clump in the CMD, indicating initial masses in the range 2 to , if they have evolved as single stars. It is unclear whether they are stars that have just reached the base of the red-giant branch and the first dredge-up of CN-processed material, or are more highly evolved helium-burning stars in the red-giant clump. About 10% of CDRGs have higher masses of 4 to , and exhibit unusually high rotational velocities. I show that CDRGs lie at systematically larger distances from the Galactic plane than normal giants, possibly indicating a role of binary mass-transfer and mergers. CDRGs continue to present a major puzzle for our understanding of stellar evolution.
1 Red Giants with Abnormally Weak CH Absorption
The unusual spectrum of the fifth-magnitude star HR 885 was noted on a Harvard objective-prism plate by Annie J. Cannon (1912). She described it as having a late-type spectrum that was peculiar in showing a weakened G band of the CH molecule near 4300 Å: unlike the normally continuous absorption at the G band, the feature was separated into several individual absorption lines. HR 885 was included in the Mt. Wilson catalog of spectroscopic absolute magnitudes (Adams et al. 1935), and assigned a spectral type of G4 and a visual absolute magnitude of +0.2, without further comment. However, Bidelman (1951), based on a slit spectrogram, remarked that “the spectrum is extraordinarily peculiar, with the line spectrum matching fairly well G5 III but with no trace of CN or CH absorption.” Bidelman suggested that HR 885 may present a “unique case of low carbon abundance.”
HR 885 is the prototype of a class of peculiar stars that have been called “weak-CH” or “weak-G band” stars. Given that all known members of this class have proven to be red giants, in this paper I will use a more astrophysical terminology of “carbon-deficient red giants” (CDRGs).
Another star in which “CH is very weak,” 37 Com, was noted by Roman (1952) in her spectral reconnaissance of bright northern F5–K5 stars. An initial curve-of-growth abundance analysis of HR 885, and a similar but less extreme CDRG, HR 6791,111An extensive and useful historical discussion of this star, other CDRGs, and their peculiarities is given by Griffin (1992). was carried out by Greenstein & Keenan (1958). Both stars were confirmed to be underabundant in carbon, by an average factor of about 20, but with approximately normal metal content.
By the mid-1980’s several high-dispersion model-atmosphere abundance analyses of CDRGs had been published (e.g., Sneden et al. 1978; Rao 1978; Lambert & Sawyer 1984; and references therein). These studies confirmed that in representative members of the class, carbon is deficient relative to iron by factors of about 10 to 30, nitrogen is enhanced by factors of up to 4, and metals have roughly solar abundances, all relative to normal red giants.
In spite of the remarkable and poorly understood compositions of these stars, some of them visible to the naked eye, there was a lull in follow-up studies for a couple of decades. In the past few years, however, there has been a renewal of interest, and several authors have published detailed analyses of their chemical compositions and discussions of their evolutionary origins (e.g., Palacios et al. 2012, 2016, hereafter P12 and P16; Adamczak & Lambert 2013, hereafter AL13).
2 Strömgren Photometry
2.1 Carbon-Deficient Giants
From 1974 to 1979 I carried out a program of photoelectric stellar photometry in the Strömgren uvby system, using 0.41-, 0.61-, and 0.91-m telescopes at Cerro Tololo Inter-American Observatory (CTIO) and Kitt Peak National Observatory (KPNO). My program was focused primarily on metal-deficient red giants, many of which I had discovered during examination of objective-prism photographic plates obtained with the Curtis Schmidt telescope at CTIO (and earlier, when the telescope was located in Michigan). My final photometric results for the metal-deficient stars were published almost four decades ago (Bond 1980, hereafter B80). Details of the photometric reductions and calibration to the standard uvby system are given in B80.
In the course of these observations, I had also measured a selection of CDRGs, but these data have remained unpublished. Because of recent renewed interest in these stars (§1), and the availability of new analysis tools and much more precise parallaxes, I believe it is useful to present my results now.
Table 1 gives my photometric measurements of the CDRGs. Successive columns list the star name, the visual magnitude (transformed from the magnitudes), the color, and the color differences, defined as and . The fifth and sixth columns contain the number of nights on which I made observations of each star and the Galactic latitude, and the final column gives a reference to the first publication that reported the carbon deficiency. The average uncertainties of a single observation for this ensemble, calculated from the internal scatter for the stars observed more than once, are 0.012, 0.006, 0.011, and 0.018 mag in , , , and , respectively. Apart from the early discoveries recounted in §1, most of the listed stars were first recognized—many of them by the present writer—on objective-prism plates taken in the Curtis Schmidt survey of the southern hemisphere, and published by Bidelman & MacConnell (1973, hereafter BM73).222My photometry of the BM73 star BD 19 967, as well as its recent Gaia parallax, indicate that it is a fairly normal G dwarf, so it is omitted from Table 1. Cottrell & Norris (1978) had raised similar doubts about the star, based on their photometry in the DDO system. The star may be a misidentification by BM73 of the nearby BD 19 969, which I did not observe. Of the remaining 33 CDRGs listed by BM73, I was able to obtain photometry of 31 of them, missing only HD 119256 and HD 124721. Several more CDRGs were discovered by myself, on Curtis Schmidt plates that I obtained during my searches for metal-deficient stars as described in B80. I have also included in Table 1 uvby photometry for 37 Com, quoted from Crawford & Perry (1989).
Four out of the 41 stars listed in Table 1 (HR 1229, HR 4154, HR 6757, and HR 6766) were measured by Eggen (1993) in a program of photometry on a modified Strömgren uvby system. His observations used a filter with a different (narrower) bandpass than the standard filter, and he denoted his color differences as and . A comparison of our results, in the sense Bond minus Eggen, gives these mean differences: , , , and , with standard deviations of 0.007, 0.004, 0.007, and 0.012 mag, respectively. These differences indicate excellent agreement, with small scatter, between our results, except for a large systematic offset between and . Nearly identical results were reported in B80, when I compared my photometry of metal-deficient red giants with results published by Eggen in several earlier papers.
2.2 Barium Stars and Normal Giants
Barium stars, or “Ba II stars,” are a class of peculiar late-type stars showing enhanced abundances of carbon and of barium and other -process elements, which were first recognized by Bidelman & Keenan (1951, hereafter BK51). Barium stars posed a puzzle from the standpoint of stellar evolution, since carbon and -process elements were not expected to be created and dredged up to the stellar surface until the asymptotic-giant-branch (AGB) stage; however, it was known that Ba II stars only had approximately the luminosities of normal red giants. The explanation came from the recognition that most or all barium stars are members of wide spectroscopic binaries (e.g., McClure 1984), indicating that they are companions of former AGB stars (now white dwarfs) which have been contaminated on their surfaces by processed material accreted from a stellar wind. For recent reviews of barium stars, see, for example, Käppeler et al. (2011), Escorza et al. (2017, 2019), Jorissen et al. (2019), and references therein.
The carbon enhancement in barium stars stands in sharp contrast to the carbon deficiency of CDRGs. This was already noted by BK51, who stated that “The remarkable absence of CH in HR 885 thus represents a departure from a normal spectrum in the opposite sense from that shown by the Ba II stars.” Thus a comparison of the photometric properties of these two groups is of interest. During the 1974–1979 observations described above, I also obtained Strömgren photometry of a large number of Ba II stars. These results are presented in Table 2. It has the same format as Table 1, except that for literature references for the individual barium stars, I refer to the articles in the previous paragraph. In order to provide a sample of the most pronounced barium stars, I only include in Table 2 the 41 stars from my observations that have a “barium index” (Warner 1965) between Ba3 and Ba5 (the highest value), according to the catalog of Ba II stars assembled by Escorza et al. (2017).
Finally, for comparison of these two peculiar groups with normal red giants, I selected a sample of bright field stars of spectral type G0 and later, and luminosity classes of II–III, from the catalog of uvby standard stars published by Perry et al. (1987). There are 29 stars in that paper that satisfy the selection criteria. Table 3 presents the uvby photometry for these stars, and their spectral types, taken directly from Perry et al.
3 The Anti-Bond-Neff Effect in Carbon-Deficient Giants
Fifty years ago, John Neff and I published a paper (Bond & Neff 1969, hereafter BN69) on a surprising result we had found using intermediate-band photometry of a small sample of barium stars. Our data showed that the Ba II stars’ spectral-energy distributions (SEDs) exhibit a broad absorption feature, centered near 4000 Å. In the prototypical Ba II star Cap, the absorption has a width of at least 1500 Å and a maximum depth of about 0.3 mag, compared to the SED of a normal red giant of about the same spectral type. Other authors have called this phenomenon the “Bond-Neff effect” (hereafter BNE), a terminology I immodestly adopt here.
The species responsible for the BNE was a puzzle for many years. BN69 noted that the broad feature is similar to a pseudo-continuous absorption seen in laboratory studies of the C3 molecule (Brewer & Engelke 1962; see also a later paper by Snow & Wells 1980), as well as in comets and very cool carbon stars (see references in BN69). However, it would be surprising for C3 to exist in the atmospheres of stars as warm as the Ba II stars; moreover, its presence was directly ruled out by Baird (1982), who showed that the expected rotational lines of C3 are absent in high-dispersion spectra of a bright barium star. Williams (1975) suggested instead that the BNE is caused simply by the increased strength of the known molecular bands of CN, CH, and C2 in the Ba II stars. However, Fix & Neff (1975) and Fix (1976) used spectrophotometric scans of several barium stars to show that the absorption feature is continuous at the resolution of their data. In a conference abstract, McWilliam & Smith (1984) proposed alternatively that the BNE is due to the large number of absorption lines of -process rare-earth elements in the broad region around 4000 Å in the spectra of barium stars.
The bandpass of the Strömgren filter lies near the wavelength of the maximum absorption of the BNE.333The filter has an effective wavelength of 4100 Å and a width of 170 Å (Bessell 2005). Thus the index, which can be written as , is very sensitive to the effect. I showed, in my study of extremely metal-deficient giants (B80, Figure 7a), that the index is highly correlated with the strength of the CH G band, in stars with very weak lines of other species. This finding would appear to rule out the McWilliam–Smith suggestion as the dominant contributor, and it strongly pointed to CH as the primary carrier of the BNE absorption feature.
Masseron et al. (2014, hereafter M14) now appear to have settled the issue. M14 performed an extensive update of the line list for the CH molecule, adding newly identified energy levels, and including the role of broad predissociation lines—which they showed are present in the spectrum of the Sun, but previously unrecognized (see their Appendix A for a discussion of the predissociation phenomenon). By incorporating these new data into calculations of synthetic stellar spectra for stars with enhanced carbon abundances, M14 were able to reproduce the BNE absorption feature as originally presented by BN69. Most of the BNE was indeed shown to be due to CH, but enhanced line blanketing due to high -process abundances in Ba II stars does also contribute.
Because of the strengthened CH absorption feature, Ba II stars have systematically lower indices than normal red giants—which was the observation leading to the BN69 discovery. Since the CDRGs are marked by an absence of CH, they should exhibit an anti-BNE; i.e., they would be expected to have higher indices than normal red giants. I will now show that this is indeed the case, by intercomparing the Strömgren photometry of the CDRGs, normal red giants, and Ba II stars presented above.
First, however, the photometry listed in Tables 1, 2, and 3 has to be corrected for interstellar extinction. Estimation of extinction for nearby stars has become much easier in the past few years because of two developments: first, an online tool444https://stilism.obspm.fr/ is available for estimating reddening, , at any given Galactic position and distance (Capitanio et al. 2017); second, precise stellar distances are now available from the recent Gaia Data Release 2 (DR2; Gaia Collaboration et al. 2018).
Using these two tools, I determined the reddening for each of the stars in Tables 1, 2, and 3. Table 4 presents the Gaia DR2 parallax, the Gaia photometry (apparent magnitude , color index ), and the reddening for the CDRGs, barium stars, and field red giants. (A few of the red giants in Table 3 are so bright that they are not included in DR2, and are omitted from Table 4.) In determining the distances, I adjusted each Gaia parallax upward by 0.029 mas, as recommended by Lindegren et al. (2018). In most cases, the reddening values are low, which is not surprising since the stars are relatively bright and nearby; however, a few of them have higher values. Based on the reddenings given in Table 4, I then corrected the Strömgren photometry in Tables 1, 2, and 3, using the formulae given by Crawford (1975): , , and .
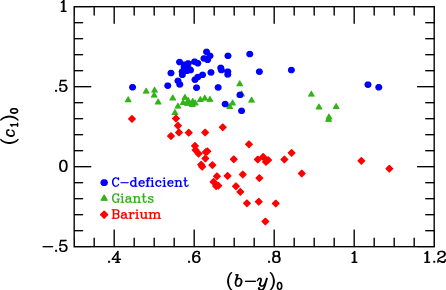
Figure 1 plots the dereddened color difference, denoted , versus the dereddened color index, . The CDRGs are plotted as filled blue circles, the normal giants as green filled triangles, and the Ba II stars as red filled diamonds. The figure dramatically illustrates the BNE: all of the barium stars have smaller values of than the field red giants. The offset to lower values increases with redder color (cooler temperatures), as the strength of the CH absorption increases. The effect on the index reaches values as large as 0.8 mag for the most extreme cases.
The CDRGs in Figure 1 behave oppositely, as expected based on the BNE being due primarily to CH absorption, and because these stars lack CH in their atmospheres. In nearly every case, their indices are higher than those of normal red giants.555A similar finding regarding the indices of CDRGs was reported in a conference abstract by Herr & MacConnell (1972), but without details. Cottrell & Norris (1978) obtained photometry of several CDRGs in the DDO intermediate-band system, and noted that they are bluer in the color than normal red giants; they attributed this to the absence of CH absorption in the 4200 Å bandpass. Eggen (1993) demonstrated that his index is high in several carbon-deficient stars, compared to normal red giants and Ba II stars, but he interpreted the result as indicating excess “emission” around 4000 Å in the former. The few cases of values mixed with the red giants may indicate less extreme degrees of carbon deficiency.666AL13 remark briefly that the star HD 121071 is an example of a CDRG with an intermediate C abundance; however, this designation arises from a typographical error in Hartoog (1978), with the correct carbon-deficient star being a different object, HD 121070.
The BNE and anti-BNE have several important implications. The CH absorption behaves like a continuous opacity, which is strong in Ba II stars, but still present in normal stars such as the field red giants in Figure 1, and even in the Sun. At least until the recent work of M14, this “missing” opacity has not been included in stellar-atmosphere modeling. One result is that, when CH is present, metallic absorption lines will be formed higher in the atmosphere in the region around 4000 Å, and thus weakened. Abundance determinations will therefore give systematically low results for lines in this spectral region, if the model atmosphere does not include the CH opacity. Luck & Bond (1982, their Figure 1) demonstrated that this was the case in three subgiant CH stars (or dwarf barium stars), where metallic lines below 4200 Å gave lower abundances than lines at longer wavelengths.
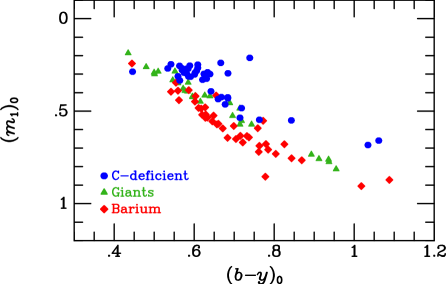
Figure 2 shows the reddening-corrected metallicity index, , plotted against the corrected color. Recalling the definition, , we see that the index will also be affected by the Bond-Neff absorption in the bandpass, but by a lesser amount than the index. The figure shows that the index is indeed higher in Ba II stars than in normal red giants, but the effect is not as large as in Figure 1, since the magnitude is not multiplied by two. The CDRGs have slightly lower indices than the red giants and barium stars, again due to the lack of the CH absorption feature around 4000 Å.
The Strömgren index is usually a useful indicator of metal content (e.g., B80 and references therein), but Figure 2 shows that it is systematically affected in stars with anomalous carbon content, independently of the abundance of heavier elements.
4 Color-Magnitude Diagrams and Initial Masses
The recent availability of Gaia DR2 parallaxes allows considerably more precise placement of nearby stars in the color-magnitude diagram (CMD)777 Throughout this paper, “CMD” means a plot of absolute magnitude vs. color. than was possible with astrometry from previous sources such as Hipparcos. I will present CMDs for the CDRGs, barium stars, and field red giants by plotting the extinction-corrected Gaia absolute magnitude versus corrected Gaia color index . I made extinction corrections by using the values given in Table 4, and applying the approximate relations and from Andrae et al. (2018). I determined the absolute magnitudes based on the DR2 parallaxes also in Table 4, with the Lindegren et al. (2018) correction applied.888I use the broad-band Gaia photometry, rather than vs. based on my data in this paper, because it is formally more precise than my ground-based photometry, is all-sky, from space, with a single instrument and filters, and should be less affected by the Bond-Neff feature.
The resulting CMDs are shown in Figure 3 (left) for the Ba II stars and field red giants (color-coded as in Figures 1 and 2), and in Figure 3 (right) for the CDRGs. Superposed on both figures are evolutionary tracks in the Gaia photometric system, for single stars of masses 1.0 to , in steps of , obtained from the MESA Isochrones and Stellar Tracks (MIST, version 1.2; Dotter 2016; Choi et al. 2016) website999http://waps.cfa.harvard.edu/MIST/ and its web interpolator. These tracks assume an initial rotation of . According to recent abundance analyses (e.g., AL13 and P16), CDRGs are typically slightly metal-deficient, with an average to . The tracks plotted in Figure 3 assume .
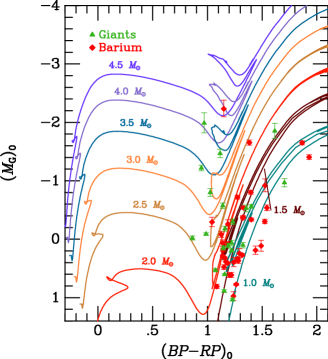
The barium stars and field red giants in Figure 3 (left) show a wide range in CMD location and the implied initial stellar masses. This is not surprising, since the Ba II stars are considered to be “bystanders” that were polluted by a former AGB companion. Thus they should be drawn at random from the population of normal red giants, as appears to be the case in the figure.
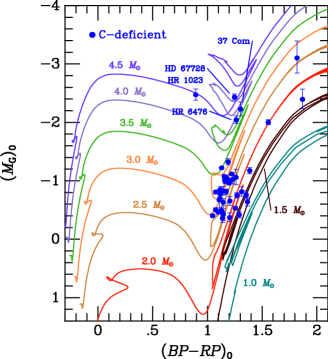
By contrast, the CDRGs have a very different distribution in the CMD. Most of them are concentrated in a fairly tight clump, implying that most of them had initial masses of about 2 to —on the assumption that they have evolved as single stars. There are a few outliers of initial masses as low as , and three luminous stars that appear to have evolved to higher luminosity from the main clump. The requirement of a fairly sharp minimum mass for stars that exhibit the carbon deficiency appears to be a robust result, since the CDRGs were selected in spectroscopic surveys without regard to, or even advance knowledge of, their absolute magnitudes.
Apart from the clumped stars, there are four luminous outliers, all lying near the single-star tracks for stars of to . They are labelled in Figure 3 (right): HR 1023, HD 67728, 37 Com, and HR 6476. It is striking that AL13, in their high-resolution spectroscopic analysis of 24 CDRGs, singled out HR 1023, HD 67728, and 37 Com as having unusually high rotational velocities compared to the rest of their sample: these stars’ values of are 22.7 (HR 1023; de Medeiros & Mayor 1999), 13.0 (HD 67728; P16), and (37 Com; Drake et al. 2002). The AL13 sample did not include HR 6476, but its rotation is also unusually high compared to normal red giants, with , according to Hekker & Meléndez (2007).
My conclusion that most of the CDRGs had initial masses of 2 to , with a fairly sharp lower-mass cutoff, generally agrees with earlier published results, but strengthens and refines them because of the higher precision of the Gaia parallaxes. For example, based on locations in the CMD determined from Hipparcos parallaxes, AL13 inferred that their sample of two dozen CDRGs have masses in the range 2.5 to , with a mean of about . P16, also using Hipparcos distances, refined the mass range for their sample of 19 CDRGs to 3.2 to . The existence of a distinct smaller group of CDRGs with higher masses of about 4 to and unusually high rotations is, to my knowledge, a new result.
5 Evolutionary Status
Depletion of carbon is a strong signature of material that has been exposed to hydrogen-burning via the CN-cycle. When equilibrium is reached, C is underabundant by a factor of about 20, the carbon isotopic ratio declines to about 3, and the abundance of 14N is increased, such that the sum of 12C, 13C, and 14N remains constant (e.g., Iben 1967; AL13). The abundance of lithium is drastically reduced. In general, published CNO abundance analyses of CDRGs give results in agreement with these expectations (see P12, AL13, P16, and references therein), except that some GDRGs are not depleted in Li. These findings indicate that the surfaces of these stars are strongly contaminated with material that was once deep in the hydrogen-burning core.
The papers by P12, AL13, and P16 give extended discussions of possible evolutionary scenarios to explain the existence of these rare stars. They generally reach the conclusion that “the weak-G-band puzzle [is] largely unsolved” (P16). As P12 and P16 point out, their locations in the CMD (e.g., my Figure 3 right) are consistent with the stars being either (1) subgiants that have just reached the base of the red-giant branch (RGB)—which is about the location of the onset of the first “dredge-up” in normal red giants, or (2) stars that reached the tip of the RGB, ignited core helium-burning, and dropped back to the red-giant clump. But in neither case does standard evolutionary theory predict a surface composition dominated by fully CN-processed material. AL13 discuss the key finding, reinforced by my results here, that CDRGs are more massive on average than normal field red giants. They raise the possibility that rotational mixing, due to the faster rotations of main-sequence stars in this mass range as compared to the lower-mass progenitors of typical red giants, could be the cause of the mixing to the surface. This scenario to explain CDRGs has recently been discussed by Smiljanic et al. (2018). However, many main-sequence stars in this mass range are fast rotators, but CDRGs are extremely rare. On the other hand, the fast rotations associated with the four most massive CDRGs that I have noted above may be an important new clue.
The above discussions have considered the evolution of single stars. In a recent paper, Izzard et al. (2018) discuss mass-transfer and stellar mergers, in the context of explaining the presence of fairly massive stars in the old population of the Galactic thick disk. They raise the possibility that C-poor and N-rich stars could be the result of binary-star interactions that expose CN-processed material at the surface, such as in the CDRGs.
A striking feature of the data presented in Table 1 is that many of the CDRGs lie at fairly high Galactic latitudes, in spite of them appearing to be stars of higher masses than normal red giants. Note that the BM73 survey covered essentially the entire southern hemisphere, so there should not be a bias against low latitudes.
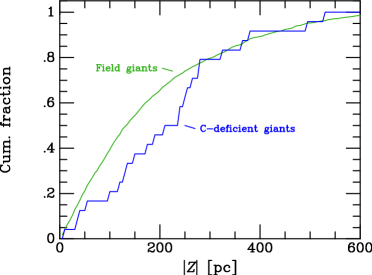
Is it possible that CDRGs are descended from binary systems that have merged or undergone mass-accretion, giving them enhanced masses compared to the single stars that are currently evolving in their host population? In this case, they should mimic the properties of an older population, compared to single stars of the same mass. I performed an experiment of extracting from Gaia DR2 a sample of normal red giants that simulates the BM73 selection. I required the DR2 stars to lie in the southern hemisphere as do most of the BM73 stars (), to be brighter than the approximate magnitude limit of the BM73 sample (), and to lie in the main clump of CDRGs in the CMD shown in Figure 3 (right), i.e., and . This selection resulted in 1,883 stars. The BM73 sample101010To avoid introducing a bias, I did not include the five stars in Table 1 that I had discovered, because my objective-prism survey was limited to high-latitude fields. contains 28 CDRGs lying within the same box in the CMD, showing that they represent only 1.5% of the red giants, even when the red giants are limited to this relatively narrow range of colors and absolute magnitudes. I then calculated the absolute value of the distance from the Galactic plane, , for each star in the two samples, using their known distances and Galactic latitudes.
Figure 4 shows the cumulative distribution of values for the field giants and CDRGs. It illustrates that the CDRGs indeed do systematically lie at larger distances from the Galactic plane than the field red giants. This could be consistent with a scenario in which the CDRGs have arisen from an older and dynamically hotter population than the field giants, and have acquired their higher masses through relatively recent binary mergers or mass transfer. A Kolmogorov-Smirnov test indicates a probability of only 1.7% that the CDRG distribution of values in Figure 4 was drawn from the red-giant population.
6 Summary and Future Work
CDRGs are a rare class of red giants whose atmospheres are composed of material exposed to CN-cycle hydrogen-burning. The main conclusions of this study are the following:
1. I present Strömgren uvby photometry for a nearly complete sample of the known CDRGs, and for a selection of barium stars and normal red giants. Barium stars exhibit the “Bond-Neff effect” of unusually low Strömgren indices, now known to be caused by a broad CH absorption feature centered around 4000 Å. The CDRGs, lacking CH absorption, show an “anti-Bond-Neff effect” of unusually high indices compared to normal red giants.
2. The locations of CDRGs in the color-absolute magnitude diagram are now well defined because of precise parallaxes from Gaia DR2. Most of them lie in a tight clump in the CMD consistent with initial masses of about 2 to . A second, smaller, and possibly distinct group has higher masses of to , and they all exhibit unusually high rotational velocities.
3. The evolutionary status of CDRGs remains unclear, as does the mechanism that has brought the highly processed material to the surface. It is uncertain whether CDRGs are hydrogen-burning stars that have just reached the bottom of the red-giant branch and the onset of the first dredge-up, or are more highly evolved helium-burning red-giant clump stars. Another mystery is why there is an apparent lower-mass cutoff for the occurrence of the carbon-depletion phenomenon.
4. A hint that CDRGs might be members of binaries that have increased in mass through mass-transfer or mergers comes from their systematically higher distances from the Galactic plane than normal red giants lying in the same location in the CMD. The high rotation of the high-luminosity subset may support such speculation.
Nearly seven decades after Bidelman’s discovery of the peculiarities of HR 885, these stars continue to pose one of the most poorly understood puzzles in stellar evolution. There are several avenues for future studies. A systematic test of binarity would be extremely useful. As many authors have noted, the sample of known CDRGs remains distressingly small, a little over three dozen; thus spectroscopic surveys that would find more of them are highly desirable. One project that could approximately double the known number would be a systematic examination of an existing collection of objective-prism plates covering the entire northern sky, obtained with the Burrell Schmidt telescope at KPNO (Bidelman 1998; see also Bond 2017).
References
- Adamczak & Lambert (2013) Adamczak, J., & Lambert, D. L. 2013, ApJ, 765, 155 (AL13)
- Adams et al. (1935) Adams, W. S., Joy, A. H., Humason, M. L., et al. 1935, ApJ, 81, 187
- Andrae et al. (2018) Andrae, R., Fouesneau, M., Creevey, O., et al. 2018, A&A, 616, A8
- Baird (1982) Baird, S. R. 1982, ApJ, 252, 305
- Bessell (2005) Bessell, M. S. 2005, ARA&A, 43, 293
- Bidelman (1951) Bidelman, W. P. 1951, ApJ, 113, 304
- Bidelman (1957) Bidelman, W. P. 1957, PASP, 69, 326
- Bidelman (1998) Bidelman, W. P. 1998, PASP, 110, 270
- Bidelman & Keenan (1951) Bidelman, W. P., & Keenan, P. C. 1951, ApJ, 114, 473 (BK51)
- Bidelman & MacConnell (1973) Bidelman, W. P., & MacConnell, D. J. 1973, AJ, 78, 687 (BM73)
- Bond (1980) Bond, H. E. 1980, ApJS, 44, 517 (B80)
- Bond (2017) Bond, H. E. 2017, PASP, 129, 010201
- Bond & Neff (1969) Bond, H. E., & Neff, J. S. 1969, ApJ, 158, 1235 (BN69)
- Brewer & Engelke (1962) Brewer, L., & Engelke, J. L. 1962, J. Chem. Phys., 36, 992
- Cannon (1912) Cannon, A. J. 1912, Annals of Harvard College Observatory, 56, 65
- Capitanio et al. (2017) Capitanio, L., Lallement, R., Vergely, J. L., Elyajouri, M., & Monreal-Ibero, A. 2017, A&A, 606, A65
- Choi et al. (2016) Choi, J., Dotter, A., Conroy, C., et al. 2016, ApJ, 823, 102
- Cottrell & Norris (1978) Cottrell, P. L., & Norris, J. 1978, ApJ, 221, 893
- Crawford (1975) Crawford, D. L. 1975, PASP, 87, 481
- Crawford & Perry (1989) Crawford, D. L., & Perry, C. L. 1989, PASP, 101, 601
- de Medeiros & Mayor (1999) de Medeiros, J. R., & Mayor, M. 1999, A&AS, 139, 433
- Dotter (2016) Dotter, A. 2016, ApJS, 222, 8
- Drake et al. (2002) Drake, N. A., de la Reza, R., da Silva, L., & Lambert, D. L. 2002, AJ, 123, 2703
- Eggen (1993) Eggen, O. J. 1993, AJ, 106, 80
- Escorza et al. (2017) Escorza, A., Boffin, H. M. J., Jorissen, A., et al. 2017, A&A, 608, A100
- Escorza et al. (2019) Escorza, A., Karinkuzhi, D., Jorissen, A., et al. 2019, A&A, 626, A128
- Fix (1976) Fix, J. D. 1976, ApJ, 203, 463
- Fix & Neff (1975) Fix, J. D., & Neff, J. S. 1975, MNRAS, 173, 83P
- Gaia Collaboration et al. (2018) Gaia Collaboration, Brown, A. G. A., Vallenari, A., et al. 2018, A&A, 616, A1
- Greenstein, & Keenan (1958) Greenstein, J. L., & Keenan, P. C. 1958, ApJ, 127, 172
- Griffin (1992) Griffin, R. F. 1992, The Observatory, 112, 219
- Hartoog (1978) Hartoog, M. R. 1978, PASP, 90, 167
- Hekker & Meléndez (2007) Hekker, S., & Meléndez, J. 2007, A&A, 475, 1003
- Herr & Mac Connell (1972) Herr, R. B., & MacConnell, D. J. 1972, BAAS, 4, 310
- Iben (1967) Iben, I., Jr. 1967, ARA&A, 5, 571
- Izzard et al. (2018) Izzard, R. G., Preece, H., Jofre, P., et al. 2018, MNRAS, 473, 2984
- Jorissen et al. (2019) Jorissen, A., Boffin, H. M. J., Karinkuzhi, D., et al. 2019, A&A, 626, A127
- Käppeler et al. (2011) Käppeler, F., Gallino, R., Bisterzo, S., & Aoki, W. 2011, Reviews of Modern Physics, 83, 157
- Lambert, & Sawyer (1984) Lambert, D. L., & Sawyer, S. R. 1984, ApJ, 283, 192
- Lindegren et al. (2018) Lindegren, L., Hernández, J., Bombrun, A., et al. 2018, A&A, 616, A2
- Luck & Bond (1982) Luck, R. E., & Bond, H. E. 1982, ApJ, 259, 792
- Masseron et al. (2014) Masseron, T., Plez, B., Van Eck, S., et al. 2014, A&A, 571, A47
- McClure (1984) McClure, R. D. 1984, PASP, 96, 117
- McWilliam & Smith (1984) McWilliam, A., & Smith, V. V. 1984, BAAS, 16, 973
- Palacios et al. (2012) Palacios, A., Parthasarathy, M., Bharat Kumar, Y., & Jasniewicz, G. 2012, A&A, 538, A68 (P12)
- Palacios et al. (2016) Palacios, A., Jasniewicz, G., Masseron, T., et al. 2016, A&A, 587, A42 (P16)
- Perry et al. (1987) Perry, C. L., Olsen, E. H., & Crawford, D. L. 1987, PASP, 99, 1184
- Rao (1978) Rao, N. K. 1978, MNRAS, 185, 585
- Roman (1952) Roman, N. G. 1952, ApJ, 116, 122
- Smiljanic et al. (2018) Smiljanic, R., Donati, P., Bragaglia, A., Lemasle, B., & Romano, D. 2018, A&A, 616, A112
- Sneden et al. (1978) Sneden, C., Lambert, D. L., Tomkin, J., & Peterson, R. C. 1978, ApJ, 222, 585
- Snow & Wells (1980) Snow, W. L., & Wells, W. L. 1980, J. Chem. Phys., 73, 2547
- Spinrad & Taylor (1969) Spinrad, H., & Taylor, B. J. 1969, ApJ, 157, 1279
- Warner (1965) Warner, B. 1965, MNRAS, 129, 263
- Williams (1975) Williams, P. M. 1975, MNRAS, 170, 343
| Star | aaNumber of photometric observations. | [deg] | DiscoverybbReference for first discovery of carbon-deficient nature. Reference codes are: B51 (Bidelman 1951); B57 (Bidelman 1957); BM73 (Bidelman & MacConnell 1973); C12 (Cannon 1912); HEB (this paper; discovered by author on Curtis Schmidt plate); R52 (Roman 1952); ST69 (Spinrad & Taylor 1969). | ||||
|---|---|---|---|---|---|---|---|
| CD 28 75 | 8.967 | 1.039 | 0.682 | 0.514 | 1 | 82.65 | HEB |
| HD 17232 | 8.723 | 1.080 | 0.653 | 0.500 | 2 | 58.75 | HEB |
| HR 885 | 5.475 | 0.574 | 0.236 | 0.591 | 4 | 10.21 | C12,B51 |
| HD 18636 | 7.645 | 0.571 | 0.253 | 0.655 | 3 | 61.27 | BM73 |
| HD 20090 | 8.052 | 0.782 | 0.541 | 0.597 | 3 | 56.02 | HEB |
| HR 1023 | 6.364 | 0.549 | 0.254 | 0.517 | 5 | 41.25 | BM73 |
| BD +5 593 | 9.361 | 0.835 | 0.185 | 0.651 | 4 | 31.91 | BM73 |
| HR 1299 | 6.451 | 0.665 | 0.404 | 0.496 | 2 | 47.05 | BM73 |
| HD 28932 | 7.942 | 0.643 | 0.271 | 0.501 | 4 | 29.70 | BM73 |
| HD 30297 | 8.575 | 0.712 | 0.216 | 0.581 | 4 | 03.00 | B57 |
| HD 31274 | 7.121 | 0.607 | 0.300 | 0.657 | 3 | 39.46 | BM73 |
| HD 31869 | 9.286 | 0.578 | 0.276 | 0.595 | 3 | 35.93 | BM73 |
| HD 36552 | 8.077 | 0.542 | 0.267 | 0.508 | 3 | 32.54 | BM73 |
| HD 40402 | 8.596 | 0.581 | 0.266 | 0.576 | 2 | 23.22 | BM73 |
| HD 49960 | 8.346 | 0.657 | 0.288 | 0.683 | 2 | 14.03 | BM73 |
| HD 54627 | 8.775 | 0.621 | 0.302 | 0.618 | 2 | 16.81 | BM73 |
| HD 56438 | 8.091 | 0.674 | 0.277 | 0.676 | 2 | 15.84 | BM73 |
| HD 67728 | 7.542 | 0.713 | 0.452 | 0.398 | 2 | 07.00 | BM73 |
| HD 78146 | 8.571 | 0.734 | 0.403 | 0.617 | 2 | 12.68 | BM73 |
| HD 82595 | 8.189 | 0.666 | 0.314 | 0.725 | 2 | 10.68 | BM73 |
| HD 91622 | 8.224 | 0.703 | 0.419 | 0.598 | 3 | 52.49 | HEB |
| HR 4154 | 6.108 | 0.602 | 0.265 | 0.649 | 2 | 12.62 | BM73 |
| HD 94956 | 8.460 | 0.609 | 0.281 | 0.630 | 2 | 27.33 | BM73 |
| HD 102851 | 8.788 | 0.684 | 0.286 | 0.701 | 2 | 10.25 | BM73 |
| CD 37 7613 | 9.842 | 0.624 | 0.283 | 0.640 | 1 | 23.69 | BM73 |
| HD 105783 | 9.092 | 0.793 | 0.195 | 0.714 | 1 | 20.20 | BM73 |
| 37 ComccPhotometry quoted from Crawford & Perry (1989). | 4.890 | 0.726 | 0.482 | 0.350 | 4 | 85.86 | R52 |
| HD 120170 | 9.041 | 0.604 | 0.263 | 0.603 | 3 | 51.55 | BM73 |
| HR 5188 | 5.940 | 0.940 | 0.519 | 0.623 | 1 | 20.06 | BM73 |
| HD 132776 | 8.827 | 0.740 | 0.413 | 0.588 | 3 | 46.69 | BM73 |
| HD 146116 | 7.697 | 0.700 | 0.305 | 0.589 | 4 | 34.00 | BM73 |
| HR 6476 | 5.758 | 0.807 | 0.506 | 0.467 | 3 | 23.43 | ST69 |
| HR 6757 | 6.338 | 0.698 | 0.262 | 0.563 | 4 | 09.86 | BM73 |
| HR 6766 | 4.559 | 0.614 | 0.265 | 0.647 | 3 | 04.02 | BM73 |
| HR 6791 | 5.006 | 0.578 | 0.330 | 0.516 | 5 | 25.90 | GK58 |
| HD 188028ddDue to a typographical error, Bidelman & MacConnell (1973) designated this star as HD 188328. | 7.741 | 0.665 | 0.290 | 0.619 | 2 | 24.82 | BM73 |
| HD 198718 | 8.631 | 0.592 | 0.274 | 0.641 | 3 | 39.97 | BM73 |
| HD 201557 | 9.247 | 0.656 | 0.388 | 0.592 | 3 | 41.16 | BM73 |
| HD 204046 | 9.009 | 0.721 | 0.284 | 0.700 | 2 | 45.87 | BM73 |
| HD 207774 | 8.929 | 0.590 | 0.302 | 0.542 | 2 | 43.09 | BM73 |
| HD 215974 | 8.492 | 0.629 | 0.241 | 0.616 | 3 | 29.21 | HEB |
| Star | aaNumber of photometric observations. | ||||
|---|---|---|---|---|---|
| HD 4084 | 8.611 | 0.679 | 0.591 | 0.248 | 1 |
| HD 4395 | 7.672 | 0.446 | 0.242 | 0.299 | 3 |
| HR 774 | 5.794 | 0.771 | 0.685 | 0.069 | 3 |
| HD 19014 | 8.215 | 1.080 | 0.885 | 0.049 | 2 |
| HD 20394 | 8.734 | 0.679 | 0.461 | 0.095 | 3 |
| HD 24035 | 8.510 | 0.763 | 0.625 | 0.222 | 2 |
| HD 26886 | 7.992 | 0.587 | 0.336 | 0.308 | 3 |
| HD 29370 | 9.312 | 0.653 | 0.553 | 0.012 | 2 |
| HD 31487 | 8.094 | 0.843 | 0.530 | 0.075 | 3 |
| HD 32712 | 8.527 | 0.708 | 0.578 | 0.048 | 2 |
| HD 36598 | 8.030 | 0.782 | 0.713 | 0.214 | 2 |
| HD 43389 | 8.330 | 0.920 | 0.749 | 0.032 | 2 |
| HR 2392 | 6.284 | 0.659 | 0.571 | 0.059 | 3 |
| HD 49641 | 7.148 | 0.800 | 0.671 | 0.034 | 3 |
| HD 50082 | 7.455 | 0.610 | 0.446 | 0.132 | 2 |
| HD 62017 | 8.814 | 0.564 | 0.388 | 0.196 | 1 |
| HD 65854 | 8.419 | 0.571 | 0.438 | 0.215 | 3 |
| HD 82221 | 7.960 | 0.810 | 0.700 | 0.046 | 1 |
| HD 84678 | 8.984 | 0.929 | 0.806 | 0.312 | 1 |
| HD 88035 | 9.139 | 0.656 | 0.527 | 0.101 | 1 |
| HD 88562 | 8.550 | 0.874 | 0.745 | 0.092 | 2 |
| HD 89175 | 7.720 | 0.681 | 0.514 | 0.089 | 1 |
| HD 91208 | 8.052 | 0.580 | 0.383 | 0.260 | 2 |
| HD 92626 | 7.142 | 0.824 | 0.725 | 0.226 | 1 |
| HR 4474 | 6.137 | 0.637 | 0.516 | 0.093 | 4 |
| HD 107541 | 9.364 | 0.673 | 0.410 | 0.118 | 1 |
| HR 5058 | 5.115 | 0.708 | 0.650 | 0.122 | 2 |
| HD 120620 | 9.628 | 0.645 | 0.531 | 0.055 | 1 |
| HD 123949 | 8.765 | 0.862 | 0.667 | 0.052 | 1 |
| HD 178717 | 7.163 | 1.208 | 0.833 | 0.011 | 2 |
| HD 183915 | 7.315 | 0.821 | 0.572 | 0.057 | 3 |
| HD 199435 | 8.305 | 0.667 | 0.470 | 0.022 | 2 |
| HD 199939 | 7.422 | 0.749 | 0.660 | 0.043 | 2 |
| HD 201657 | 8.022 | 0.734 | 0.628 | 0.047 | 2 |
| HD 201824 | 8.964 | 0.643 | 0.512 | 0.005 | 2 |
| Cap | 3.753 | 0.607 | 0.418 | 0.105 | 1 |
| HD 204886 | 8.169 | 0.749 | 0.638 | 0.142 | 1 |
| HD 205011 | 6.439 | 0.641 | 0.475 | 0.216 | 1 |
| HD 211594 | 8.094 | 0.696 | 0.557 | 0.112 | 3 |
| HD 219116 | 9.286 | 0.599 | 0.382 | 0.215 | 2 |
| CPD 64 4333 | 9.618 | 0.725 | 0.630 | 0.155 | 1 |
| Star | Sp. Type | ||||
|---|---|---|---|---|---|
| HR 373 | 5.411 | 0.554 | 0.285 | 0.335 | G5 IIIe |
| HR 617 | 2.000 | 0.696 | 0.526 | 0.395 | K2 IIIab |
| HR 1030 | 3.613 | 0.547 | 0.333 | 0.426 | G6 III |
| HR 1327 | 5.262 | 0.513 | 0.286 | 0.402 | G5 IIb |
| HR 1346 | 3.637 | 0.596 | 0.422 | 0.385 | K0 IIIab |
| HR 1373 | 3.759 | 0.597 | 0.424 | 0.405 | K0 III |
| HR 1409 | 3.529 | 0.616 | 0.449 | 0.417 | G9.5 III |
| HR 1411 | 3.849 | 0.584 | 0.394 | 0.393 | K0 IIIb |
| HR 1457 | 0.860 | 0.955 | 0.814 | 0.373 | K5 III |
| HR 1577 | 2.690 | 0.937 | 0.775 | 0.307 | K3 II |
| HR 2985 | 3.570 | 0.573 | 0.379 | 0.398 | G8 IIIa |
| HR 3003 | 4.848 | 0.895 | 0.735 | 0.451 | K5 III |
| HR 3249 | 3.518 | 0.914 | 0.758 | 0.371 | K4 III |
| HR 3800 | 4.552 | 0.561 | 0.349 | 0.375 | G8.5 III |
| HR 4057 | 1.980 | 0.689 | 0.457 | 0.373 | K1 IIIb |
| HR 4166 | 4.720 | 0.512 | 0.297 | 0.477 | G2 IIa |
| HR 4392 | 4.989 | 0.610 | 0.416 | 0.396 | G7.5 IIIa: |
| HR 4695 | 4.969 | 0.717 | 0.485 | 0.516 | K0 IIIb |
| HR 4883 | 4.932 | 0.437 | 0.186 | 0.416 | G0 IIIp |
| HR 5681 | 3.490 | 0.587 | 0.346 | 0.410 | G8 III |
| HR 5854 | 2.640 | 0.715 | 0.572 | 0.445 | K2 IIIb |
| HR 5947 | 4.150 | 0.751 | 0.570 | 0.414 | K2 IIIab |
| HR 5997 | 4.316 | 0.522 | 0.285 | 0.448 | G3 II-III |
| HR 6603 | 2.760 | 0.719 | 0.553 | 0.451 | K2 III |
| HR 7328 | 3.760 | 0.579 | 0.390 | 0.430 | G9 III |
| HR 7479 | 4.386 | 0.489 | 0.259 | 0.471 | G1 III |
| HR 7525 | 2.711 | 0.936 | 0.762 | 0.292 | K3 II |
| HR 7949 | 2.460 | 0.627 | 0.415 | 0.425 | K0 III |
| HR 8551 | 4.790 | 0.640 | 0.420 | 0.418 | K0 III |
| Star | Parallax | |||
|---|---|---|---|---|
| [mas] | [mag] | [mag] | [mag] | |
| Carbon-Deficient Red Giants | ||||
| CD 28 75 | 0.49860.0665 | 8.2987 | 1.8248 | 0.006 |
| HD 17232 | 0.80880.0638 | 8.0382 | 1.8924 | 0.025 |
| HR 885 | 6.59940.0865 | 5.1716 | 1.1194 | 0.043 |
| HD 18636 | 2.70350.0235 | 7.3743 | 1.1088 | 0.010 |
| HD 20090 | 1.71510.0422 | 7.6706 | 1.4126 | 0.026 |
| HR 1023 | 2.09720.0939 | 6.1664 | 1.0321 | 0.139 |
| BD +5 593 | 1.45830.0467 | 8.8350 | 1.5829 | 0.228 |
| HR 1299 | 3.55920.0230 | 6.1213 | 1.2286 | 0.007 |
| HD 28932 | 1.90470.0533 | 7.6307 | 1.2312 | 0.050 |
| HD 30297 | 2.13670.0745 | 8.2256 | 1.3422 | 0.139 |
| HD 31274 | 2.66160.0263 | 6.8408 | 1.1674 | 0.008 |
| HD 31869 | 1.04380.0251 | 9.0202 | 1.1305 | 0.011 |
| HD 36552 | 2.24430.0249 | 7.8348 | 1.0587 | 0.011 |
| HD 40402 | 1.55220.0341 | 8.3367 | 1.1283 | 0.014 |
| HD 49960 | 1.62390.0275 | 8.0318 | 1.2412 | 0.044 |
| HD 54627 | 1.68710.0290 | 8.4834 | 1.1887 | 0.047 |
| HD 56438 | 2.30800.0289 | 7.7341 | 1.3098 | 0.055 |
| HD 67728 | 1.21320.0301 | 7.1902 | 1.2959 | 0.048 |
| HD 78146 | 1.72260.0368 | 8.2095 | 1.3580 | 0.089 |
| HD 82595 | 1.86940.0380 | 7.8857 | 1.2194 | 0.047 |
| HD 91622 | 1.84440.0702 | 7.8740 | 1.3384 | 0.026 |
| HR 4154 | 3.97400.0299 | 5.8126 | 1.1531 | 0.023 |
| HD 94956 | 1.65640.0508 | 8.1743 | 1.1617 | 0.046 |
| HD 102851 | 1.32480.0447 | 8.4399 | 1.2874 | 0.060 |
| CD 37 7613 | 1.05940.0397 | 9.5697 | 1.1968 | 0.058 |
| HD 105783 | 1.39470.0473 | 8.7378 | 1.4393 | 0.073 |
| 37 Com | 4.69810.2586 | 4.4196 | 1.3136 | 0.010 |
| HD 120170 | 1.47890.0701 | 8.7479 | 1.1751 | 0.030 |
| HR 5188 | 3.77750.0759 | 5.3562 | 1.6874 | 0.131 |
| HD 132776 | 1.76870.0444 | 8.4605 | 1.3656 | 0.076 |
| HD 146116 | 2.00630.0492 | 7.3473 | 1.2972 | 0.107 |
| HR 6476 | 3.69370.1082 | 5.3506 | 1.3883 | 0.125 |
| HR 6757 | 4.35800.0566 | 5.9747 | 1.2850 | 0.130 |
| HR 6766 | 9.82520.3403 | 4.2189 | 1.1515 | 0.007 |
| HR 6791 | 9.20130.1416 | 4.7065 | 1.0946 | 0.019 |
| HD 188028 | 2.26040.0458 | 7.4084 | 1.2602 | 0.100 |
| HD 198718 | 1.70950.0440 | 8.3491 | 1.1477 | 0.021 |
| HD 201557 | 1.21130.0422 | 8.9142 | 1.2243 | 0.019 |
| HD 204046 | 1.16020.0722 | 8.6612 | 1.3101 | 0.049 |
| HD 207774 | 1.38760.1160 | 8.6543 | 1.1484 | 0.041 |
| HD 215974 | 1.77230.0511 | 8.1979 | 1.1992 | 0.054 |
| Barium Red Giants | ||||
| HD 4084 | 2.57120.0554 | 8.2927 | 1.2823 | 0.010 |
| HD 4395 | 11.13820.0470 | 7.4924 | 0.8954 | 0.002 |
| HR 774 | 6.79290.0709 | 5.4525 | 1.3260 | 0.011 |
| HD 19014 | 1.41910.0232 | 7.5465 | 1.8653 | 0.084 |
| HD 20394 | 2.41870.0910 | 8.4484 | 1.2412 | 0.092 |
| HD 24035 | 4.61160.1006 | 8.2024 | 1.2731 | 0.042 |
| HD 26886 | 2.71120.0652 | 7.7281 | 1.1250 | 0.044 |
| HD 29370 | 1.58160.0279 | 9.0462 | 1.1815 | 0.010 |
| HD 31487 | 3.03550.1312 | 7.6813 | 1.4909 | 0.095 |
| HD 32712 | 2.62130.0257 | 8.2169 | 1.2753 | 0.012 |
| HD 36598 | 3.21400.0352 | 7.7137 | 1.3177 | 0.028 |
| HD 43389 | 2.04930.0461 | 7.8749 | 1.5432 | 0.069 |
| HR 2392 | 7.83960.1463 | 5.9974 | 1.1517 | 0.003 |
| HD 49641 | 2.02320.0401 | 6.7837 | 1.3833 | 0.028 |
| HD 50082 | 4.14430.0418 | 7.1856 | 1.1401 | 0.011 |
| HD 62017 | 1.64330.0610 | 8.5875 | 1.0426 | 0.030 |
| HD 65854 | 5.49120.0492 | 8.1641 | 1.1079 | 0.012 |
| HD 82221 | 2.61140.0333 | 7.5541 | 1.4015 | 0.034 |
| HD 84678 | 1.64980.0291 | 8.5698 | 1.5245 | 0.204 |
| HD 88035 | 1.45610.0501 | 8.8829 | 1.1885 | 0.031 |
| HD 88562 | 1.52680.0784 | 8.1199 | 1.5252 | 0.041 |
| HD 89175 | 3.87520.0348 | 7.4491 | 1.1846 | 0.044 |
| HD 91208 | 3.96270.0679 | 7.8020 | 1.0853 | 0.028 |
| HD 92626 | 3.44400.0379 | 6.7579 | 1.3305 | 0.027 |
| HR 4474 | 7.26760.0992 | 5.8697 | 1.1408 | 0.011 |
| HD 107541 | 4.18930.0507 | 9.1422 | 1.1479 | 0.024 |
| HR 5058 | 14.54000.2753 | 4.7947 | 1.2178 | 0.005 |
| HD 120620 | 3.60270.0930 | 9.3574 | 1.1797 | 0.023 |
| HD 123949 | 2.32310.0763 | 8.3298 | 1.4387 | 0.049 |
| HD 178717 | 2.63000.0490 | 6.4707 | 1.9294 | 0.162 |
| HD 183915 | 2.79050.0400 | 6.9457 | 1.3954 | 0.084 |
| HD 199435 | 3.59100.0277 | 7.9785 | 1.2628 | 0.067 |
| HD 199939 | 2.66160.0360 | 7.1338 | 1.2741 | 0.037 |
| HD 201657 | 3.17690.1145 | 7.7117 | 1.2917 | 0.068 |
| HD 201824 | 2.16050.0512 | 8.6855 | 1.1689 | 0.031 |
| Cap | 7.35330.4817 | 3.4260 | 1.1502 | 0.005 |
| HD 204886 | 2.26510.0375 | 7.8308 | 1.3246 | 0.016 |
| HD 205011 | 6.73420.0486 | 6.1636 | 1.1566 | 0.018 |
| HD 211594 | 3.58200.0704 | 7.8269 | 1.2030 | 0.048 |
| HD 219116 | 1.58360.0439 | 9.0319 | 1.1403 | 0.017 |
| CPD 64 4333 | 2.10270.0736 | 9.3313 | 1.2374 | 0.013 |
| Field Red Giants | ||||
| HR 373 | 13.45270.1345 | 5.2376 | 1.1523 | 0.003 |
| HR 1030 | 17.10660.3775 | 3.2567 | 1.1403 | 0.001 |
| HR 1327 | 9.49080.0960 | 5.0182 | 0.9874 | 0.004 |
| HR 1346 | 22.62340.4614 | 3.2900 | 1.2221 | 0.001 |
| HR 1373 | 19.06320.3699 | 3.4155 | 1.1604 | 0.001 |
| HR 1409 | 20.31300.4261 | 3.1587 | 1.2315 | 0.001 |
| HR 1411 | 21.41830.3457 | 3.4931 | 1.1451 | 0.001 |
| HR 2985 | 23.61990.3954 | 3.2379 | 1.1903 | 0.001 |
| HR 3003 | 9.15000.2963 | 4.2185 | 1.7024 | 0.003 |
| HR 3249 | 11.04430.6561 | 2.9266 | 1.6155 | 0.003 |
| HR 3800 | 18.14580.2345 | 4.2327 | 1.0733 | 0.002 |
| HR 4166 | 5.21360.4108 | 4.4153 | 0.9701 | 0.015 |
| HR 4392 | 5.87420.1937 | 4.6768 | 1.1159 | 0.010 |
| HR 4695 | 9.75770.2536 | 4.5190 | 1.3541 | 0.004 |
| HR 4883 | 11.49330.1828 | 4.6729 | 0.8637 | 0.003 |
| HR 5681 | 26.77970.3806 | 3.0531 | 1.2199 | 0.003 |
| HR 5854 | 39.36960.8514 | 2.1248 | 1.3238 | 0.001 |
| HR 5947 | 14.28980.2149 | 3.6599 | 1.4006 | 0.010 |
| HR 5997 | 10.86780.3421 | 4.0135 | 1.0270 | 0.030 |
| HR 6603 | 40.09450.6752 | 2.2781 | 1.9369 | 0.001 |
| HR 7328 | 27.03710.1921 | 3.4397 | 1.1574 | 0.003 |
| HR 7479 | 8.53070.1848 | 4.1175 | 0.9445 | 0.012 |
| HR 7949 | 43.17690.9384 | 2.0227 | 3.1413 | 0.001 |
| HR 8551 | 21.00390.2419 | 4.4191 | 1.2298 | 0.001 |