DCDB Wintermute: Enabling Online and Holistic Operational Data Analytics on HPC Systems
Abstract.
As we approach the exascale era, the size and complexity of HPC systems continues to increase, raising concerns about their manageability and sustainability. For this reason, more and more HPC centers are experimenting with fine-grained monitoring coupled with Operational Data Analytics (ODA) to optimize efficiency and effectiveness of system operations. However, while monitoring is a common reality in HPC, there is no well-stated and comprehensive list of requirements, nor matching frameworks, to support holistic and online ODA. This leads to insular ad-hoc solutions, each addressing only specific aspects of the problem.
In this paper we propose Wintermute, a novel generic framework to enable online ODA on large-scale HPC installations. Its design is based on the results of a literature survey of common operational requirements. We implement Wintermute on top of the holistic DCDB monitoring system, offering a large variety of configuration options to accommodate the varying requirements of ODA applications. Moreover, Wintermute is based on a set of logical abstractions to ease the configuration of models at a large scale and maximize code re-use. We highlight Wintermute’s flexibility through a series of practical case studies, each targeting a different aspect of the management of HPC systems, and then demonstrate the small resource footprint of our implementation.
1. Introduction
The computational requirements of modern scientific research grow steadily, and High-Performance Computing (HPC) systems are designed accordingly with ever-increasing scale and parallelism, taking us to the brink of the exascale era, with systems capable of computing a billion billion operations per second. However, the enormous and intricate complexity of these systems resulting from the adoption of heterogeneous architectures, novel cooling systems, as well as complex management software to support modern applications and workflows, makes both their deployment and production use a challenge. Further, concerns about excessive power consumption (Villa et al., 2014) and high failure rates (Cappello et al., 2014) question their feasibility. To counter these challenges, it will be more important than ever before to treat HPC machines as dynamic, complex systems themselves whose efficiency and effectiveness must be proactively and continuously monitored, analyzed and improved (Babaoglu and Sîrbu, 2018): in other words, the operation of all available resources must be orchestrated at all times in a systematic, holistic and automated manner. This does not only include compute resources, but also memory, network, I/O and infrastructure resources among others.
Analyzing the operation of an HPC system to gain insight into its behavior is the purpose of Operational Data Analytics (ODA), as defined by Bourassa et al. (Bourassa et al., 2019). ODA is driven by the large amounts of data produced by monitoring frameworks, which capture and store data at fine granularity from a large number of sensors in hardware and software components. These sensors are located across the entire HPC facility, from the infrastructure down to the compute node level, and can be used to infer knowledge about system behavior, enabling system control via the implementation of a proactive control loop. If implemented in an online fashion, such a control loop allows to automate the tuning of system knobs that otherwise would be fixed or manually set, allowing for significant improvements in terms of energy efficiency, system reliability and total cost of ownership, among other aspects (Bautista et al., 2019).
Monitoring and ODA are therefore two key aspects in the design of future HPC systems. However, while monitoring is an established reality in most supercomputing centers (Ahlgren et al., 2018), ODA is still far from it: many experimental solutions address individual issues ranging from node resiliency to infrastructure management and energy efficiency, but they are insular and rarely adopted in production. As shown in a survey conducted by the Energy Efficient HPC Working Group, in fact, most HPC sites use ODA in a visualization context, relying on general-purpose frameworks and without automating system control (Bourassa and Ott, 2019). The main reason for this lies in the absence of comprehensive frameworks founded on well-defined requirements, which could then enable the wider adoption of ODA approaches on HPC systems and facilities. Due to the wide variety of needs inherent to specific ODA techniques, a framework of this kind must be designed to cope with the extreme volumes of data associated with monitoring a wide and diverse set of sensors, as well as the tight latency and overhead constraints of real-time system control.
Related Work
The problem of enabling ODA on HPC systems in a generic, holistic way is still an open research question. The Lightweight Distributed Metric Service (LDMS) (Agelastos et al., 2014) has been recently enhanced to support ODA features on top of standard HPC monitoring (Izadpanah et al., 2018). However, due to its pull-based architecture, it is not suitable for in-band, fine-grained ODA applications that require live data with minimal overhead and latency. Moreover, LDMS currently lacks global configuration abstractions to simplify the instantiation of models on large-scale HPC systems.
The Examon (Beneventi et al., 2017) framework is shown to be suitable for ODA applications, being based on the MQTT protocol (Locke, 2010) and thus compatible with out-of-band tools such as Apache Spark. However, this reliance on the use of external tools to process data results in a complex software stack that needs to be tuned ad-hoc for each specific use case, as well as in non-optimal data retrieval performance. The OMNI (Bautista et al., 2019) framework has a similar architecture, but is more oriented towards visualization of data and misses the abstractions necessary for control. The GUIDE (Vazhkudai et al., 2017) framework combines monitoring and ODA features, but it is mostly log-oriented and the semantics of its data analytics features are not clear. Elastic Stack111https://www.elastic.co/products/ supports the post-processing of data ingested from external sources, thus enabling data analytics for monitoring frameworks such as Ganglia (Massie et al., 2004). The analysis, however, is centralized at the server level, which limits scalability for large HPC installations.
Many other tools propose basic applications of ODA specifically tailored for HPC and implement simple feedback loops between the monitoring component and the resource manager (e.g., the Energy-Aware Runtime (EAR) (Corbalan and Brochard, tted) or IBM LoadLeveler (Auweter et al., 2014)). Similarly, tools like SPar (Griebler et al., 2018) provide user-friendly interfaces for runtime tuning. These efforts, however, tackle specific issues of resource management in HPC systems, and customization for other purposes is not trivial. Further, due to the lack of coordination mechanisms, using multiple systems of this kind concurrently to address multiple resources can even be counterproductive. The Global Extensible Open Power Manager (GEOPM) (Eastep et al., 2017) provides a plugin-oriented and extensible interface for resource and power management in HPC systems, but its monitoring capabilities are limited. Alongside the open-source solutions discussed above, there are also many commercial and closed-source products, such as Zenoss222https://www.zenoss.com/ or Splunk333https://www.splunk.com/, offering extensive data analytics capabilities. However, these products are often designed solely for loosely-coupled data center environments and are not suitable for use in HPC centers.
In summary, to the best of our knowledge, there is no generic and comprehensive solution addressing the problem of online ODA on HPC systems, and hence we need a novel approach to tackle ODA on next-generation supercomputers.
Contributions
In this paper we tackle this research gap in the ODA field and present Wintermute, a novel framework to enable online and holistic operational data analytics on HPC systems, capable of processing data and taking decisions at any level of the system. We designed Wintermute following an extensive literature review and requirements analysis, as well as based on previous experiences in single-point ODA solutions at our supercomputing center, which allowed us to identify the main functional and operational requirements for a generalized ODA framework. Wintermute’s workflow accommodates most real-world ODA applications, while at the same time its small resource footprint renders it suitable for applications in which overhead and latency are critical. We implement Wintermute within the Data Center Data Base (DCDB) monitoring system (Netti et al., 2019). Our contributions are the following:
-
•
We propose a taxonomy of ODA techniques for HPC systems based on a literature survey, classify them according to their modes of operation, and extract common requirements.
-
•
We introduce the Wintermute framework, which enables the analysis of data and control at all levels in the hierarchy of an HPC system, and implement it within DCDB.
-
•
We introduce an approach, called the block system, to aid in the instantiation of ODA models on large-scale HPC systems using a tree representation of the sensor space.
-
•
We demonstrate the applicability and scalability of Wintermute through a series of case studies carried out on an HPC system at the Leibniz Supercomputing Center (LRZ).
Organization
The paper is organized as follows. In Section 2 we outline the design requirements for our framework. In Section 3 we describe the architecture of Wintermute, alongside its integration in DCDB in Section 4. In Section 5 we discuss the block system, while in Section 6 we present a series of case studies we implemented. In Section 7 we conclude the paper.
2. Analysis of Requirements
First we present the use case analysis for the design of the Wintermute framework, following a literature survey and extracting common functional and operational requirements.
2.1. Uses of Operational Data Analytics
Even though ODA techniques are emerging for managing many aspects of HPC systems, they have not been systematically classified and typical functional requirements are still not clear, to the best of our knowledge. This, however, is a fundamental prerequisite for the design of a generic framework: for this reason we propose a non-exhaustive taxonomy, depicted in Figure 1, identifying the most common use cases associated with ODA on HPC systems. This list is based on recent and relevant works, and reflects the trends in ODA at most HPC sites, including the experiences at LRZ. In particular, we identify the following main usage scenarios:
- •
- •
-
•
Prediction of Job Features: using heuristic or learning techniques to predict the duration of user jobs and their submission patterns, improving the effectiveness of scheduling policies and reducing queuing times (Galleguillos et al., 2017; Naghshnejad and Singhal, 2018; Matsunaga and Fortes, 2010; Emeras et al., 2015; Ejarque et al., 2010).
-
•
Application Fingerprinting: optimizing management decisions by predicting the behavior of user jobs and correlating this to historical data to characterize features such as power consumption and network usage (Ates et al., 2018; Gallo et al., 2015; Zhang et al., 2012; Wyatt II et al., 2018; McKenna et al., 2016).
-
•
Fault Detection: detecting and predicting anomalous states in hardware and software components to improve the resiliency of HPC systems, preventing in turn unmasked failures and other catastrophic events (Guan and Fu, 2013; Tuncer et al., 2018; Sîrbu and Babaoglu, 2016b; Shaykhislamov and Voevodin, 2018).
- •
2.2. Taxonomy of Operational Data Analytics
The list of use cases above demonstrates that ODA is needed at all levels of an HPC system, as well as at different time scales; all techniques, however, rely directly on monitoring data and some applications, such as those associated with job analysis, may further require additional data (e.g., job id or wall time). Based on our observations, we derive four classes of ODA techniques, according to the type of data they use and their mode of operation. On one hand, we identify two types of data sources:
-
•
In-band: data sampled and consumed within a specific component in an HPC system, usually a compute node. Techniques using such data sources often operate at a fine temporal scale (i.e., greater than 1Hz) and require low analysis overhead and latency in gathering data.
-
•
Out-of-band: data potentially coming from any available source in the system, including historical or asynchronous facility data. In a few cases, job-related data may be used as well. For techniques using this type of data, operation often has to be at coarse scale (e.g., in the order of minutes) and must be explicitly synchronized (e.g., through time-stamps), but latency and overhead are less of a concern.
On the other hand, we group ODA techniques according to the two following modes of operation:
-
•
Online: continuous operation, producing an output resembling a time series, which can then be re-used to drive management decisions and thus produce a feedback loop.
-
•
On-demand: operation triggered at specific times (e.g., job submission) to steer management decisions that require certain information about the system’s status.
Using these characteristics we can classify the use cases presented in Section 2.1 as shown in Figure 1, leading us to a taxonomy, which we use in the following to guide our design of Wintermute.

2.3. Functional Requirements
In light of our taxonomy of ODA techniques, we extract a series of functional and operational requirements that must be taken into account when designing any generic online ODA framework for HPC systems, including our Wintermute framework:
-
•
Holism: an ODA framework must provide a holistic view of an HPC system’s sensor space, exposing available data in the way that is most fitting to the current scenario. An in-band ODA model will benefit from in-memory processing of local sensor data, for optimal latency and overhead. Conversely, an out-of-band model performing coarse-grained analysis may require large amounts of data (e.g., historical) that cannot be maintained within local memory and thus must be fetched from remote storage.
-
•
Flexibility: both online and on-demand operations must be supported to address the necessities of different techniques driven by the various components of an HPC system.
-
•
Scalability: ODA models must be able to scale up to thousands of inputs and very fine time scales. At the same time, an ODA framework must exhibit a light resource footprint, to not interfere with HPC applications when used in-band.
-
•
Abstraction: manual configuration of ODA is prohibitive when a large amount of independent models (e.g., one per CPU core of an HPC system) must be deployed together, both in-band and out-of-band. For this reason, abstraction constructs are necessary to simplify and automate the configuration of ODA models at scale.
-
•
Modularity: as knobs and sensors in HPC systems are often controlled via a set of common and pre-defined protocols (e.g., IPMI or SNMP), an ODA framework must be modular and able to integrate a wide range of external interfaces. Further, as ODA techniques often rely on similar processing steps (e.g., regression), it must allow the pipelining of several analysis and control stages so as to maximize code re-use.
Careful system design is needed to address the requirements above. Most recent efforts in ODA for HPC systems (e.g., Examon (Beneventi et al., 2017)) rely on the use of tools such as Apache Spark or Elastic Stack: these allow for scalability and holism, but not the needed flexibility. Further, the support of in-band models is severely limited, addressing only part of the problem. To overcome these limitations and to address all requirements, we require a tight integration of ODA with the components of an holistic monitoring system specifically targeting HPC: monitoring interacts with most HPC components addressed by ODA naturally, providing efficient and convenient interfaces for control as well as streaming data access.
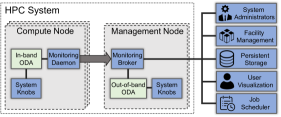
Figure 2 shows how ODA can be implemented within an existing monitoring system: integration with monitoring daemons in compute nodes enables in-band operation, close to where data is sampled, whereas management nodes are used for out-of-band operation. In the latter case, ODA can interact with a monitoring data broker, gaining access to streamed cluster-wide data, as well as remote persistent storage. This approach covers all use cases and requirements laid out in this section.
3. Architecture of Wintermute
Following the design guidelines laid out in Section 2 we introduce Wintermute, a novel ODA framework driven by our requirements analysis. We first provide an overview of Wintermute’s architecture, and then describe in detail the components comprising it.
3.1. Architecture Overview
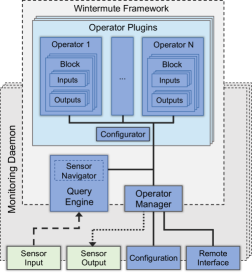
Wintermute provides an ODA framework with generic interfaces and is designed in a way that it can be integrated into any HPC monitoring system as an additional software component. In Figure 3 we show its modular architecture: it is based on operator plugins supplying analysis capabilities, which follow an agnostic code interface and are used to instantiate operators. Operators represent the actual computational entities performing all ODA tasks asynchronously, by relying on a flexible local thread pool. Each operator works on a set of blocks, which are container data structures representing physical components (e.g., compute nodes or racks) or logical entities (e.g., user jobs) in an HPC system: a block has a set of sensors that are used as inputs for the analysis (input sensors), as well as a set of outputs, which store the results of the ODA operation and are, again in the form of sensors, to be consumed by the monitoring system or by other operators (output sensors). In our terminology, a sensor defines an atomic monitoring entity (e.g., power, temperature, CPU counter or ODA output) that captures system information. Each sensor reading is identified by a numerical value (in a unit given by the sensor’s definition) and a time-stamp. We will return to the concept of blocks with greater detail in Section 5.
Operator plugins are supported by two central components, the query engine and the operator manager, which provide input data to operators and expose their output respectively. These are designed to isolate the plugins from the location in which they are instantiated, meaning that a plugin can be deployed to the different locations of a monitoring system (or different monitoring systems altogether) without alterations. The last set of components, depicted at the bottom of Figure 3, belongs to the monitoring system in which Wintermute is integrated: the sensor input and sensor output components describe the interfaces through which Wintermute obtains sensor data and exposes analysis results respectively. The configuration component is responsible for initialization and will grant Wintermute access to its designated configuration files, which are indicated in the global monitoring system’s configuration. The remote interface component, finally, represents the interface exposed by the monitoring daemon, through which Wintermute can in turn expose its remote control and data retrieval features. While a RESTful API is our preferred interface type, Wintermute is not dependent on this choice and can easily be adapted to work with other interface types (e.g., remote shells).
3.2. Components of the Architecture
In the following we describe the core components that compose the Wintermute architecture, as well as their interactions with the surrounding monitoring system.
Operator Manager
The operator manager is the central entity responsible for loading requested Wintermute operator plugins, exposing the associated configuration files to them and managing their life cycle. As such, it is the main interface between Wintermute and the monitoring system and allows users to specify which sensors to read. Additionally, the operator manager acts as a front-end for all remote interface requests (e.g., via a RESTful API), exposing available actions implemented within the framework. For example, these requests can be used to start, stop or load plugins dynamically, as well as trigger specific actions on a per-plugin basis (e.g., training a machine learning model) and retrieve recent sensor data.
Query Engine
The query engine is a singleton component that exposes the space of available sensors to operator plugins. In particular, it gives access to a sensor navigator object, which maintains a tree-like representation of the current sensor space using the block system described in Section 5, allowing Wintermute plugins to discover which sensors are available and where in the hierarchical structure they stand. The query engine’s uniform interface enables queries based on sensor names and time-stamp ranges. Access to low-level sensor data structures is achieved by means of a callback function, which is set at startup by the monitoring entity in which the Wintermute framework is running. Access to job data and other metadata can be enabled by setting similar callback functions.
Operator Plugins
Operator plugins implement the specific logic to perform analysis processes of a certain kind, complying to the Wintermute plugin interface. Operator plugins perform analysis by taking as input sensor data alone. Job operator plugins are an extension of normal operator plugins which can also use job-related data (e.g., user id or node list), producing output associated to a specific job. Plugins consist of the following main internal components:
-
•
Operator: operators are objects performing the required analysis tasks. Each operator has assigned a set of blocks, each referencing a set of input and output sensor objects. Whenever computation is invoked for an operator, it will iterate through its blocks and perform an analysis for each of them, querying the respective input sensors through the query engine, processing the obtained readings, and storing the result in the output sensors. When performing analysis for a certain block, access to the operator’s other blocks is allowed for correlation purposes.
-
•
Configurator: a configurator is responsible for reading a plugin’s own configuration file, exposed by the operator manager, and instantiating operators together with their blocks: the process to generate the latter is controlled by a series of template-based constructs that allow users to easily instantiate a large number of blocks (e.g., one per CPU core in a large-scale HPC cluster), each with their own unique sets of input and output sensors. This mechanism is discussed in detail in Section 5.4, and more resources about the configuration can be found in DCDB Wintermute’s GitLab.
4. Wintermute Integration into DCDB
As discussed in Section 3, Wintermute must be tightly coupled with a corresponding monitoring framework tasked with providing sensor data and allowing transport and storage of results. In our concrete implementation, we integrate Wintermute with the DCDB monitoring framework (Netti et al., 2019), which is used at LRZ: we first briefly describe DCDB, followed by the integration of Wintermute into it, and finally present the resulting workflow and associated options. Like DCDB, Wintermute is implemented in C++11, and all source code is freely available under the GNU GPL license via its GitLab repository444https://dcdb.it. It also includes a series of end-to-end examples, demonstrating the simplicity of Wintermute’s configuration process. Due to the abstract and generic nature of Wintermute’s architecture, our C++11 implementation can be re-used and integrated into any other monitoring system with little effort.
4.1. Architecture of DCDB
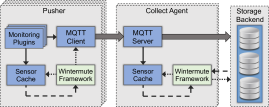
DCDB is a holistic solution for continuous monitoring in HPC systems (Netti et al., 2019). It comprises several components in order to achieve a distributed and scalable architecture, which is summarized in Figure 4: Pushers perform the sampling of sensors on monitored components, using a plugin-based architecture that allows to easily add new data sources. All collected data is sent via the MQTT protocol (Locke, 2010) to Collect Agents, which act as data brokers and forward the data to a Storage Backend, currently implemented using Apache Cassandra. Alongside a series of interfaces for visualizing and retrieving data from Storage Backends, DCDB also exposes a RESTful API for control in every component, as well as sensor caches for fast in-memory access to recent readings.
4.2. Workflow of Wintermute
Wintermute is included in Pushers and Collect Agents as an additional plugin-based software component that enhances them by supplying ODA capabilities, as described in Section 3. Figure 4 shows the integration of Wintermute in the existing DCDB architecture: it has access to all resources in a Pusher or Collect Agent, including sensor caches, RESTful APIs and data output methods (i.e., MQTT or Storage Backend). The arrows directed in and out of the Wintermute components define the inputs and outputs for sensor data in each location. In the following we discuss the resulting available options that allow the configuration of Wintermute’s workflow to accommodate the use cases laid out in Section 2.
Operator Location
As Wintermute is included in Pushers and Collect Agents, operators can be instantiated in both locations by loading the appropriate plugins. In a Collect Agent, access to the entire system’s sensor space is available. If possible, data is retrieved from the local sensor cache or otherwise queried from the Storage Backend, to which the outputs of operators are also written. This location is optimal for system or infrastructure-level analysis and feedback loops. In a Pusher, on the other hand, operators have only access to locally sampled sensors and their sensor cache data. This location is optimal for runtime models requiring data liveness, low latency and horizontal scalability. For example, a regression operator used to predict power consumption for CPU frequency tuning (Ozer et al., 2019) can be deployed in a Pusher so as to leverage in-memory processing for minimal latency.
In both scenarios, the query engine gives higher priority to data in the local sensor caches, which is faster to retrieve compared to querying the Storage Backend. Moreover, queries can be performed in two modes, affecting how the caches are accessed: in the first, relative time-stamps are supplied as an offset against the most recent reading, and the cache view to be returned can be computed in time. In the second, absolute time-stamps are used, resulting in a binary search with time complexity.
Operational Modes
In the native Wintermute implementation, operators can be configured to work in two different ways depending on their requirements. In online mode, an operator is invoked at regular time intervals, resulting in continuous analysis and thus producing time series-like sensor data as its output. This is ideal for applications such as fault detection or runtime tuning. In on-demand mode, on the other hand, an operator’s capabilities must be explicitly invoked via the RESTful API, by querying a specific block. Output data is propagated only as a response to the RESTful request. This mode is ideal for scheduling applications, which can be triggered at arbitrary times. For example, a resource manager could contact an on-demand fault detection operator at scheduling time (Tuncer et al., 2018) to determine the current status of each idle compute node and thus optimize allocation decisions.
Block Management
When using the online mode, the blocks of a single operator can be arranged with respect to the underlying model: as sequential, all blocks share the same operator, and are processed sequentially at each computation interval to avoid race conditions; as parallel, one distinct operator is created for each block, allowing us to parallelize computation and improve scalability. For example, an application fingerprinting operator (Ates et al., 2018) deployed in a Collect Agent with a large number of blocks, one per compute node in an HPC cluster, could make use of the parallel option for optimal ODA performance.
Analysis Pipelines
As the output data produced by online operators shares the same format and is identical to all other sensor data in DCDB, operators can use the output of other operators as input. This, in turn, allows us to create pipelines, in which the multiple stages of a complex analysis are divided among several operators. This can be used to split computational load between multiple locations (e.g., Pusher and Collect Agent) or to achieve complex analyses with few, general-purpose plugins. Furthermore, this method allows us to implement feedback loops in an HPC system, via control operators at the end of a pipeline that use processed data to tune knobs. For example, an operator which estimates the optimal inlet cooling water temperature for an HPC cluster based on sensor data (Conficoni et al., 2015) could feed its predictions to a second operator, devoted to issuing SNMP requests to tune the cooling system.
These options provide effective ways to implement a lightweight and reliable data analytics infrastructure: for example, on-demand operation can be used to minimize overhead and data volume; careful planning of operator pipelines, instead, can reduce redundancy in processing of sensor data, by allowing multiple operators to consume the data produced by a single one.
5. The Block System
With more and more data sources to tap into, navigating the space of available sensors in a monitored HPC system and configuring ODA models at scale becomes difficult and error-prone (Giménez et al., 2017). This calls for a structured sensor specification system with the following requirements: a) it must simplify the navigation of large sensor spaces, with millions of entries; b) it must allow to derive the hierarchical relationships existing between sensors; c) it must provide template-like constructs to simplify sensor specifications for ODA models. Here, we introduce the set of abstractions we implemented in Wintermute to address these issues.
5.1. The Sensor Tree
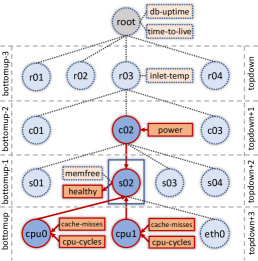
In Wintermute we model the sensor space as a hierarchical sensor tree, an example of which is depicted in Figure 5. We assume that the keys (or topics, similarly to the MQTT standard) used to identify sensors are forward slash-separated strings similar to file system paths, expressing their physical or logical placement in an HPC system. The following is an example of a sensor topic:
The last segment of a topic is the name of the sensor itself, and the preceding path elements express its placement in the system. This representation can be exploited to construct a tree, in which each internal node is a system component (e.g., a compute node or a rack) and each leaf is a sensor. The constructed tree then supplies a comprehensive view of the monitored system’s structure, as well as a natural way to correlate hierarchically-related sensors (e.g., the sensors of a compute node and those of the rack it belongs to).
The structure of the sensor tree is analogous to a file system: components of the HPC system represented by internal tree nodes can be seen as directories whereas the sensors themselves corresponding to leaves are akin to files. This approach has been already employed in efforts such as Perftrack (Knapp et al., 2007), proving its effectiveness. Here, we extend it for the purpose of ODA model configuration.
The effectiveness of this representation depends on the level of detail expressed by the hierarchy of topics, and the responsibility for devising such a hierarchy lies on system administrators and designers. Some HPC centers might also employ monitoring systems with naming conventions different from the file system-like one we discuss here. This is taken into account in our implementation, which is not dependent on a specific naming scheme, but also supports the definition of arbitrary hierarchy schemes supplied as lists of regular expressions each identifying a separate tree level.
5.2. Blocks and Block Templates
In Wintermute, blocks are data structures that act as atomic containers on which analysis computations are performed. A block represents directly a node in the sensor tree, from which it takes its name. Then, a block references a set of input and output sensor topics: the output sensors are used to deliver analysis results, and are leaves of the node the block represents. Input sensors, which provide the data for the analysis, can either be leaves of that same node, or belong to any other node in the sensor tree connected by an ascending or descending path to it. Figure 5 shows a generic example for a block, named s02, a compute node in an HPC system. In this example, the block has the output sensor healthy, and a series of input sensors: the cycles and cache misses counters of the CPUs in the compute node, plus the power sensor of the chassis it belongs to. Combined with its input and output sensors, a block corresponds to a sub-tree in the sensor tree.
While blocks can be defined by specifying actual sensor topics as inputs and outputs, they may also be defined in a generic way via templates: here, sensors are referenced via their position in the sensor tree, expressing only their last topic segment and omitting the components to which they belong (preceding topic path), which are replaced by a tree level (vertical navigation) and a filter (horizontal navigation). The set of sensor topics matched by a sensor expression is its domain in the tree. Further, a particular block can be instantiated from a template by specifying a node in the sensor tree (i.e., its name), thus creating a binding: each sensor expression is then replaced with a sensor topic from its domain that is hierarchically-related to the block’s node. Since multiple topics may satisfy this, one expression can produce multiple actual topics. Conversely, if no topic satisfies it, the block cannot be built.
Recalling the similarity between the sensor tree and a file system, describing sensors through sensor expressions can be interpreted as defining files using relative paths: these paths can match multiple points in the file system, and they are fully resolved in function of the current working directory, whose analogous in this case is the name of the block. The main difference between the two is that the tree level of sensors in sensor expressions is defined with an absolute level, whereas for relative file system paths it is defined as a relative offset with respect to the current working directory.
5.3. Template Instantiation
The example block shown in Figure 5 can be built from a generic template using the following sensor expressions:
In sensor expressions, the topdown and bottomup keywords drive the vertical navigation and indicate the highest and lowest level in the tree, respectively; the root node of the sensor tree is excluded from this representation, and other levels can be reached through relative offsets. The filter keyword defines the horizontal navigation and is used to filter the set of topics that the expression matches, within its tree level. In this example, the block’s name is set to /r03/c02/s02/, which identifies an HPC compute node. Once this is set, the rest of the block is resolved: the power expression is resolved as /r03/c02/power, since it specifies that the sensor should be one level below the highest tree level, at c02. Conversely, the cpu-cycles and cache-misses expressions are on the lowest level, with two nodes (cpu0 and cpu1) belonging to their domains. As such, sensors from both of them are added to the block. As the healthy output sensor expression lies at the same level as s02, it is simply resolved as /r03/c02/s02/healthy.
5.4. Configuring Blocks in Wintermute
Templates are used in Wintermute’s plugin configurators to instantiate the blocks operators work on, as explained in Section 3.2. In detail, the block generation process works in the following steps, starting from a block template defined in a configuration file:
-
(1)
based on the current sensor tree, the set of topics matching the output sensors’ expressions (their domain) is computed;
-
(2)
one block is created for each retrieved node in the domain;
-
(3)
for each block, its set of input and output sensors is resolved according to the domains of the respective expressions.
On top of block-level outputs, users may also define a set of operator-level outputs that can, for example, store the average error of a model applied to a set of blocks. Recalling the example of template in Section 5.3, applying the configuration algorithm described above will result in as many blocks as compute nodes in the HPC system (e.g., /r03/c02/s[01-04]/). This demonstrates how the block system enables instantiation of thousands of independent ODA models in a large-scale HPC system, each with its own set of sensors, by using only a small configuration file. Moreover, configurations are independent from the location to which a model is deployed (e.g., Pusher or Collect Agent), as the blocks are resolved automatically from the available sensor tree. It should be noted, however, that a block template is not guaranteed to be portable across HPC systems with different sensor hierarchies. For example, if we wanted to port the template in Section 5.3 to a system whose hierarchy has an additional level close to the root of the tree, with block names such as /i01/r03/c02/s02/, the expression ¡topdown+1¿power must become ¡topdown+2¿power.
6. Case Studies
In this section we present several case studies showing the capabilities of Wintermute, alongside an analysis of the required resources and overheads. These case studies were not chosen for their novelty and represent (on purpose) typical ODA techniques in the literature, so as to show Wintermute’s flexibility and suitability for large-scale HPC installations: without a framework such as Wintermute, carrying out these case studies would be difficult and would require the development of a substantial amount of dedicated, non-reusable code to retrieve sensor data, place and control the analysis and to expose its output. All experiments described in this section were carried out on the CooLMUC-3 system at LRZ 555https://doku.lrz.de/display/PUBLIC/CoolMUC-3. This cluster is composed of 148 compute nodes, each equipped with a 64-cores Intel Xeon Phi 7210-F Knights Landing CPU, 96GB of RAM and an Intel Omni Path Architecture (OPA) interconnect. DCDB runs continuously on this system in production, with Pushers in compute nodes sampling data from the Perfevent, SysFS, ProcFS and OPA plugins and with a single Collect Agent forwarding the data to a dedicated Storage Backend.
6.1. Power Consumption Prediction
The first study shows the use of Wintermute for predicting the power consumption of a compute node (precisely, overall node power measured at the power supply) in CooLMUC-3, which can be used to steer online control decisions in the power and runtime systems. An example of this is DVFS CPU frequency tuning, which can be exploited in an automated way to save significant amounts of energy without sacrificing application performance. In this scenario data is collected in-band, at a fine time scale, and is immediately re-used for control purposes. The model represents an online implementation of the one proposed by Ozer et al. (Ozer et al., 2019).
6.1.1. Configuration
In a Pusher, we instantiate a single operator from a plugin, called Regressor, which implements a generic random forest-based online regression model. Its input data consists of a set of performance metrics and sensors, and both sampling and regression operate at a 250ms interval. The plugin, which is based on the OpenCV library666https://opencv.org, works in the following way: at each computation interval, for each input sensor of a certain block, a series of statistical features (e.g., mean or standard deviation) are computed from its recent readings. These features are then combined to form a feature vector, which is fed into the random forest model to perform regression and output a sensor prediction for the next 250ms. The training of the model, which is shared by all blocks of an operator, is performed automatically: feature vectors are accumulated in memory until a certain training set size is reached, alongside the responses from the sensor to be predicted. In this case, the responses come from the power sensor, with the model set to predict its value in the next 250ms. With the Pusher running, we execute the Kripke, AMG, Nekbone and LAMMPS proxy HPC applications from the CORAL-2777https://asc.llnl.gov/coral-2-benchmarks suite, with as many threads as physical cores, while the regression operator builds its training set. Here the operator has only one block, corresponding to the compute node, and the training set size is set to 30,000. Once training is complete, we evaluate the regression with new DCDB data.
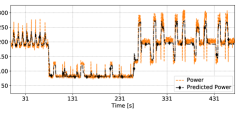
6.1.2. Results
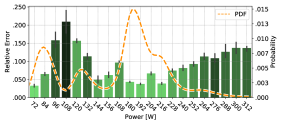
Figure 6 summarizes the results of the model. It shows a small excerpt from the time series of the real and predicted power sensors: we see that the time series of the predicted power consumption follows the measured time series closely, capturing status changes and periodic behaviors before they occur. However, the predicted time series fails to capture some short spikes or oscillations in power consumption, and presents itself like a smoothed version of the measured one. These events are difficult to predict, as they are usually related to the CPU’s power management policy, which may exhibit short-term spikes for throughput improvement (e.g., Turbo mode on Intel CPUs) or may be related to electrical or sensor noise. The phenomena described above are even more apparent in Figure 6b, which shows the average relative prediction error for each real power band, together with the fitted probability density function (PDF) of the latter. It can be seen that prediction is worse for higher power values; as it can be observed from the PDF, these values represent a minimal portion of the distribution, and have negligible impact on the overall error. Moreover, this imbalance in the distribution translates directly to an imbalance in the training set of the model, which does not have enough data to capture this type of behavior. Similarly, some low-power states that are relatively rare are not predicted well by the model. However, in the regions of the distribution where most of the data concentrates, error is always close to 5%, proving the model’s effectiveness.
We obtained comparable average relative error values when sampling and predicting power consumption at a time interval of 125ms (10.4%) and 500ms (6.7%). In the work by Ozer et al. (Ozer et al., 2019), the offline validation of this approach shows comparable results to the ones presented here, proving its generality. While specialized techniques such as PRACTISE (Xue et al., 2015) could yield more accurate prediction, this example shows that very good results can be obtained with general-purpose plugins, and with little effort.
6.2. Analysis of Job Behavior
In the second case study, we use Wintermute to produce aggregated performance metrics on a per-job basis, which can be visualized to gain insight about application behavior. We combine two different plugins, showing how pipelines can be used in Wintermute to perform complex analyses and split computational load. The plugins discussed here represent a re-implementation of the PerSyst framework (Guillen et al., 2014): their purpose is to enable online visualization of job performance data for HPC users, allowing them to quickly adapt configurations and spot issues. Because of its online and user-oriented nature, this approach differs from others like the roofline model (Williams et al., 2009), which are more suited for offline analysis.
6.2.1. Configuration
We deploy two distinct operator plugins, implementing a pipeline as described in Section 4. The first Perfmetrics plugin, instantiated in the Pushers, takes as input CPU and node-level data and computes as output a series of derived performance metrics, such as the cycles per instruction (CPI), floating point operations per second (FLOPS) or vectorization ratio, which are useful to evaluate application performance. A second Persyst job operator plugin is instantiated in the main Collect Agent: at each computing interval, it queries the set of running jobs on the HPC system, and for each of them it instantiates a block according to its configuration. In this case, blocks have as input one of the Perfmetrics derived metrics from all compute nodes on which the job is running. From these, the operator computes a series of job-level statistical indicators (e.g., median) as output. In the Pushers and Collect Agent, sampling and computation are performed at 1s intervals.
We executed four jobs, each on 32 CooLMUC-3 nodes and running the Kripke, AMG, Nekbone and LAMMPS proxy applications. The job runs were repeated multiple times and under different node configurations to ensure consistency. Here we focus on the CPI metric: thus, we configured the Perfmetrics plugin to have an operator with one block per CPU core, each producing as output its CPI value. Then, we use a Persyst operator, which outputs the deciles of the job-level CPI distribution at each time point, as computed by aggregating the corresponding input values for each job. Since the latter are computed per-core, each decile is aggregated from 2048 samples at a time. This allows us to gain an overall understanding of the behavior of the applications running on the HPC system, whereas the full extent of available metrics allows us to characterize their performance profile and bottlenecks.
6.2.2. Results
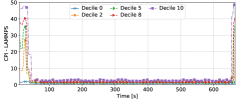
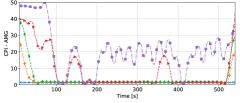
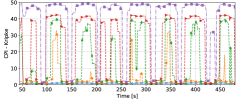
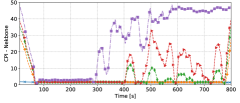
Figure 7 shows the results of our analysis: for each job, we show the time series for deciles 0, 2, 5, 8 and 10 of the aggregated per-core CPI values while running the corresponding Coral-2 codes; deciles 0, 5 and 10 correspond to the minimum, median and maximum CPI values respectively. It can be seen that the applications exhibit distinctly different behaviors depending on the underlying computational workload: LAMMPS shows low CPI values averaging at 1.6, with minimum spread in the distribution, which is due to its mostly compute-bound nature. A similar behavior can be observed with AMG, with low CPI values up to decile 5: however, deciles 8 and 10 show spikes up to CPI values of 30. As AMG is a network and memory-bound application based on fine-grained synchronization, this behavior could be caused by network latency affecting I/O, as well as load imbalance.
Kripke has a very distinctive profile: it is possible to separate each single iteration thanks to the increase and decrease in CPI values across all deciles. Similarly to AMG, Kripke is also a network and memory-bound application, and is thus characterized by relatively high CPI values. Finally, Nekbone shows the most interesting behavior: low CPI values can be observed in the first part of the application run, which is expected as Nekbone is a compute-bound application. In the second part of the run, however, the spread across deciles increases dramatically, with at least 20% of the CPUs exhibiting higher CPI values. Our hypothesis is that, as Nekbone performs a batch of tests on increasing problem sizes, the application becomes memory-limited as soon as it grows past the 16GB-High-Bandwidth Memory available in CooLMUC-3 nodes. This is a typical example of how visualization of performance metrics can be used to spot bottlenecks in HPC applications.
6.3. Identification of Performance Anomalies
For the final case study, we conduct a long-term analysis on coarse-grained monitoring data from all compute nodes in CooLMUC-3. By applying unsupervised learning techniques, we characterize the performance of the entire HPC system and highlight variance between compute nodes, as well as identify outliers and anomalous behaviors: this can be used to automatically raise alerts to system administrators or to improve resource allocation decisions.
6.3.1. Configuration
We use a single Clustering plugin employing Bayesian Gaussian mixture models in the main Collect Agent. This plugin is configured to have one operator with as many blocks as compute nodes, each having as input a node’s power, temperature and CPU idle time sensors, and as output a label of the cluster to which it belongs. More precisely, at every computation interval the operator computes 2-week averages for the input sensors of each block. Then, each block is treated as a data point in a three-dimensional space, and clustering is applied to them. Sampling in Pushers is performed every 10s and clustering every hour.
We adopt a Bayesian Gaussian mixture model because, unlike ordinary Gaussian mixture models, they are able to determine the optimal number of clusters from data (Roberts et al., 1998). This is useful in an online, continuous scenario, where the diverse states of an HPC system can be captured without manual tuning of the model’s parameters. The number of input sensors to the clustering algorithm (and thus the number of dimensions) can be changed at will in the plugin’s configuration, as well as the length of the averages’ aggregation window. Since the job runtime limit is set to 2 days on CooLMUC-3, we choose a value of 2 weeks to extract the performance profile of each node without knowledge of running jobs.
6.3.2. Results
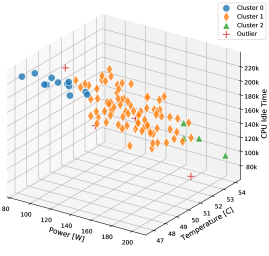
Figure 8 shows the result of the clustering process for a single time window. The points in the scatter plot correspond to compute nodes in CooLMUC-3, whose coordinates are their 2-week power, temperature and CPU idle time averages. First, it can be observed that the three metrics are strongly correlated, and the compute nodes describe a clear linear trend: this is expected, as a compute node will consume less power if idling, and its temperature will be lower as well. Most nodes concentrate in cluster 1 towards the center of the plot, with relatively little spread.
Despite the 2-week aggregation window we adopted, some stark differences in node behavior can still be observed: compute nodes belonging to cluster 0 have a higher CPU idle time, showing low power and temperature values accordingly. Conversely, nodes in cluster 2 were under heavier load compared to other nodes, peaking at 200W of average power consumption for a single node. While this behavior could simply be due to specific sequences of applications running on the nodes, it is more likely the symptom of a job scheduling policy that does not account for workload balance between nodes. A few points were classified as outliers when their probability was lower than a certain threshold (0.001 in our case) in the PDFs of all fitted Gaussian components, and the behavior of the corresponding nodes diverges significantly from the rest of the system. One node in particular shows a concerning trend, consuming roughly 20% more power than other nodes with similar CPU idle time. We are currently investigating this anomaly, and plan to conduct a long-term root cause study. As shown, this type of analysis is very effective at supplying a comprehensive view of an HPC system’s behavior, and can be useful to system administrators and researchers alike. Similarly, this can also be used to improve scheduling policies by considering recent node behavior.
6.4. Performance and Scalability
While the previous sections validate Wintermute’s ability to run arbitrary ODA tasks, we now focus on the evaluation of Wintermute itself. The performance of DCDB was extensively characterized in a previous work (Netti et al., 2019) both on small-scale and large-scale clusters, and its overhead was found to be negligible (below 1% for most configurations). We assume Wintermute to exhibit the same scaling patterns as DCDB and hence, here we will focus on characterizing Wintermute’s query engine component alone.
6.4.1. Configuration
We study the performance impact of a Pusher on the High-Performance Linpack (HPL) benchmark (Dongarra et al., 2003). In this context we use the runtime overhead, computed as the percentage increase in execution time of HPL with a Pusher active, as opposed to running it alone. Execution times are calculated via the date Linux command, and we instantiate a set of operators in online mode: these belong to a Querytest plugin and simply perform a certain number of queries over the input sensors of their blocks. The input monitoring data is provided by another Tester plugin, producing a total of 1,000 monotonic sensors with negligible overhead, so as to provide a reliable baseline. All plugins use a sampling interval of 1s and a cache size of 180s. The HPL benchmark was configured to use as many threads as physical cores on a single node, and each experiment was repeated 10 times, picking median results to ensure statistical significance and remove outliers.
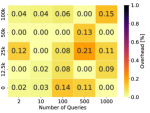
6.4.2. Performance Evaluation
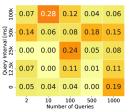
Figure 9 presents the results of our performance evaluation. The two heatmaps depict overhead values when varying the number of queries performed at each analysis interval, as well as the temporal range of each query, using the query engine in absolute and relative mode, respectively. Overhead is below 0.5% in all cases, with absolute mode performing slightly worse than relative and showing higher peak overhead values: this is expected, as absolute mode employs binary search and has a higher computational complexity. Further, no clear trend can be observed when increasing the amount of queried sensor data, showing that the query engine has good scalability and minimal impact on overhead. The heatmaps are considerably noisy, likely indicating that OS noise and application variability have a larger impact on observed overhead than Wintermute. Average per-core CPU load of the Pusher is mostly uniform and peaks at 1.2%. Likewise, memory usage never exceeds 25MB.
The resource footprint of Wintermute might be different when taking into account instantiated models and the characteristics of a production deployment. As a practical example, we measured the overhead of Wintermute when carrying out the case study in Section 6.1, which focuses on fine-grained power consumption prediction, using the same approach discussed here. We observed that the additional overhead of performing regression on top of standard monitoring was below 0.1% and thus negligible, showing once again the light resource footprint of Wintermute. Similar results were obtained for the case study in Section 6.2, in which Wintermute computes derived performance metrics in-band. Here, we found the additional overhead of Wintermute to be always lower than 0.5% for both the HPL benchmark and the Coral-2 applications executed on 32 nodes. In this case, the overhead increases mainly due to network interference associated with the high number of sensors, as performance metrics are computed on a per-CPU core basis. On the other hand, the case study in Section 6.3 was executed out-of-band, and therefore overhead measurements are not applicable to it. We also omit quantitative comparisons with other tools: as discussed in Section 1, the insular and diverse nature of existing ODA solutions renders tool comparability difficult, which is hence possible only from a qualitative standpoint.
7. Conclusions
In this paper we have presented Wintermute, a framework for enabling online and holistic ODA on HPC systems, with the core objective of simplifying the instantiation of complex models for system management. Its design was conceived after an extensive literature review and requirements analysis. As a consequence, Wintermute is generic and can be applied to most HPC monitoring solutions: in this work, we present our implementation and integration in the DCDB monitoring system, which is employed in our production environment. Furthermore, we adopt a novel set of logical abstractions, denoted as the block system, to partition the space of available sensors and simplify model configurations. We show that our implementation of Wintermute has a small resource footprint, making it suitable for applications in which latency and overhead are critical. We then present a series of case studies in the fields of runtime tuning, job analysis and performance variation: this highlights how Wintermute can be easily and effectively applied to many usage scenarios, on the same system, that would be otherwise difficult to implement. Wintermute is currently deployed to perform sensor aggregation in the CooLMUC-3 and SuperMUC-NG888https://doku.lrz.de/display/PUBLIC/SuperMUC-NG systems at LRZ. As future work, we plan to identify additional production use cases, as well as explore solutions to simplify the management of operators and ensure high availability.
Acknowledgements. This research activity has received funding from the DEEP-EST project under the EU H2020-FETHPC-01-2016 Programme grant agreement n° 754304.
References
- (1)
- Agelastos et al. (2014) Anthony Agelastos, Benjamin Allan, Jim Brandt, Paul Cassella, et al. 2014. The lightweight distributed metric service: a scalable infrastructure for continuous monitoring of large scale computing systems and applications. In Proc. of SC 2014. IEEE, 154–165.
- Ahlgren et al. (2018) Ville Ahlgren, Stefan Andersson, Jim Brandt, Nicholas Cardo, et al. 2018. Large-Scale System Monitoring Experiences and Recommendations. In Proc. of CLUSTER 2018. IEEE, 532–542.
- Ates et al. (2018) Emre Ates, Ozan Tuncer, Ata Turk, Vitus J. Leung, et al. 2018. Taxonomist: Application Detection Through Rich Monitoring Data. In Proc. of Euro-Par 2018. Springer.
- Auweter et al. (2014) Axel Auweter, Arndt Bode, Matthias Brehm, Luigi Brochard, et al. 2014. A case study of energy aware scheduling on SuperMUC. In Proc. of ISC 2014. Springer, 394–409.
- Babaoglu and Sîrbu (2018) Ozalp Babaoglu and Alina Sîrbu. 2018. Cognified Distributed Computing. In Proc. of ICDCS 2018. IEEE, 1180–1191.
- Bash and Forman (2007) Cullen Bash and George Forman. 2007. Cool Job Allocation: Measuring the Power Savings of Placing Jobs at Cooling-Efficient Locations in the Data Center.. In Proc. of USENIX 2007, Vol. 138. 140.
- Bautista et al. (2019) Elizabeth Bautista, Melissa Romanus, Thomas Davis, Cary Whitney, et al. 2019. Collecting, Monitoring, and Analyzing Facility and Systems Data at the National Energy Research Scientific Computing Center. In Proc. of the ICPP 2019 Workshops. ACM, 10.
- Beneventi et al. (2017) Francesco Beneventi, Andrea Bartolini, Carlo Cavazzoni, and Luca Benini. 2017. Continuous learning of HPC infrastructure models using big data analytics and in-memory processing tools. In Proc. of DATE 2017. IEEE, 1038–1043.
- Bourassa et al. (2019) Norman Bourassa, Walker Johnson, Jeff Broughton, Deirdre McShane Carter, et al. 2019. Operational Data Analytics: Optimizing the National Energy Research Scientific Computing Center Cooling Systems. In Proc. of the ICPP 2019 Workshops. ACM, 5:1–5:7.
- Bourassa and Ott (2019) Norman Bourassa and Michael Ott. 2019. EEHPCWG Operational Data Analytics Survey. https://eehpcwg.llnl.gov/assets/sc19_11_425_525_operational_data_analytics_ott_bourassa.pdf
- Cappello et al. (2014) Franck Cappello, Al Geist, William Gropp, Sanjay Kale, et al. 2014. Toward exascale resilience: 2014 update. Supercomputing frontiers and innovations 1, 1 (2014), 5–28.
- Conficoni et al. (2015) Christian Conficoni, Andrea Bartolini, Andrea Tilli, Giampietro Tecchiolli, et al. 2015. Energy-aware cooling for hot-water cooled supercomputers. In Proc. of DATE 2015. IEEE, 1353–1358.
- Corbalan and Brochard (tted) Julita Corbalan and Luigi Brochard. submitted. EAR: Energy management framework for supercomputers. In Proc. of IPDPS 2018. IEEE.
- Dongarra et al. (2003) Jack J Dongarra, Piotr Luszczek, and Antoine Petitet. 2003. The LINPACK benchmark: past, present and future. Concurrency and Computation: practice and experience 15, 9 (2003), 803–820.
- Eastep et al. (2017) Jonathan Eastep, Steve Sylvester, Christopher Cantalupo, Brad Geltz, et al. 2017. Global extensible open power manager: A vehicle for HPC community collaboration on co-designed energy management solutions. In Proc. of ISC 2017. Springer, 394–412.
- Ejarque et al. (2010) Jorge Ejarque, Andras Micsik, Raul Sirvent, Peter Pallinger, et al. 2010. Semantic resource allocation with historical data based predictions. In Proc. of CLOUD 2010. IARIA.
- Emeras et al. (2015) Joseph Emeras, Sébastien Varrette, Mateusz Guzek, and Pascal Bouvry. 2015. Evalix: Classification and Prediction of Job Resource Consumption on HPC Platforms. In Proc. of JSSPP 2015. Springer, 102–122.
- Galleguillos et al. (2017) Cristian Galleguillos, Alina Sîrbu, Zeynep Kiziltan, Ozalp Babaoglu, et al. 2017. Data-driven job dispatching in HPC systems. In Proc. of MOD 2017. Springer, 449–461.
- Gallo et al. (2015) Steven M Gallo, Joseph P White, Robert L DeLeon, Thomas R Furlani, et al. 2015. Analysis of XDMoD/SUPReMM Data Using Machine Learning Techniques. In Proc. of CLUSTER 2015. IEEE, 642–649.
- Giménez et al. (2017) Alfredo Giménez, Todd Gamblin, Abhinav Bhatele, Chad Wood, et al. 2017. ScrubJay: deriving knowledge from the disarray of HPC performance data. In Proc. of SC 2017. ACM, 35.
- Grant et al. (2015) Ryan E Grant, Kevin T Pedretti, and Ann Gentile. 2015. Overtime: A tool for analyzing performance variation due to network interference. In Proc. of the Exascale MPI Workshop 2015. ACM, 4.
- Griebler et al. (2018) Dalvan Griebler, Daniele De Sensi, Adriano Vogel, Marco Danelutto, et al. 2018. Service Level Objectives via C++11 Attributes. In Proc. of REPARA Workshop 2018. Springer.
- Guan and Fu (2013) Qiang Guan and Song Fu. 2013. Adaptive anomaly identification by exploring metric subspace in cloud computing infrastructures. In Proc. of SRDS 2013. IEEE, 205–214.
- Guillen et al. (2014) Carla Guillen, Wolfram Hesse, and Matthias Brehm. 2014. The PerSyst Monitoring Tool - A Transport System for Performance Data Using Quantiles. In Proc. of the Euro-Par 2014 Workshops. Springer, 363–374.
- Imes et al. (2018) Connor Imes, Steven Hofmeyr, and Henry Hoffmann. 2018. Energy-efficient Application Resource Scheduling using Machine Learning Classifiers. In Proc. of ICPP 2018. ACM, 45.
- Izadpanah et al. (2018) Ramin Izadpanah, Nichamon Naksinehaboon, Jim Brandt, Ann Gentile, et al. 2018. Integrating Low-latency Analysis into HPC System Monitoring. In Proc. of ICPP 2018. ACM, 5.
- Jha et al. (2018) Saurabh Jha, Jim Brandt, Ann Gentile, Zbigniew Kalbarczyk, et al. 2018. Characterizing Supercomputer Traffic Networks Through Link-Level Analysis. In Proc. of CLUSTER 2018. IEEE, 562–570.
- Jiang et al. (2019) Weixiang Jiang, Ziyang Jia, Sirui Feng, Fangming Liu, et al. 2019. Fine-grained Warm Water Cooling for Improving Datacenter Economy. In Proc. of ISCA 2019. ACM, 474–486.
- Knapp et al. (2007) Rashawn L Knapp, Kathryn Mohror, Aaron Amauba, Karen L Karavanic, et al. 2007. PerfTrack: Scalable application performance diagnosis for linux clusters. In Proc. of LCI 2007. Citeseer, 15–17.
- Lin et al. (2016) X. Lin, Y. Wang, and M. Pedram. 2016. A Reinforcement Learning-Based Power Management Framework for Green Computing Data Centers. In Proc. of IC2E 2016. IEEE, 135–138.
- Locke (2010) Dave Locke. 2010. Mq telemetry transport (mqtt) v3. 1 protocol specification. IBM developerWorks Technical Library (2010), 15.
- Massie et al. (2004) Matthew L Massie, Brent N Chun, and David E Culler. 2004. The ganglia distributed monitoring system: design, implementation, and experience. Parallel Comput. 30, 7 (2004), 817–840.
- Matsunaga and Fortes (2010) Andréa Matsunaga and José AB Fortes. 2010. On the use of machine learning to predict the time and resources consumed by applications. In Proc. of CCGrid 2010. IEEE, 495–504.
- McKenna et al. (2016) Ryan McKenna, Stephen Herbein, Adam Moody, Todd Gamblin, et al. 2016. Machine learning predictions of runtime and IO traffic on high-end clusters. In Proc. of CLUSTER 2016. IEEE, 255–258.
- Naghshnejad and Singhal (2018) Mina Naghshnejad and Mukesh Singhal. 2018. Adaptive Online Runtime Prediction to Improve HPC Applications Latency in Cloud. In Proc. of CLOUD 2018. IEEE, 762–769.
- Netti et al. (2019) Alessio Netti, Micha Mueller, Axel Auweter, Carla Guillen, et al. 2019. From Facility to Application Sensor Data: Modular, Continuous and Holistic Monitoring with DCDB. In Proc. of SC 2019. ACM.
- Ozer et al. (2019) Gence Ozer, Sarthak Garg, Neda Davoudi, Gabrielle Poerwawinata, et al. 2019. Towards a Predictive Energy Model for HPC Runtime Systems Using Supervised Learning. In Proc. of PMACS Workshop 2019. Springer.
- Roberts et al. (1998) Stephen J Roberts, Dirk Husmeier, Iead Rezek, and William Penny. 1998. Bayesian approaches to Gaussian mixture modeling. IEEE Transactions on Pattern Analysis and Machine Intelligence 20, 11 (1998), 1133–1142.
- Shaykhislamov and Voevodin (2018) Denis Shaykhislamov and Vadim Voevodin. 2018. An approach for dynamic detection of inefficient supercomputer applications. Procedia Computer Science 136 (2018), 35–43.
- Sîrbu and Babaoglu (2016a) Alina Sîrbu and Ozalp Babaoglu. 2016a. Power consumption modeling and prediction in a hybrid CPU-GPU-MIC supercomputer. In Proc. of Euro-Par 2016. Springer, 117–130.
- Sîrbu and Babaoglu (2016b) Alina Sîrbu and Ozalp Babaoglu. 2016b. Towards operator-less data centers through data-driven, predictive, proactive autonomics. Cluster Computing 19, 2 (2016), 865–878.
- Tuncer et al. (2018) Ozan Tuncer, Emre Ates, Yijia Zhang, Ata Turk, et al. 2018. Online Diagnosis of Performance Variation in HPC Systems Using Machine Learning. IEEE Transactions on Parallel and Distributed Systems (2018).
- Vazhkudai et al. (2017) Sudharshan S Vazhkudai, Ross Miller, Devesh Tiwari, Christopher Zimmer, et al. 2017. GUIDE: a scalable information directory service to collect, federate, and analyze logs for operational insights into a leadership HPC facility. In Proc. of SC 2017. 1–12.
- Verma et al. (2008) Akshat Verma, Puneet Ahuja, and Anindya Neogi. 2008. Power-aware dynamic placement of hpc applications. In Proc. of ICS 2008. ACM, 175–184.
- Villa et al. (2014) Oreste Villa, Daniel R Johnson, Mike Oconnor, Evgeny Bolotin, et al. 2014. Scaling the power wall: a path to exascale. In Proc. of SC 2014. IEEE, 830–841.
- Wang et al. (2017) Z. Wang, Z. Tian, J. Xu, R. K. V. Maeda, et al. 2017. Modular Reinforcement Learning for Self-Adaptive Energy Efficiency Optimization in Multicore System. In Proc. of ASP-DAC 2017. IEEE, 684–689.
- Williams et al. (2009) Samuel Williams, Andrew Waterman, and David Patterson. 2009. Roofline: an insightful visual performance model for multicore architectures. Commun. ACM 52, 4 (2009), 65–76.
- Wyatt II et al. (2018) Michael R Wyatt II, Stephen Herbein, Todd Gamblin, Adam Moody, et al. 2018. PRIONN: Predicting Runtime and IO using Neural Networks. In Proc. of ICPP 2018. ACM, 46.
- Xue et al. (2015) Ji Xue, Feng Yan, Robert Birke, Lydia Y Chen, et al. 2015. PRACTISE: Robust prediction of data center time series. In Proc. of CNSM 2015. IEEE, 126–134.
- Zhang et al. (2012) Hao Zhang, Haihang You, Bilel Hadri, and Mark Fahey. 2012. HPC usage behavior analysis and performance estimation with machine learning techniques. In Proc. of PDPTA 2012. 1.