Towards Shape-based Knee Osteoarthritis Classification using
Graph Convolutional Networks
Abstract
We present a transductive learning approach for morphometric osteophyte grading based on geometric deep learning. We formulate the grading task as semi-supervised node classification problem on a graph embedded in shape space. To account for the high-dimensionality and non-Euclidean structure of shape space we employ a combination of an intrinsic dimension reduction together with a graph convolutional neural network. We demonstrate the performance of our derived classifier in comparisons to an alternative extrinsic approach.
Index Terms— Geometric deep learning, computer-aided diagnosis, shape analysis, non-Euclidean statistics
1 Introduction
Osteoarthritis (OA) is a joint disease associated with defective integrity of articular cartilage and related changes in the underlying bone and at the joint margins. With over 250 million people affected world wide, OA ranks globally among the 50 most common sequelae of diseases and injuries [1]. Of the global disease burden, over 80% involve the tibiofemoral joint of the knee.
In clinical practice plain radiography remains a mainstay for the diagnosis of OA with the Kellgren-Lawrence (KL) grading system [2] being the de-facto standard classification scheme.
However, radiographic approaches suffer from several disadvantages:
First, although the evaluation of anatomic changes is an inherently three-dimensional problem, the radiographs only provide two-dimensional projections. Second, cartilage degeneration is only visible indirectly in terms of joint-space narrowing and bony changes requiring highly experienced practitioners.
The overall socio-economic burden associated with OA provides a strong impetus to develop novel computer-aided diagnostics that provide objective tools to support clinical decision-making.
Automatic knee OA diagnosis has a long history starting as early as 1989 [3] with the majority of works focusing on the analysis of plain radiographic images [4, 5, 6].
Accessibility of large-scale clinical studies such as Osteoarthritis Initiative (OAI) further spurred the developments in particular using approaches from deep learning [7, 8] already reaching human-level diagnostic performance [9].
However, due to the limitations of X-ray imaging, radiography-based OA assessment is insensitive when attempting to detect changes in early OA [9] and potentially suffers from significant variability due to varying imaging settings and data acquisition set-ups.
Shape-based approaches [10, 11, 12], on the other hand, hold the promise of increased robustness toward such variability and, hence, are better transferable across different datasets.
As shapes are elements of nonlinear spaces that carry a rich geometric structure, linear approaches are limited in capturing the complex structural variability evident in a population.
Contrary, being faithful to this nonlinear structure has been shown to provide highly consistent results in particular w.r.t. to OA classification [13, 14, 15].
In recent years, machine learning and in particular deep learning has been proven to be very successful for a variety of data analysis tasks in medical image computing and beyond.
However, these techniques have been most successful on data featuring a Euclidean or regular grid-like structure such as, e.g., radiographic images.
Due to the non-Euclidean nature of shape space, these constructions are not easily transferred as there are no such familiar properties like a global system of coordinates or shift-invariance.
Approaches that generalize deep neural models to non-Euclidean domains in order to leverage the intrinsic structure belong to the field of geometric deep learning and we refer to [16] for an overview.
Beside their application domain, learning procedures can be classified into inductive and transductive approaches.
While inductive learning tries to infer a general model from labeled examples in order to predict labels of unseen ones, transductive approaches learn labels simultaneously on training and test data and, thus, can utilize training patterns directly while deciding for a test pattern.
Transductive learning therefore avoids solving a more general problem as an intermediate step and thus faces a simpler problem as compared to inductive learning.
In this work, we derive a novel transductive learning approach for automatic grading of osteophytes from morphometric knee bone data.
Our approach utilises deep neural networks for anatomical shape data combining concepts from computational anatomy and geometric deep learning.
To the best of our knowledge, we are the first to present a geometric deep learning classifier in this field, paving the way for novel approaches to computer-aided diagnosis of knee osteoarthritis.
2 Method
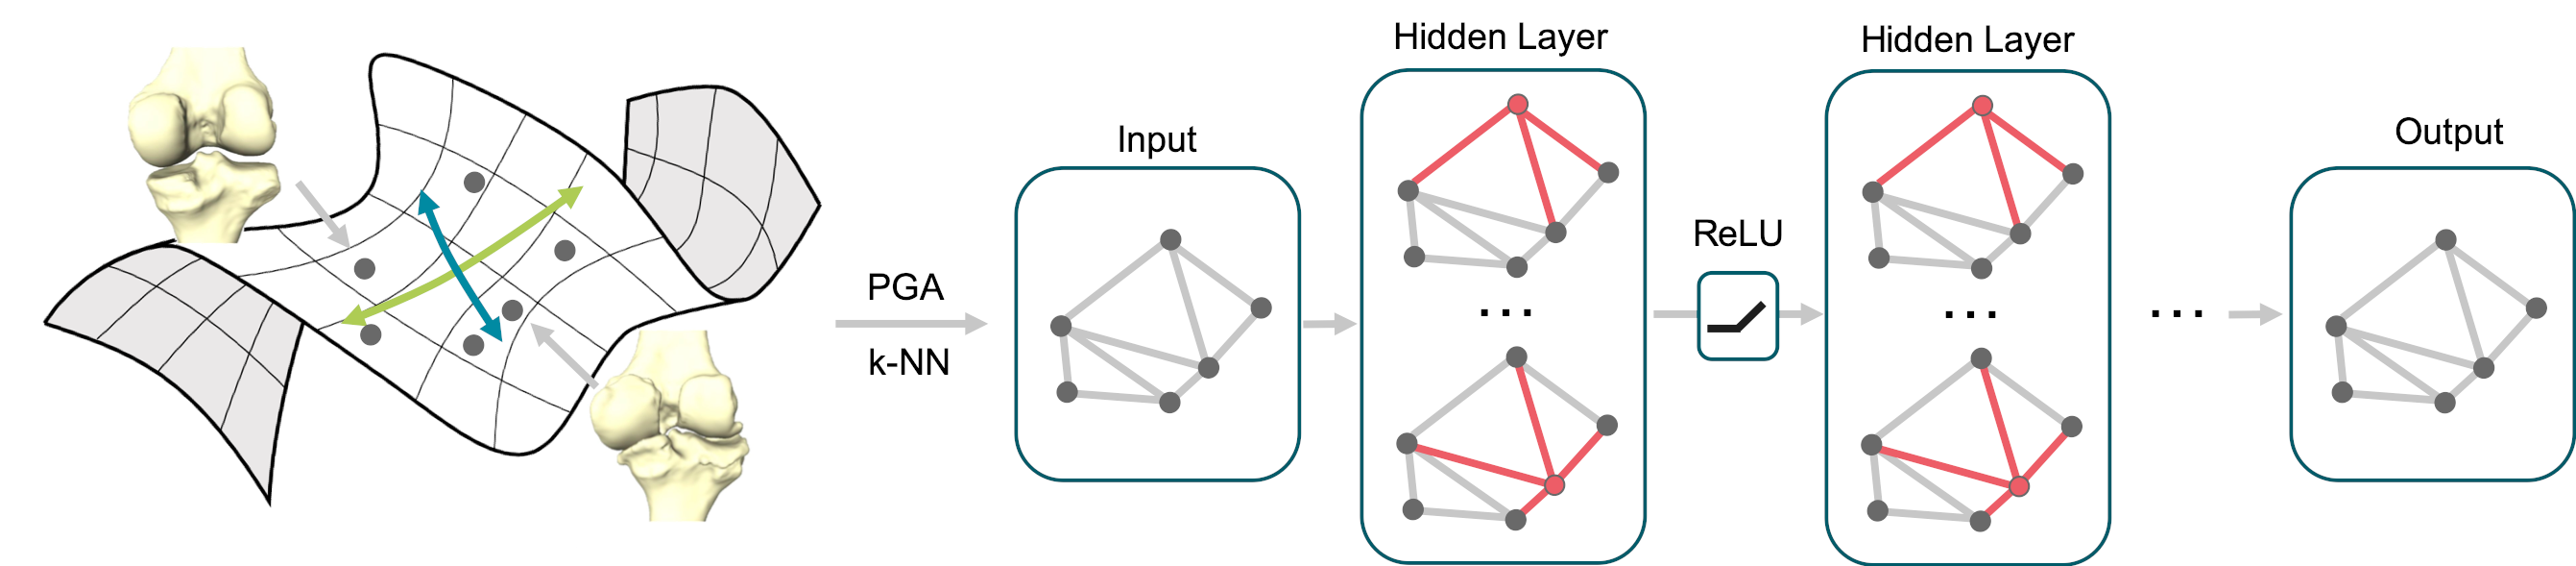
This section introduces the methodology proposed for the automatic grading of osteophytes from shape data. In particular, we consider shapes of knee bones (distal femur and proximal tibia) as elements of shape space, i.e. a high-dimensional and curved manifold. Although such biological shapes feature high natural variability, instances of a certain object class will lie in a significantly smaller sub-space. We obtain a structural description of this underlying sub-manifold by constructing a graph that encodes the heterogeneous pairwise relationships in the shape data. To this end, we construct an undirected k-nearest neighbors graph based on geodesic distances in shape space. Let be the corresponding (weighted) adjacency matrix with entries and kernel bandwidth . In the remainder of this section, we first provide details on the employed shape model and graph signal processing before we derive our approach to transductive OA classification. An overview of the entire pipeline is shown in Fig. 1
2.1 Shape Space
In medical image analysis shape usually refers to the boundary of anatomical objects belonging to a particular class of tissues so that they can be represented as deformations of a common template surface . In this context, shape representations based on differential coordinates [13] have been proven to provide highly discriminatory descriptions of shape. The main idea is to encode a deformation and thereby a shape in terms of its derivative called deformation gradient. At any point , the gradient can be factored uniquely into a rotational and stretch component using the well-known polar decomposition . This decomposition gives rise to a physically-motivated distance that effectively captures local changes in shape. Remarkably, despite its nonlinear structure this model exhibits closed-form expressions allowing for simple and efficient computations.
2.2 Graph Convolutional Filters
A central ingredient in obtaining convolutional architectures on graph-structured data is to derive signal filtering operators that generalize convolutions. In our derivation, we opt for a spectral approach over a spatial one as the latter require local charting which is not readily available on non-Euclidean domains. Motivated by the convolution theorem, spectral generalizations model graph convolutions as linear operators that commute with the (normalized) graph Laplacian , where is the diagonal degree matrix with . However, such filters are not naturally localized and computationally costly as they depend on the spectral transform. These issues can be overcome by using a truncated expansion of the spectral filter in terms of Chebyshev polynomials [17] up to -order. In particular, such a parametrization results in -localized filters, i.e. the output depends only on the -hop neighborhood at each node. Furthermore, this approach is efficient to evaluate and learn as it allows for a spectrum-free formulation. In our approach, we employ a first-order parametrization yielding graph filter with learnable parameters of the form
where and denote the scaled graph Laplacian and the largenst eigenvalue of , respectively.
2.3 Semi-supervised Classification
Based on the graph representation , we can cast the problem of transductive osteophyte grading as node classification task, where labels are only available for a subset of the nodes. Employing graph convolutional filters, we are able to avoid explicit graph-based regularization by encoding the graph structure directly via a graph convolutional neural network model and training it on a supervised loss that takes only labeled nodes into account. As the model is conditioned on the adjacency matrix of the graph, the model is able to learn representations of both labeled and unlabeled nodes as gradient information from can be distributed throughout the model.
In particular, we construct a multi-layer, feed-forward graph convolutional network with possibly several hidden layers each followed by a rectified linear unit (ReLU). The number of final feature channels is constrained to the desired number of classes. The loss energy is computed by a node-wise soft-max over the final feature map combined with the cross entropy loss function evaluated only on labeled nodes. We train the network using the RMSprop otimizer performing batch descent with the full dataset for every training iteration. To introduce stochasticity during training we add dropout (0.25 probability) to each layer.
As shapes expose many degrees of freedom, employing their high-dimensional representation as input features would yield a high-capacity model destined to overfitting. We circumvent this issue by performing a Riemannian dimension reduction to extract a low-dimensional descriptor that encodes the intrinsic geometric structure. To this end, we perform principal geodesic analysis [18] to estimate a geodesic sub-manifold that best captures the variability in the input shapes.
3 Experiments and Results
3.1 Data description
Our shape data comprises distal femora and proximal tibiae for 201 (67 per class) randomly selected subjects from the OsteoArthritis Initiative (a longitudinal, prospective study of knee OA) for which the segmentations are publicly available111https://doi.org/10.12752/4.ATEZ.1.0 [19]. The subjects are independently graded with 0 to 2 indicating none, minute, and definite presence of osteophytes, respectively.
3.2 Experimental Setup
For experimental evaluation we employed a model as described in Sec. 2 with 3 layers and 64 feature channels (determined via hyper-parameter optimization). To control for overfitting, the data was split into training, validation, and test sets with a ratio of , , and , respectively allowing for 3-fold cross-validation. We trained the model for 500 epochs choosing the best configuration according to validation accuracy. To account for randomness, we performed cross-validation on 100 permutations and report average testing accuracies. We further compare our intrinsic graph convolutional network to an extrinsic version that employs a flat Euclidean metric on shape space (with 2 layers and 96 feature channels according to hyper-parameter optimization).
3.3 Results
The average test set multi-class accuracy achieved by our intrinsic model was 64.64%. In contrast, comparing this result to the Euclidean approach, which averaged at 58.62%, this is a substantial improvement in classification accuracy.
| prediction \ actual class | 0 | 1 | 2 |
|---|---|---|---|
| 0 | 64.6% | 30.2% | 13.2% |
| 1 | 28.1% | 54.4% | 15.1% |
| 2 | 7.3% | 15.4% | 71.7% |
A more differentiated overview of the accuracy of our intrinsic model is given by the confusion matrix presented in Table 1. Consitently to the ordinal nature of osteophyte grades the off-diagonal entries in the confusion matrix decay with the distance to the diagonal. We further assess the agreement of our model with the expert annotations from the OAI dataset using Cohen’s quadratically weighted kappa coefficient. In particular, the kappa value on the test set was 0.58 indicating a moderate agreement.
4 Conclusion
We presented a novel shape-based deep learning approach to automatic knee osteophyte grading. A key feature of our method is that it is formulated intrinsically, i.e. it is coordinate-free and does not suffer from linearization errors. Furthermore, we propose a transductive approach that is conceptually simpler to classical inductive methods promising improved classification accuracies. As our graph neural network is fully convolutional, it can be directly applied to unseen data. In future work, we will therefore investigate the predictive power of such an out-of-sample approach in contrast to a full transductive re-training. Another interesting direction will be to employ a shape-based representation of the joint gap. This would allow to also predict narrowing which would pave the way towards a morphometric, computer-aided diagnosis of knee OA.
References
- [1] Theo Vos, Abraham D Flaxman, Mohsen Naghavi, Rafael Lozano, Catherine Michaud, Majid Ezzati, Kenji Shibuya, Joshua A Salomon, Safa Abdalla, Victor Aboyans, et al., “Years lived with disability (ylds) for 1160 sequelae of 289 diseases and injuries 1990–2010: a systematic analysis for the global burden of disease study 2010,” The lancet, vol. 380, no. 9859, pp. 2163–2196, 2012.
- [2] JH Kellgren and JS Lawrence, “Radiological assessment of osteo-arthrosis,” Ann Rheum Dis, vol. 16, no. 4, pp. 494, 1957.
- [3] JE Dacree and EC Huskisson, “The automatic assessment of knee radiographs in osteoarthritis using digital image analysis,” Rheumatology, vol. 28, no. 6, pp. 506–510, 1989.
- [4] Lior Shamir, David T Felson, Luigi Ferrucci, and Ilya G Goldberg, “Assessment of osteoarthritis initiative–kellgren and lawrence scoring projects quality using computer analysis,” Journal of Musculoskeletal Research, vol. 13, no. 04, pp. 197–201, 2010.
- [5] Tomasz Woloszynski, Pawel Podsiadlo, Gwidon Stachowiak, and Marek Kurzynski, “A dissimilarity-based multiple classifier system for trabecular bone texture in detection and prediction of progression of knee osteoarthritis,” Proceedings of the Institution of Mechanical Engineers, Part H: Journal of Engineering in Medicine, vol. 226, no. 11, pp. 887–894, 2012.
- [6] H Oka, S Muraki, T Akune, A Mabuchi, T Suzuki, H Yoshida, S Yamamoto, K Nakamura, N Yoshimura, and H Kawaguchi, “Fully automatic quantification of knee osteoarthritis severity on plain radiographs,” Osteoarthritis and Cartilage, vol. 16, no. 11, pp. 1300–1306, 2008.
- [7] Joseph Antony, Kevin McGuinness, Noel E O’Connor, and Kieran Moran, “Quantifying radiographic knee osteoarthritis severity using deep convolutional neural networks,” in 2016 23rd International Conference on Pattern Recognition (ICPR). IEEE, 2016, pp. 1195–1200.
- [8] Joseph Antony, Kevin McGuinness, Kieran Moran, and Noel E O’Connor, “Automatic detection of knee joints and quantification of knee osteoarthritis severity using convolutional neural networks,” in International conference on machine learning and data mining in pattern recognition. Springer, 2017, pp. 376–390.
- [9] Aleksei Tiulpin, Jérôme Thevenot, Esa Rahtu, Petri Lehenkari, and Simo Saarakkala, “Automatic knee osteoarthritis diagnosis from plain radiographs: A deep learning-based approach,” Scientific reports, vol. 8, no. 1, pp. 1727, 2018.
- [10] Todd L Bredbenner, Travis D Eliason, Ryan S Potter, Robert L Mason, Lorena M Havill, and Daniel P Nicolella, “Statistical shape modeling describes variation in tibia and femur surface geometry between control and incidence groups from the osteoarthritis initiative database,” J Biomech, vol. 43, no. 9, pp. 1780–1786, 2010.
- [11] Rebecca J Barr, Jennifer S Gregory, David M Reid, Richard M Aspden, Kanako Yoshida, Gillian Hosie, Alan J Silman, Salvatore Alesci, and Gary J Macfarlane, “Predicting OA progression to total hip replacement: Can we do better than risk factors alone using active shape modelling as an imaging biomarker?,” Rheumatology, vol. 51, no. 3, pp. 562–570, 2012.
- [12] Tuhina Neogi, Michael A Bowes, Jingbo Niu, Kevin M Souza, Graham R Vincent, Joyce Goggins, Yuqing Zhang, and David T Felson, “Magnetic resonance imaging–based three-dimensional bone shape of the knee predicts onset of knee osteoarthritis,” Arthritis Rheum, vol. 65, no. 8, pp. 2048–2058, 2013.
- [13] Christoph von Tycowicz, Felix Ambellan, Anirban Mukhopadhyay, and Stefan Zachow, “An efficient Riemannian statistical shape model using differential coordinates,” Med Image Anal, vol. 43, pp. 1–9, 2018.
- [14] Felix Ambellan, Stefan Zachow, and Christoph von Tycowicz, “A surface-theoretic approach for statistical shape modeling,” in Proc. Medical Image Computing and Computer Assisted Intervention (MICCAI), 2019, accepted for publication.
- [15] Felix Ambellan, Stefan Zachow, and Christoph von Tycowicz, “An as-invariant-as-possible GL+(3)-based statistical shape model,” in Proc. 7th MICCAI workshop on Mathematical Foundations of Computational Anatomy (MFCA), 2019, accepted for publication.
- [16] Michael M Bronstein, Joan Bruna, Yann LeCun, Arthur Szlam, and Pierre Vandergheynst, “Geometric deep learning: going beyond euclidean data,” IEEE Signal Processing Magazine, vol. 34, no. 4, pp. 18–42, 2017.
- [17] Michaël Defferrard, Xavier Bresson, and Pierre Vandergheynst, “Convolutional neural networks on graphs with fast localized spectral filtering,” in Advances in neural information processing systems, 2016, pp. 3844–3852.
- [18] P.T. Fletcher, C. Lu, S.M. Pizer, and S. Joshi, “Principal geodesic analysis for the study of nonlinear statistics of shape,” IEEE Trans Med Imaging, vol. 23, no. 8, pp. 995–1005, 2004.
- [19] Felix Ambellan, Alexander Tack, Moritz Ehlke, and Stefan Zachow, “Automated segmentation of knee bone and cartilage combining statistical shape knowledge and convolutional neural networks,” Med Image Anal, vol. 52, pp. 109–118, 2019.