S-1.5pt
Beauty and structural complexity
Abstract
We revisit the long-standing question of the relation between image appreciation and its statistical properties. We generate two different sets of random images well distributed along three measures of entropic complexity. We run a large-scale survey in which people are asked to sort the images by preference, which reveals maximum appreciation at intermediate entropic complexity. We show that the algorithmic complexity of the coarse-grained images, expected to capture structural complexity while abstracting from high frequency noise, is a good predictor of preferences. Our analysis suggests that there might exist some universal quantitative criteria for aesthetic judgement.
What makes a beautiful image? Is there such a thing as universal beauty? These puzzling yet fascinating questions have been tackled many times in the past within several disciplines, including philosophy, psychology, arts or mathematics Fechner (1876); Eco and De Michele (2004); Gombrich (1969); Vessel and Rubin (2010); Eysenck (1941); Bar and Neta (2006); Spehar et al. (2003); Alvarez-Ramirez et al. (2016); Hagerhall et al. (2004); McManus (2005); Graham and Field (2008); Forsythe et al. (2011). According to Kant, Is beautiful that which pleases universally without a concept Kant (2000). The idea of an intelligible beauty appeared in ancient Greece, where Nature was believed to be a cosmos constituting a principle of order and harmony. The proportions between the constitutive elements of each being are rightfully defined, whether it is a work of art, a living organism or a city Aujaleu (1997). Following the Greeks, the Baroque and Renaissance artists also believed in a universal beauty, and it is striking that their arts partially rely on a mathematisation of the artistic representation (symmetry McManus (2005), proper geometric proportions as given by the golden number Fechner (1876), etc.). In other terms, the belief that there must be scientific grounds to the conception of what is artistic or beautiful has been out there for quite some time. Yet, the very idea of a universal beauty is a longstanding debate which has known many ruptures through the history of art Eco and De Michele (2004) and still opposes a number a great modern thinkers.
Physicists’ interest in the subject is more recent. Stephens et al. Stephens et al. (2013) showed that natural images were critical in the thermodynamic sense and proposed a theory for the Thermodynamics of Natural Images. While, as pointed out above, many would consider quantitative aesthetics to be an oxymoron, and indeed it would be rather nonsensical to aim at building a fully consistent theory of pictorial art, we, as physicists, believe there is some room for a quantitative analysis. For example one could easily argue that an aesthetically appealing image often results from a subtle balance between regularities and surprises. Indeed, it seems rather plausible to think that while one might find dull an image that is too regular (no surprises), one may also feel lost in front of an image with no recognisable shapes or structures to hang on to (too much surprise). As argued in Bouchaud (2008), Total chaos is disquieting. Too much regularity is boring. Aesthetics is perhaps the territory in-between. Provided one agrees with such statements, these ideas clearly suggest that one could design an entropy-like function to quantify this subtle and complex equilibrium.
To address this question we run a large-scale survey in which people are asked to sort by preference two different sets of random images well distributed along three measures of entropic complexity: Fourier Magnitude’s slope, fractal dimension and compression rate. The paper is organised as follows. We first present and motivate our image generation methods. We then present and analyse the results of the survey. Finally, we argue that algorithmic complexity of the coarse-grained images is a rather good proxy for image appreciation, and conclude.
There exist many possible measures of image complexity, relying on e.g. their mathematical properties Koch et al. (2010); Desolneux et al. (2008), their physical properties Stephens et al. (2013); Gidas (1989); Foreman et al. (2018), or even their cognitive impact Field (1987); Spehar et al. (2015); Taylor et al. (2011). Here we choose to work with three simple measures that can be easily computed unequivocally for any digital 2D image. The first one is the magnitude slope defined as the logarithmic slope of the radially averaged Fourier magnitude , where denotes the Fourier Transform of the image greyscale intensity , and . The second is the fractal dimension computed using the Minkowski-Bouligand box-counting method Dubuc et al. (1987). After transforming the image to B&W using an intensity threshold ensuring two equally-populated levels Stephens et al. (2013), the fractal dimension follows where is the number of boxes of size containing both black and white features. The third is the compression rate or algorithmic complexity computed as the ratio between the sizes of the PNG compressed and uncompressed image.
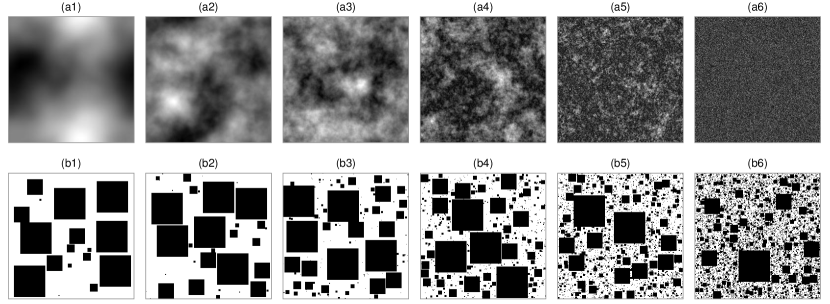
In order to remove possible cognitive and cultural biases, we choose to design our experiment with abstract images randomly generated using two of the complexity measures presented above. The first set of images (Fig. 1a) is generated by reverse-engineering the Fourier Magnitude property: setting , where is drawn from a uniform distribution on with , and taking the inverse Fourier Transform of allows to produce a series of random greyscale images with controlled Magnitude slope Spehar et al. (2016, 2015); Spehar and Taylor (2013) Table 1 gathers the computed complexity measures , and of the 256256 images displayed in Fig. 1a. As one can see both and are increasing functions of , comforting our choice of complexity measures and indicating that there is a clear correlation between the spectral, fractal and algorithmic properties.
The use of a second set of images was motivated by the remarks of some survey participants. When asked why they had preferred certain images, they responded their picks reminded them of cloudy skies or galactic landscapes. With the aim of producing more abstract images, we used an alternative method, now based on reverse-engineering the Minkowski-Bouligand box-counting method (Fig. 1b). Black squares of size , , drawn from the distribution are randomly added to a white canvas of size 256256 with the condition that they do not overlap. The upper boundary is chosen such that the biggest squares occupy at most 1/16th of the total surface, . We also enforce that the total fraction of black pixels does not exceed 1/2. Here again the complexity measures appear to be increasing functions of one another (see Tab. 1).
| a1 | a2 | a3 | a4 | a5 | a6 | |
|---|---|---|---|---|---|---|
| -3.96 | -2.47 | -1.95 | -1.42 | -0.76 | 0 | |
| df | 1.22 | 1.33 | 1.58 | 1.87 | 1.99 | 2.0 |
| 0.045 | 0.074 | 0.12 | 0.22 | 0.40 | 0.41 |
| b1 | b2 | b3 | b4 | b5 | b6 | |
|---|---|---|---|---|---|---|
| -2.14 | -1.78 | -1.56 | -1.32 | -1.04 | -0.77 | |
| df | 1.42 | 1.51 | 1.62 | 1.75 | 1.88 | 1.95 |
| 0.012 | 0.014 | 0.022 | 0.044 | 0.095 | 0.16 |
In 2013, Spehar and Taylor Spehar and Taylor (2013) conducted a survey on twenty-six academics, using black and white computer generated images with increasing fractal dimension. They found a reversed U-shaped relation between image appreciation and Fractal dimension, with an aesthetic optimum for , allowing to argue that we indeed tend to prefer images with intermediate complexity, see also Spehar et al. (2015, 2016). Curious of their results, we conducted a larger scale experiment intended for a larger panel (over a thousand participants with different backgrounds), using the images presented in Fig. 1. Our question at this stage is similar: is there a link between the statistical properties of our generated images and the tendency of people to appreciate them?
Survey methods design constitutes a strand of research on its own Losh-Hesselbart and Fowler (1985). For optimal results the selection task must be simple and display the minimum amount of information to the interviewee. While the common five-star ratings only take a time proportional to the number of images to score, these have been shown to be weighted by extreme grades, the utility given to intermediate grades being far from linear Aral (2014). Five-star ratings image-by-image can also be rather disorienting due to the lack of reference. Another option is image classification, where interviewee is presented with the whole set of images and is then asked to sort them by preference. While also time-efficient, presenting all the images at once might strongly induce people into intuitively recognising other features, such as complexity, and ending by sorting them by something else than preference. Finally, the Battle survey consists in successively presenting to the interviewee all possible sets of two images and asking them to choose the one they prefer Vessel and Rubin (2010); McManus (1980). While less time-efficient (with battles, for 6 one needs 15 rounds to complete the survey), this method beats the other shortcomings mentioned above, and people usually feel more comfortable with such a binary task, intellectually less challenging. We thus choose the latter method.
We conducted three slightly different surveys. The panel for the first survey consisted of colleagues from CFM and Ecole Polytechnique as well students and relatives, adding up to people, who were asked to participate without any financial incentive. While probably slightly biased population-wise, these are the results as we are most confident with, since we believe people in such a panel completed their tasks selflessly and honestly. To run this survey we used the Zooniverse platform zoo which provides a rather intuitive interface. The 15 two-image sets for each series were generated using a python algorithm that concatenated the images in a random order and attributed them a different name so that the interviewee couldn’t find hidden information. Upon completion of the survey, to establish a global ranking of the images we attributed them a score according to the following rule: if image wins (resp. looses) a battle, its score increases (resp. decreases) by where denotes the number of battles in which was involved 111Note that was not exactly equal to since a small number of participants stopped before completing the 15 battles.. To obtain a score we then transform it as . The results are plotted as a solid black line in Fig. 2. Remarkably, the preferred images appear to be a4 a5, and b4 b5 respectively, both corresponding to close to 1. To note, interestingly is often associated to the spectral properties of natural images Stephens et al. (2013); Tolhurst et al. (1992) and visual arts Koch et al. (2010). Discussions with voters revealed that they found their favorite images to be the most harmonious and well balanced.
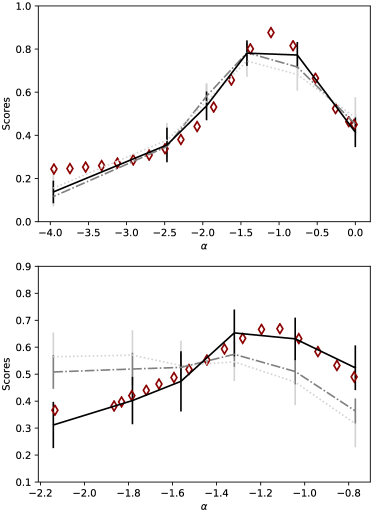
In order to increase the size and diversity of the panel, we ran two other experiments on the Mechanical Turk platform mec , in which participants are paid a small amount of money to participate (we reached panelists). The first attempt on this platform (dotted light-gray line in Fig. 2) appeared to give rather noisy results, especially for the second set of images. We partly attribute this to a fraction of participants answering randomly to the battles, which is likely much less significant when people participate selflessly and in good will. In general, survey participants on such paying platforms are evaluated and only get paid if they completed their tasks satisfactorily, but in our case one cannot really evaluate the panelists since satisfactorily here only stands for honestly. In the second tentative (dash-dotted gray line in Fig. 2) we formulated the question differently in order to encourage non-random participation: much like in Keynes’ famous beauty contest Keynes (1936), people were asked to pick the image which they thought would be preferred by the majority and told they would not get paid if their overall choices fell too far off the average (needless to say, we did process all of the data, regardless of its distance to the average). While probably introducing other biases, the results displayed less noise and better agreement with that of the initial selfless survey. Also note that while all results are fully consistent for the first set of images (Fig. 1(a)), the second experiment leads to a less pronounced maximum for the image series of Fig. 1(b), with scores on average closer to than they were for the very first experiment.
Very much like entropy is used to measure the disorder in a physical system, we would now like to see whether there might exist a statistical proxy to estimate an image’s harmony and equilibrium, as described by our survey participants. Given the complexity measures described above, images with low complexity display very simple shapes (a1 b1), and images with very high complexity display a large amount of white noise (a6 b6). Our survey revealed that maximum appreciation is obtained for intermediate complexity suggesting the following question: could it be that an aesthetically appealing image results from a subtle balance between complexity and regularity? And if so, can we find an associated statistical measure? The work of Desolneux et al. Desolneux et al. (2008) clearly resonates with such questions. Guided by the idea that there is no perceptual structure in white noise, the authors attempted to characterise forms and structures and in particular defined unusual features or Gestalts as sets of points whose (…) spatial arrangement could not occur in noise. Their ideas can be easily illustrated with the coffee and cream dynamics Aaronson et al. (2014). Consider the experiment in which plain cream is left to slowly mix with plain coffee. While the initial and final states of such a system display very regular homogeneous structures, the transitional regime displays interesting and complex mixing patterns as the cream/coffee interface slowly disappears. So far we have used the term complexity rather imprecisely and it is now time to distinguish more rigorously two sorts of complexity. The first is entropic complexity measuring the amount of information in the image, which in the coffee experiment can only be an increasing function of time according to the second law of thermodynamics; the second is structural complexity accounting for the amount of features outside of the noise, which here is a non-monotonous function of time displaying a maximum at intermediate stages where the non-trivial mixing patterns are most significant. Entropic complexity is well described by , or more commonly . Structural complexity, in a sense, measures noiseless entropic complexity or interestingness.
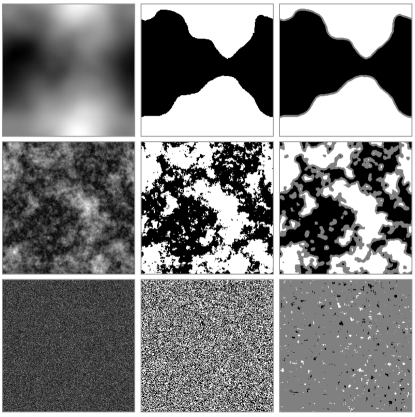
Guided by the work of Aaronson et al. Aaronson et al. (2014) we computed structural complexity as a noiseless entropy. More precisely we apply a coarse-graining procedure of given radius on the B&W images and then compute their algorithmic complexity which we call structural complexity in the following 222Spehar et al. Spehar et al. (2016) showed that the preference curve was hardly affected by the gray scale to B&W transformation. For the sake of simplicity we thus choose to apply the coarse-graining procedure to B&W images.. The colour of a given block is determined by its black to white pixel ratio : white if , gray if , and black for where is a given threshold. Figure 3 illustrates the procedure on images a1, a4 and a6; after turning them into B&W (second column), the coarse-graining procedure is applied (third column). As one can see, image a1 is barely changed (just a thin gray line at the domain boundaries) and we thus expect , image a4 is slightly denoised while letting its structures invariant , image a6 however is strongly denoised as the coarse-graining procedure has left it almost plain gray suggesting . The structural complexity computed for both sets of image is plotted on Fig. 2 as dark red diamonds. As expected, , or equivalently and , are non-monotonous functions displaying a maximum for intermediate values of , and . Since the -axis is rather arbitrary we have rescaled and shifted for an easier comparison with the survey data. Furthermore, the scale parameter and the threshold can be used as fitting parameters; in particular acts as the cutoff of a low-pass filter which erases high frequency spatial features, increasing it tends to lowers the right most red markers and shift the maximum to the left. Up to a multiplicative factor, best fits are obtained for for the first set and for the second.
The agreement between theory and experiments is quite convincing. Not only do the maxima coincide, but also the overall shape of the curves is similar. This quantitatively supports the idea that structural complexity is a good proxy for average image preference.
Let us summarise what we have achieved. Using two random-image-generation algorithms, we produced two different sets of abstract images spanning a broad range of entropic complexity, measured by three different quantities. We then designed and ran a large-scale experiment for image classification and found that preference peaks about complexity criteria matching that of natural images, perhaps indicating that people’s preferences are influenced by their natural environment. Finally, our main contribution is to show that a “noiseless” entropy (that captures interesting structural features only) accounts well for the experimental results on image appreciation. It is interesting to speculate that, when confronted with images, the human brain may actually conduct the same kind of geometrical coarse-graining, trying to extract forms and structures while erasing uninteresting noise, or as put by the Gestalt theory Wertheimer (1938): filter meaningful perceptions from chaotic stimuli. As a result, the excess of noise and lack of forms may lead to unconscious rejection of structureless images.
Acknowledgements.
We thank Christian Schmidt, Debanuj Chatterjee and Raphael Benichou for fruitful discussions, as well as Bastien Legay, who contributed to the early stages of this project. This publication uses data generated via the Zooniverse.org platform, development of which is funded by generous support, including a Global Impact Award from Google, and by a grant from the Alfred P. Sloan Foundation. This research was conducted within the Econophysics & Complex Systems Research Chair, under the aegis of the Fondation du Risque, the Fondation de l’Ecole polytechnique, the Ecole polytechnique and Capital Fund Management.References
- Fechner (1876) G. T. Fechner, Vorschule der aesthetik, Vol. 1 (Breitkopf & Härtel, 1876).
- Eco and De Michele (2004) U. Eco and G. De Michele, Storia della bellezza (Bompiani Milano, 2004).
- Gombrich (1969) E. H. Gombrich, Art and illusion (Princeton, 1969).
- Vessel and Rubin (2010) E. A. Vessel and N. Rubin, Journal of vision 10, 18 (2010).
- Eysenck (1941) H. J. Eysenck, The American Journal of Psychology 54, 385 (1941).
- Bar and Neta (2006) M. Bar and M. Neta, Psychological science 17, 645 (2006).
- Spehar et al. (2003) B. Spehar, C. W. Clifford, B. R. Newell, and R. P. Taylor, Computers & Graphics 27, 813 (2003).
- Alvarez-Ramirez et al. (2016) J. Alvarez-Ramirez, C. Ibarra-Valdez, and E. Rodriguez, Chaos, Solitons & Fractals 83, 97 (2016).
- Hagerhall et al. (2004) C. M. Hagerhall, T. Purcell, and R. Taylor, Journal of Environmental Psychology 24, 247 (2004).
- McManus (2005) I. C. McManus, European Review 13, 157 (2005).
- Graham and Field (2008) D. J. Graham and D. J. Field, Spatial vision 21, 149 (2008).
- Forsythe et al. (2011) A. Forsythe, M. Nadal, N. Sheehy, C. J. Cela-Conde, and M. Sawey, British Journal of Psychology 102, 49 (2011).
- Kant (2000) I. Kant, Critique of the Power of Judgment (Cambridge University Press, 2000).
- Aujaleu (1997) E. Aujaleu, Tréma , 33 (1997).
- Stephens et al. (2013) G. J. Stephens, T. Mora, G. Tkacik, and W. Bialek, Physical review letters 110, 018701 (2013).
- Bouchaud (2008) J.-P. Bouchaud, Leonardo 41, 239 (2008).
- Koch et al. (2010) M. Koch, J. Denzler, and C. Redies, PLoS one 5, 12268 (2010).
- Desolneux et al. (2008) A. Desolneux, L. Moisan, and J.-M. Morel, From Gestalt Theory to Image Analysis (Springer New York, 2008).
- Gidas (1989) B. Gidas, IEEE Transactions on Pattern Analysis and Machine Intelligence 11, 164 (1989).
- Foreman et al. (2018) S. Foreman, J. Giedt, Y. Meurice, and J. Unmuth-Yockey, Phys. Rev. E 98, 052129 (2018).
- Field (1987) D. J. Field, Journal of the Optical Society of America A 4, 2379 (1987).
- Spehar et al. (2015) B. Spehar, S. Wong, S. van de Klundert, J. Lui, C. W. G. Clifford, and R. Taylor, Frontiers in Human Neuroscience 9, 514 (2015).
- Taylor et al. (2011) R. Taylor, B. Spehar, C. Hagerhall, and P. Van Donkelaar, Frontiers in Human Neuroscience 5, 60 (2011).
- Dubuc et al. (1987) B. Dubuc, C. Roques-Carmes, C. Tricot, and S. Zucker, in Visual Communications and Image Processing II, Vol. 845 (1987) pp. 241–248.
- Spehar et al. (2016) B. Spehar, N. Walker, and R. P. Taylor, Frontiers in Human Neuroscience 10, 350 (2016).
- Spehar and Taylor (2013) B. Spehar and R. P. Taylor, in Human vision and electronic imaging XVIII, Vol. 8651 (2013) p. 865118.
- Losh-Hesselbart and Fowler (1985) S. Losh-Hesselbart and F. J. Fowler, Journal of the American Statistical Association 80, 1077 (1985).
- Aral (2014) S. Aral, MIT Sloan Management Review 55, 47 (2014).
- McManus (1980) I. C. McManus, British Journal of Psychology 71, 505 (1980).
- (30) “Zooniverse,” https://www.zooniverse.org/, accessed: 2019-06-01.
- Note (1) Note that was not exactly equal to since a small number of participants stopped before completing the 15 battles.
- Tolhurst et al. (1992) D. Tolhurst, Y. Tadmor, and T. Chao, Ophthalmic and Physiological Optics 12, 229 (1992).
- (33) “Mechanical turk,” https://www.mturk.com/, accessed: 2019-07-01.
- Keynes (1936) J. M. Keynes, General theory, employment, interest and money (Palgrave-McMillan, 1936).
- Aaronson et al. (2014) S. Aaronson, S. M. Carroll, and L. Ouellette, “Quantifying the rise and fall of complexity in closed systems: The coffee automaton,” (2014), arXiv:1405.6903 .
- Note (2) Spehar et al. Spehar et al. (2016) showed that the preference curve was hardly affected by the gray scale to B&W transformation. For the sake of simplicity we thus choose to apply the coarse-graining procedure to B&W images.
- Wertheimer (1938) M. Wertheimer, Gestalt theory (Kegan Paul, Trench, Trubner & Company, 1938).