Gaia 19ajj: A Young Star Brightening Due to Enhanced Accretion Reduced Extinction
Abstract
We report on the source Gaia 19ajj, identifying it as a young star associated with a little-studied star-forming region seen along a complex line-of-sight through the Gum Nebula. The optical lightcurve recently recorded by Gaia exhibits a slow and unsteady 5.5 mag rise over about 3 years, while the mid-infrared lightcurve from NEOWISE over the same time period shows a 1.2 mag rise having similar structure. Available color information is inconsistent with pure extinction reduction as the cause for the photometric brightening. Optical spectroscopic characteristics in the current bright phase include: little in the way of absorption except for the hallmark Li I 6707 Å signature of youth plus weak e.g. Ca I and notably Ba II; strong wind/outflow in Ca II, Mg I b, Na I D, H, K I, O I; jet signatures in [O I], [S II], [Ca II], [Fe II], and [Ni II]; and narrow rest-velocity emission in neutral species such as Fe I, Ni I, and Mg I. The infrared spectrum is also characterized by outflow and emission, including: a hot He I wind, jet lines such as [Fe II] and ; and weak narrow rest-velocity atomic line emission. The bandheads are weakly in emission, but there is also broad absorption. Gaia 19ajj exhibited a previous bright state in the 2010-2012 time frame. The body of photometric and spectroscopic evidence suggests that the source bears resemblance to V2492 Cyg (PTF 10nvg) and PV Cep, both of which similarly experience bright phases that recur on long timescales, with large-amplitude photometric variations and emission-dominated spectra. We interpret the behavior of Gaia 19ajj as caused by cycles of enhanced disk accretion accompanied by reduced extinction.
submitted to AJ 20190715; revised 20190925; revised 20191012
1 INTRODUCTION
The evolution of circumstellar material around young stars is a topic of great interest for problems ranging from the build-up of stellar mass during star formation and early stellar evolution to the formation of planets in circumstellar disks. These processes are heavily influenced over the first several Myr of a star’s life by the trades between – on the one hand – envelope infall and disk accretion bringing mass inward, and – on the other hand – outflows, jets, and winds arising from a range of locations in the stellar/circumstellar environment, that eject mass from the system.
One way of tracing dynamical effects in young stars is through photometric variability. For nearly a century, highly variable astronomical objects have been reported in the literature (e.g. Joy, 1945; Herbig, 1946) that were later associated with young stars (Ambartsumian, 1949; Herbig, 1952, 1957). The many flavors of young star variability were subsequently characterized by various authors, notably by Herbst et al. (1994) and Herbst, & Shevchenko (1999); see also Ismailov (2005). Over the past decade, the true diversity of young star behavior in the time domain has become more fully appreciated and the lightcurve categories more rigorously defined. Increasingly higher cadence and more photometrically precise datasets (e.g. Cody et al., 2014; Cody & Hillenbrand, 2018), as well as long-duration, multi-decade investigations (e.g. Ibryamov et al., 2015; Mutafov et al., 2019) have contributed. Such studies have been possible due to dedicated monitoring efforts over small fields, and modern all-hemisphere, and even all-sky, time domain surveys. The involvement of amateur astronomers with sophisticated equipment and eyes on the sky has also been important, particularly in the identification of rare large-amplitude brightness changes.
For nearly a half century, we have recognized a small sample of large and very large-amplitude ( mag) young star variables as outbursting sources (Herbig, 1977, 1989; Connelley & Reipurth, 2018). The basic paradigm of episodic accretion, or punctuated periods of enhanced mass accretion/outflow that builds up the final 10% of the stellar mass, was developed based on these early but scant observations (see review by Hartmann & Kenyon, 1996). The rates for the different types of outbursts remain relatively poorly constrained empirically (Hillenbrand & Findeisen, 2015), though for recent significant progress see Contreras Peña et al. (2019). Especially over the past decade, our understanding of the diversity in behavior of young stars during such large-amplitude brightenings has been enhanced by the coordination of multi-color photometric and multi-wavelength spectroscopic follow-up of detected brightening events.
In this paper, we describe a large-amplitude brighting of the newly appreciated young stellar object Gaia 19ajj. The Gaia mission, although primarily an astrometric mission, offers public alerts111Gaia Alerts; http://gsaweb.ast.cam.ac.uk/alerts based on photometric changes exceeding 2 mag in the broad-band optical G filter (Hodgkin et al., 2013, Hodgkin et al. 2020, in preparation). One such alert was issued on 2019, January 31 for Gaia 19ajj. Since that time, the source at position 08:10:45.78 -36:04:30.94 (J2000.) has continued to brighten.
In this paper, we first describe the source Gaia 19ajj and its environment, in §2. In §3, we report on the publicly available Gaia lightcurve of Gaia 19ajj and its historical context based on ASAS and VPHaS photometry. We also present WISE and NEOWISE photometry at mid-infrared wavelengths covering essentially the same time baseline. Our follow-up near-infrared photometry is presented in §4 and the critical spectroscopy at both optical and infrared wavelengths in §5. §6 contains a summary and short discussion of the context of this source amid the complex zoo of young star variables, and §7 our conclusions regarding its similarity to sources like V2492 Cyg (PTF 10nvg; Covey et al., 2011; Hillenbrand et al., 2013; Giannini et al., 2018) with PV Cep another good analog.
2 THE SOURCE
2.1 Environment
Gaia 19ajj is located within an optically opaque small cloud, positioned about 1.5 deg below the southern galactic plane. Figure 1 shows the large scale region. The sightline passes the northern part of the Vela Molecular Ridge, broadly located towards the Gum Nebula. The best known objects in this general area are the CG 30/31 globules containing HH 120, located 15′ to the west (Reipurth, 1983). About a degree to the NE is the prominent H II region RCW 19 = Gum 10 (Rodgers et al., 1960; Gum, 1955).
Between these two features is a small cloud, Dobashi 5180 (Dobashi, 2011), in which Gaia 19ajj is located. Other very nearby cataloged structures include the dark clouds DC 253.6-1.3 Hartley et al. (1986) and G253.56-1.32 (Dutra & Bica, 2002), and the Planck-identified dust clump and dense core PLCKECC G253.49-01.26 (Planck Collaboration et al., 2011), to the east. The Gaia 19ajj position is just southeast of IRAS 08088-3554 which is identified as a compact H II region.

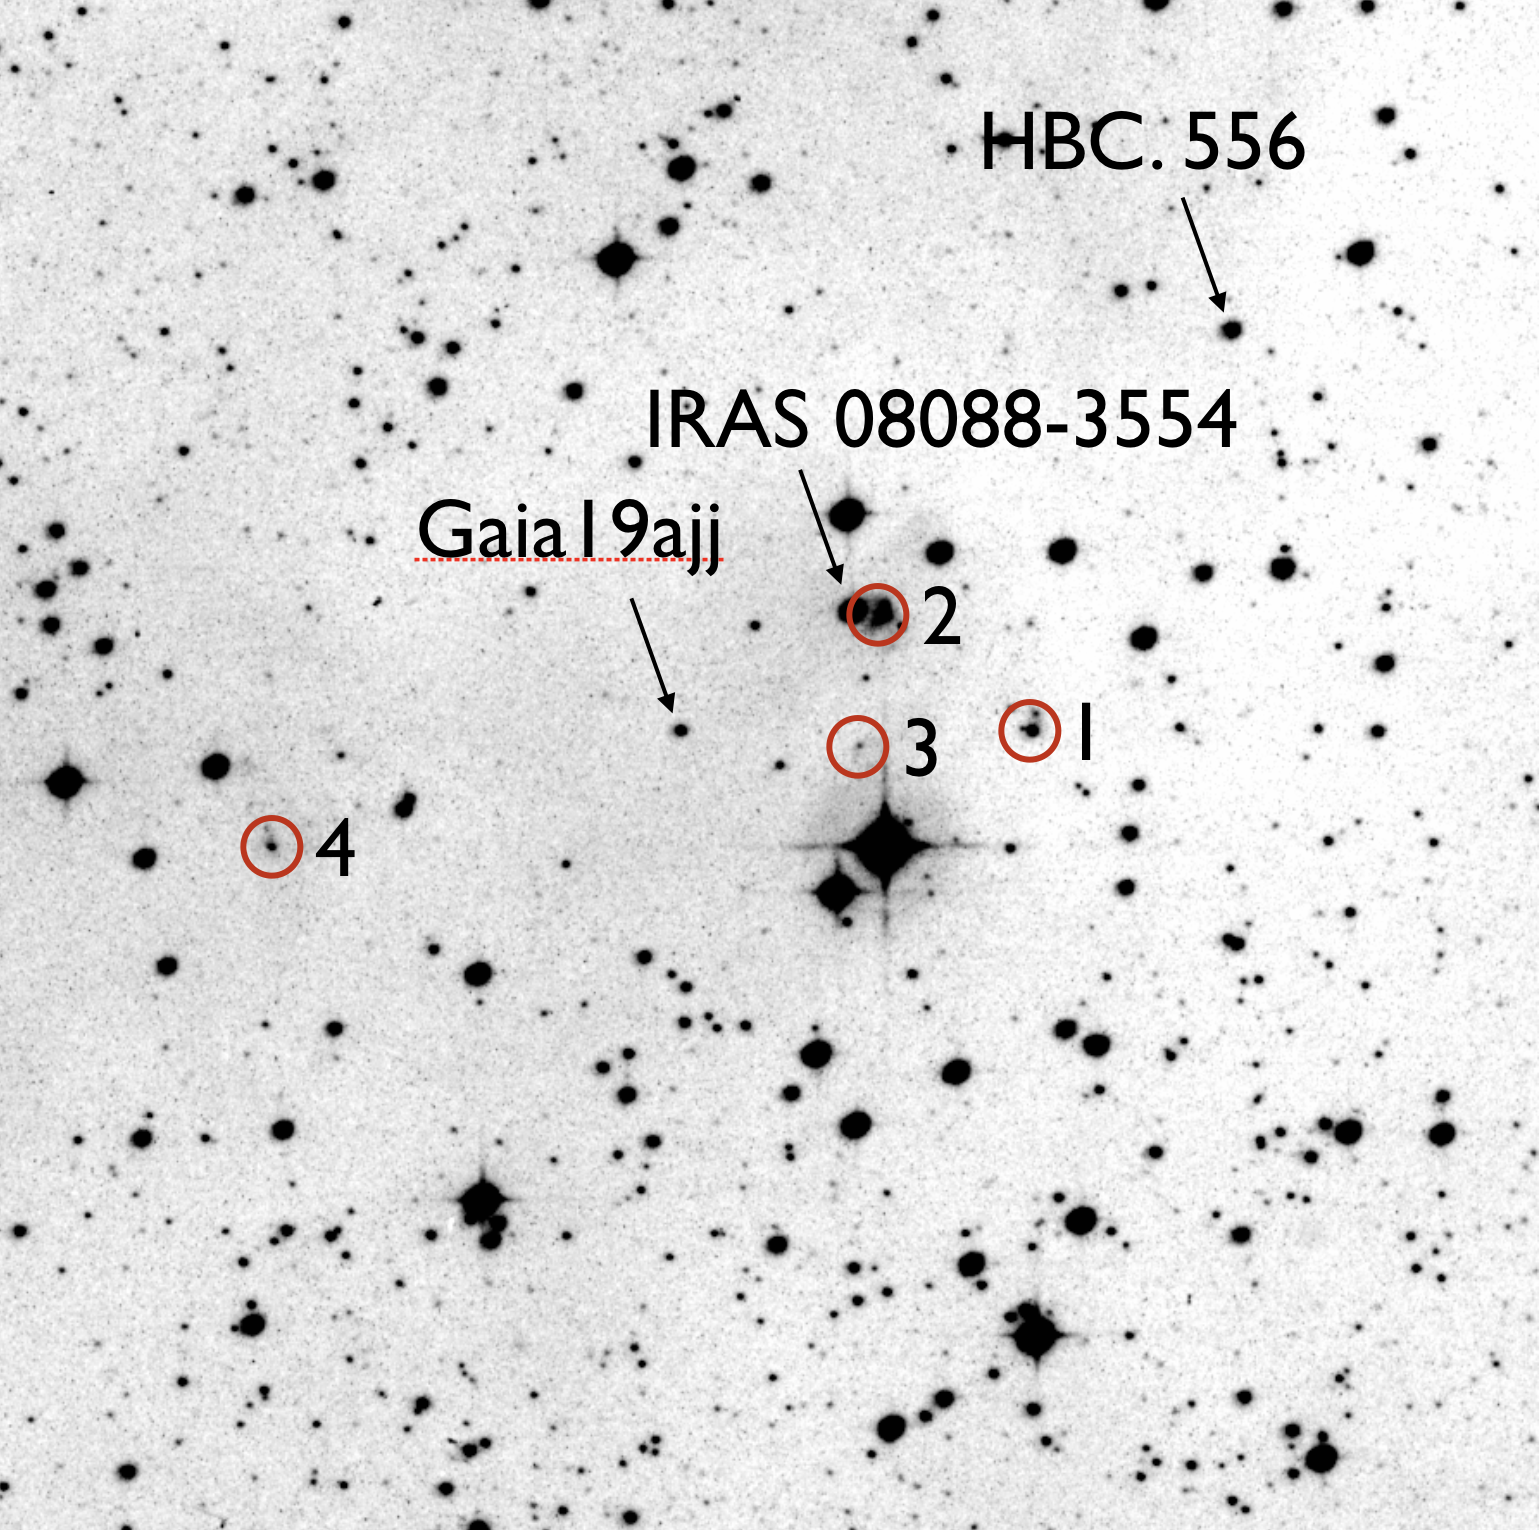
The immediate region of Gaia 19ajj features many diffuse objects in optical images from the NOAO DECam Plane Survey (DECaPS; Schlafly et al., 2018), and there is evidence of a grouping of bright red stars, including Gaia 19ajj, in the mid-infrared WISE images. The local cloud is clearly a recently active star-forming region. The most well-studied young star in the vicinity is HBC 556, a few arcmin to the west. Pettersson et al. (1987a, b) identified this source as PH21, of spectral type M4, in a broad-area search for H emission stars in the region between the cometary globules and RCW 19. In order to gauge the level of star formation activity in this region, we looked for the presence of additional H emission sources in the vicinity of Gaia 19ajj by examining an H image obtained as part of the AAO SuperCOSMOS survey (Parker et al., 2005). We identify four such sources in Figure 1. A color image from DECam (available via the ALADIN service) shows even more detail of these and additional, fainter nebulae in the vicinity.
2.2 Distance
The Gaia DR2 (Gaia Collaboration et al., 2018) distance to Gaia 19ajj, derived by simply inverting the measured parallax ( mas), is pc. This can be compared to previous estimates of distance in this region of sky. First, Westerlund et al. (1963) discovered an OB association, which he called Puppis OB III, apparently related to the RCW 19 H II region to the east of Gaia 19ajj, and estimated its distance at around 1700 pc. Considering the more proximately located HBC 556, Pettersson et al. (1987a) assumed that this star is located within the Gum Nebula, at the same approximate distance of the cometary globules to the west of Gaia 19ajj, estimated at around 450 pc. We concur that from its brightness and spectral type, HBC 556 can not be a distant object. Finally, a kinematic distance of 3.3 kpc was suggested by Bhatt et al. (1998) for the associated small cloud itself, but this value is both highly uncertain and improbable given the other evidence. We adopt the 832 pc distance from Gaia DR2. This implies that Gaia 19ajj, and thus presumably the Dobashi 5180 small cloud, is located behind the Gum Nebula.
2.3 Spectral Energy Distribution

The spectral energy distribution (SED) that can be assembled for Gaia 19ajj (Figure 2; see also the Vizier version222http://vizier.u-strasbg.fr/vizier/sed/?submitSimbad=Search&-c=08:10:45.78%2B-36:04:30.94&-c.r=2&-c.u=arcsec) rises from 0.5 to 4 m, then turns over with flat or only slightly declining energy out to 24 m. The SED is comprised of photometry taken at different epochs – when the source was in various photometric states. Catalog data originates from the NOMAD (Zacharias et al., 2005), USNO-B (Monet et al., 2003), VPHaS DR2 (Drew et al., 2014), Gaia DR2 (Gaia Collaboration et al., 2018), 2MASS (Cutri et al., 2003; Skrutskie et al., 2006), DENIS333http://cdsweb.u-strasbg.fr/denis.html, WISE (Wright et al., 2010), MSX (Price et al., 2001), and AKARI (Ishihara et al., 2010) catalogs. The photometry from Gaia DR2 is an order of magnitude fainter than the somewhat earlier VPHaS optical photometry and much fainter than the decades earlier USNO-B value (see Figure 3).
Regardless of the demonstrated short-wavelength photometric variability, Gaia 19ajj is clearly a ‘Class I’ type young stellar object with a flat mid-infrared SED444 Quantitatively, we measure a spectral index from the 2MASS band and WISE 22 m band photometry, as 0.36.. This SED category is associated with diskenvelope circumstellar geometry, suggesting a significant amount of high latitude material above the disk that is distributed in a more spherical-like geometry, with ongoing infall and rapid accretion onto the central stellar object. We do not attempt to model the SED given the demonstrated variability and the geometric complications for the radiative transfer.
The SED also implies that at least some of the short wavelength light may be scattered rather than direct. This is consistent with the fact that the fainter-state photometry represented in the Gaia DR2 data does not demand significantly higher reddening relative to the much brighter state of the VPHaS measurements. As discussed below, the photometric changes in Gaia 19ajj are likely not explained by extinction changes alone.
2.4 Other Available Information
There are no previous publications studying this specific star (2MASS 08104579-3604310), though it does appear based on its WISE colors in the large catalog of Marton et al. (2016) identifying candidate young stellar objects.
Gaia 19ajj is an apparent H emitter, even in previously fainter states. The VPHaS catalog (Drew et al., 2014) provides a brightness mag and a moderate color of mag, along with an emission index mag. According to the models in Figure 2 of Barentsen et al. (2013), the source would be an obvious H emitter, with equivalent width of several tens of Angstroms.
Given the spectral energy distribution, as well as the large amplitude photometric variability described below, it is unwise to attempt a luminosity calculation. However, the observed optical colors suggest a spectral type earlier than , assuming there is also some color contribution from reddening. Adopting the pc distance, the absolute magnitude in an average part of the lightcurve (see below) is , where is the unknown value of the extinction in the r-band. A typical luminosity around Lfor a young pre-main sequence star would suggest 3 mag.
3 THE LIGHTCURVE
3.1 Optical

Figure 3 shows the Gaia G-band lightcurve available from http://gsaweb.ast.cam.ac.uk/alerts/alert/Gaia19ajj/, with the last update for our analysis occurring on 28 February, 2019. No error estimates are provided but we adopt 0.05 mag uncertainty. We include an iPHaS/VPHaS (Drew et al., 2014) r-band measurement that has been approximately converted to the Gaia photometric system (using the procedure described in Hillenbrand et al., 2018). Also shown is the V-band and g-band data available from ASAS (Shappee et al., 2014). These data have higher cadence than the Gaia data, and indicate quasi-periodic oscillations during the 2018-2019 rise, with a periodogram peak around 24 days. We investigated the availability of TESS data for this source, which was observed from 7 January through 28 February, 2019, but the TESS pixels are too big given the field density for a viable lightcurve to be derived at the current level of TESS data processing.
The total brightening of Gaia 19ajj over the past three years exceeds 5.5 mag in the Gaia G-band. While impressive, and possibly suggestive of an outbursting source such as an FU Ori star, Gaia 19ajj was also bright in early 2012, conceivably as bright as it is now. The subsequent large-amplitude fade and more recent re-brightening at both infrared and optical wavelengths suggests that the photometric excursions may have a complex interpretation, such as being due in part to accretion variations and in part to extinction variations. A long-duration color time series would help in the assessment. Unfortunately, there is little optical color information available at present. By matching the time series between Gaia and ASAS, we derive only a crude color estimate in the range 1.2 - 1.8 mag and no meaningful color variability information.
The historical record of photographic plate measurements of Gaia 19ajj supports repeated large-amplitude brightening and fading. The USNO-A2 (Monet, 1998) records R=17.25 mag for a mean epoch between blue and red observations of 1978.5, while the USNO-B1 (Monet et al., 2003) gives R=14.66 mag for mean epoch 1982.3. In other words, the source has exhibited approximately 3 mag variability on few year time scales in the past, similar to what has occurred over the past 4-7 years.
3.2 Infrared
Variability is also evident in mid-infrared lightcurves. Gaia 19ajj is well-detected in data from both the primary WISE mission (Wright et al., 2010) and the NEOWISE Reactivation mission (Mainzer et al., 2014).
The 3.4 and 4.6 m (W1 and W2) profile-fit photometry for Gaia 19ajj was drawn from the WISE All-Sky, 3-Band Cryo, Post-Cryo and NEOWISE Reactivation Single-exposure Source Databases. Measurements were used only from exposures for which the image quality parameter qual_frame was greater than zero, and on which the source lies more than 50 pixels from the image edge. Gaia 19ajj is formally saturated in all WISE/NEOWISE images, requiring additional attention in order to present quality photometry. Specifically, the profile-fit photometry of saturated sources exhibits a flux-dependent bias of varying degrees. Therefore, we derived and applied corrections, now published555Section II.1.c.iv.a of the Explanatory Supplement to the NEOWISE Data Release Products (Cutri et al., 2015)., to the Source Database magnitudes in order to compensate for the photometric bias.
The median values of the corrected W1 and W2 magnitudes for each observation epoch were computed. The uncertainties associated with each median magnitude are the standard deviation of the population of the corrected magnitudes within each epoch. These values are typically slightly smaller than the median of the uncertainties (error) of the individual corrected magnitudes that include the contribution of the systematic uncertainties of the photometric bias corrections. WISE/NEOWISE photometry is provided in Table 2.
| MJD | (MJD) | W1 | (W1) | error(W1) | W2 | (W2) | error(W2) |
|---|---|---|---|---|---|---|---|
| day | day | mag | mag | mag | mag | mag | mag |
| 55320.08 | 0.404 | 7.324 | 0.031 | 0.051 | 6.044 | 0.025 | 0.066 |
| 55511.16 | 0.363 | 7.131 | 0.047 | 0.086 | 5.950 | 0.057 | 0.107 |
| 56782.13 | 0.351 | 7.577 | 0.028 | 0.058 | 6.237 | 0.073 | 0.101 |
| 56785.19 | 0.316 | 7.533 | 0.025 | 0.062 | 6.243 | 0.055 | 0.102 |
| 56973.14 | 0.361 | 7.981 | 0.044 | 0.036 | 6.415 | 0.028 | 0.084 |
| 56976.18 | 0.279 | 7.982 | 0.016 | 0.036 | 6.414 | 0.037 | 0.083 |
| 57143.97 | 0.387 | 7.760 | 0.019 | 0.043 | 6.360 | 0.044 | 0.085 |
| 57337.97 | 0.347 | 7.759 | 0.025 | 0.044 | 6.294 | 0.047 | 0.097 |
| 57502.94 | 0.301 | 7.836 | 0.027 | 0.041 | 6.414 | 0.045 | 0.083 |
| 57702.24 | 0.376 | 7.508 | 0.028 | 0.065 | 6.214 | 0.068 | 0.104 |
| 57863.50 | 0.342 | 7.538 | 0.046 | 0.062 | 6.172 | 0.092 | 0.107 |
| 58066.31 | 0.343 | 7.274 | 0.065 | 0.096 | 6.021 | 0.118 | 0.117 |
| 58069.14 | 0.365 | 7.237 | 0.065 | 0.103 | 5.982 | 0.093 | 0.117 |
| 58223.95 | 0.327 | 7.086 | 0.119 | 0.127 | 5.857 | 0.122 | 0.126 |
| 58232.40 | 0.016 | 7.200 | 0.017 | 0.110 | 5.894 | 0.005 | 0.122 |
| 58433.38 | 0.329 | 7.062 | 0.152 | 0.127 | 5.849 | 0.117 | 0.126 |
| 58590.92 | 0.313 | 6.851 | 0.171 | 0.127 | 5.811 | 0.111 | 0.131 |
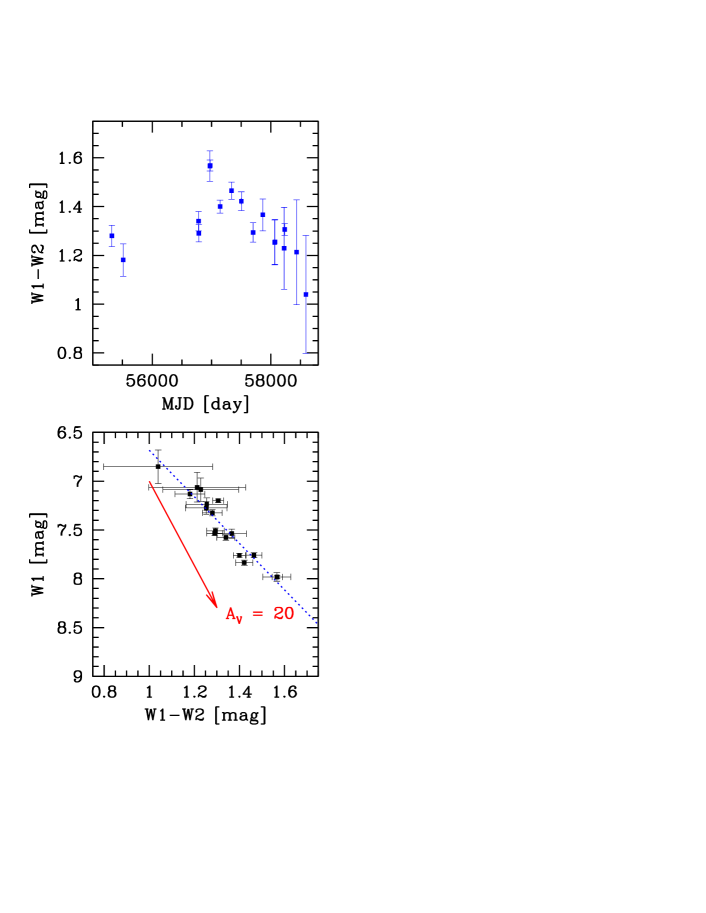
As illustrated in Figure 3, the WISE data points from 2010 are relatively bright, while NEOWISE measured fading between 2014 May and November, then gradual brightening from about MJD57000 to the present. There is superposed variability that generally traces the pattern of the optical fluctuations, but at lower amplitude. The cumulative brightening since 2014 November is about 1.2 mag in W1 (3.6 m) compared to mag in G (0.67 m).
Figure 4 shows the WISE/NEOWISE color curve which indicates that the source has been getting gradually bluer since about MJD57000, while it has become brighter (Figure 3). Figure 4 also shows that there is a direct and tight correlation between color and magnitude. However, a least-squares fit indicates that the magnitude-color slope is relatively shallow at with rms=0.10 mag. This can be compared to the slope of 4.31 expected for interstellar extinction (Indebetouw et al., 2005, adopting the Spitzer extinction law as approximately correct for the WISE bands). If interpreted as extinction, the total color change would correspond to mag. However, there is more color change than expected given the magnitude change, which suggests that at least some of the blueing behavior is intrinsic to the source and not just extinction clearing.
This shallow color slope is also apparent in the near-infrared. As discussed below, comparing the changes in vs between 2MASS and new IRTF photometry shows larger change relative to than would be expected under standard interstellar reddening assumptions. As noted above, the SED also shows an inconsistency between the large change in optical brightness relative to only a small change in optical color.
3.3 Lightcurve Assessment
Both the Gaia lightcurve and the NEOWISE lightcurve exhibited quasi-periodic behavior over the few years prior to the recent steep optical rise. Then, starting in early 2018 and continuing into 2019, the slope changed and Gaia 19ajj brightened by another several magnitudes (3.5 in the optical and 1 in the infrared). The optical slope was -0.31 mag/month over about 10 months.
The optical and mid-infrared lightcurve evidence for wavelength-dependent, long term photometric brightening that is punctuated by brief fading events, suggests that extinction variability may be an important consideration in interpreting the behavior of Gaia 19ajj. However, extinction variations are not the entire story. Accretion variability is driving some of the brightening and blueing, which also has the effect of reducing the amount of dust, and thereby diminishing the line-of-sight extinction. This is the same interpretation as is invoked for several better-studied sources with well-characterized large-amplitude and long-timescale lightcurves, like V2492 Cyg and PV Cep (see discussion in §6).
4 NEW INFRARED PHOTOMETRY
Gaia 19ajj was observed in JHKL’ bands on the night of 3 February, 2019 (UT) using the slit viewing camera of SpeX (Rayner et al., 2003) at the NASA Infrared Telescop Facility. Conditions were photometric and the source was observed at an airmass of 1.85 resulting in FWHM=0.92”, which is sampled at 0.12” pixel-1. The filters in SpeX are in the MKO photometric system (Simons & Tokunaga 2002). We observed UKIRT faint standard FS 123 for the JHK flux calibration, and HD 84800 for the L’ flux calibration. For each image, we subtracted off a dark then divided by a normalized sky flat. We then subtracted the median sky value from each image, and aligned and coadded the frames together. Aperture photometry was done with imexam in IRAF using a target aperture radius of 20, 23, and 26 pixels, a buffer of 10 pixels, and a sky annulus 10 pixels wide. Since the non-destructive reads and coadds are added together in IRTF data, we were careful to divide by the value of the DIVISOR header keyword. The resulting magnitudes were corrected for airmass using the extinction coefficients for Maunakea in Krisciunas et al. (1987).
The resulting measurements are J = 10.749; H = 9.634; K = 8.406; L’ = 7.135. The formal errors are about 0.01 mag, but the real errors are dominated by the systematics of the airmass correction, and thus larger than this.
Transformation to the 2MASS photometric system can be achieved using the equations in Connelley et al. (2007). Relative to the JHK photometry reported in the 2MASS catalog (Cutri et al., 2003), the recently measured colors of Gaia 19ajj are bluer in a manner that might indicate motion roughly along a reddening vector, with a reduction in of about 6 mag suggested. However, there is more difference relative to the difference than expected. Some of the blueing color could be caused by accretion effects rather than reduction in extinction, similar to our interpretation of the WISE/NEOWISE color changes.
5 NEW INFRARED AND OPTICAL SPECTROSCOPY
5.1 Observations
We obtained near-infrared spectra using the IRTF and SpeX (Rayner et al., 2003) on 3 February 2019 (UT) in both SXD (0.7-2.4 m) and LXD (1.7-4.2 m) modes. The resolution with the 0.5” slit was . For the SXD data the realized S/N per exposure is 80 in the Y-band and 300 in the K-band (with 10 exposures taken for 30 minutes of total exposure time). For the LXD data the S/N is 50 per exposure in L’ (with 16 exposures taken for 8 minutes of total exposure time). The K-band seeing was about 0.5” at zenith but closer to 1” for observations taken over 1.78 to 1.95 airmasses at the target position. A second SXD spectrum was obtained on 26 March 2019 (UT) under somewhat worse seeing conditions. All data were reduced with SpeXtool (Cushing et al., 2004). In addition to the spectroscopy, a small set of and broad-band images were obtained on the 26 March observing date, and show spatially extended emanating from the southeast (despite the poor seeing of ), extending to about 7.
We obtained an optical echelle spectrum between 3400-7900 Å at resolution R60,000 using the Keck I telescope and HIRES (Vogt et al., 1994) on 14 February, 2019 (UT). Data acquisition used the standard operating procedures of the California Planet Search described in Howard et al. (2010). Under temporarily clear skies and 2.0” seeing, a 1500 sec exposure resulted in a spectrum with S/N = 15 at 5500 Å. We aligned the Li I absorption feature to determine a source radial velocity of km s-1.
Finally, we obtained an infrared echelle spectrum in the 1 m Y-band region at R37,000 with the Keck II telescope and the recently upgraded (Martin et al., 2018) NIRSPEC (McLean et al., 1998) on 8 April 2019 (UT). Two rounds of A-B-B-A position nods were taken with individual exposure times of 150 sec per nod position. The seeing was 0.5-0.6” overhead, though the target was observed at 1.8 airmasses. These data were processed using the REDSPEC package666written by L. Prato, S.S. Kim, & I.S. McLean and the resulting S/N = 60 at 1.08 m.

5.2 Spectrum Characterization
Figures 5-11 illustrate some details of our spectra and are discussed in the subsections below, with the main features as follows. The Gaia 19ajj optical and infrared spectra exhibit many prominent lines that are indicative of outflowing material. There is evidence for both a neutral stellar/disk wind absorbing continuum radiation, and also shocked gas indicative of an outflowing jet. Weak metallic emission lines appear at the rest velocity.
In the optical, notably absent is strong photospheric absorption, with a few weak metallic lines identified, as discussed below. Several absorption features can be attributed to diffuse interstellar bands. In the infrared, the SXD observations in the YJHK bands indicate a red continuum with broad absorption due to molecular species. The LXD observations in L-band exhibit a flat/blue continuum shape.
5.2.1 Wind Lines
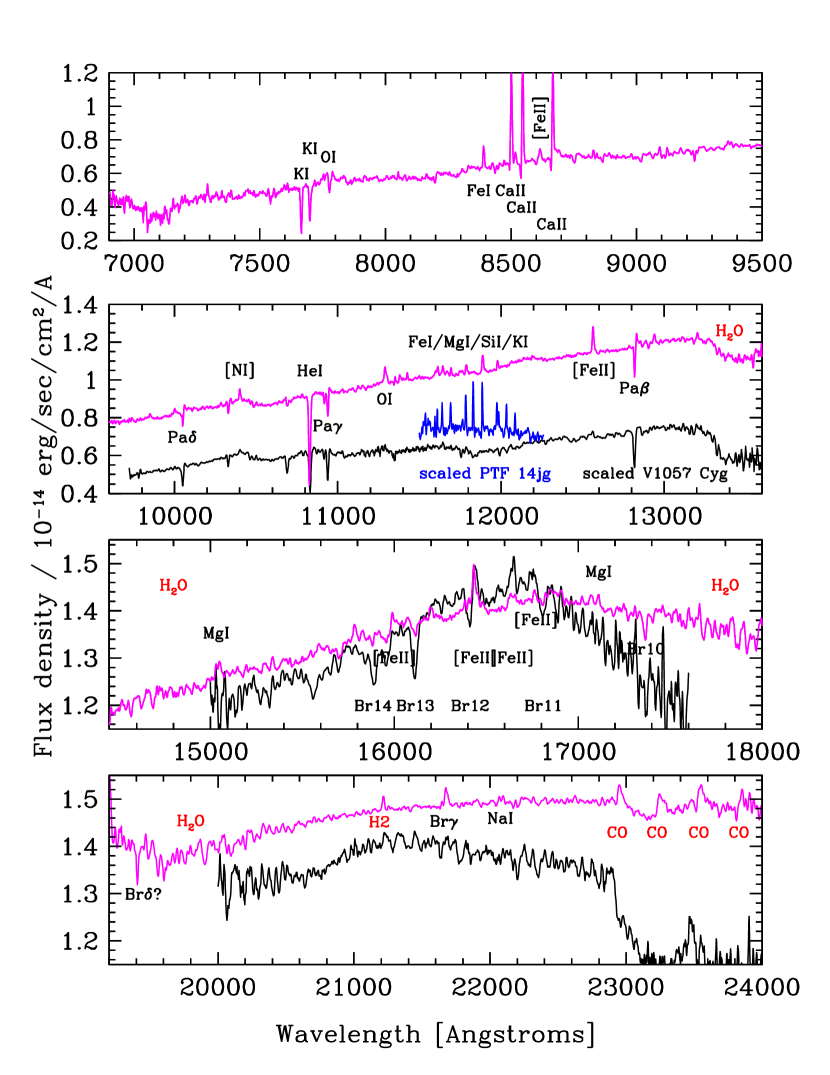
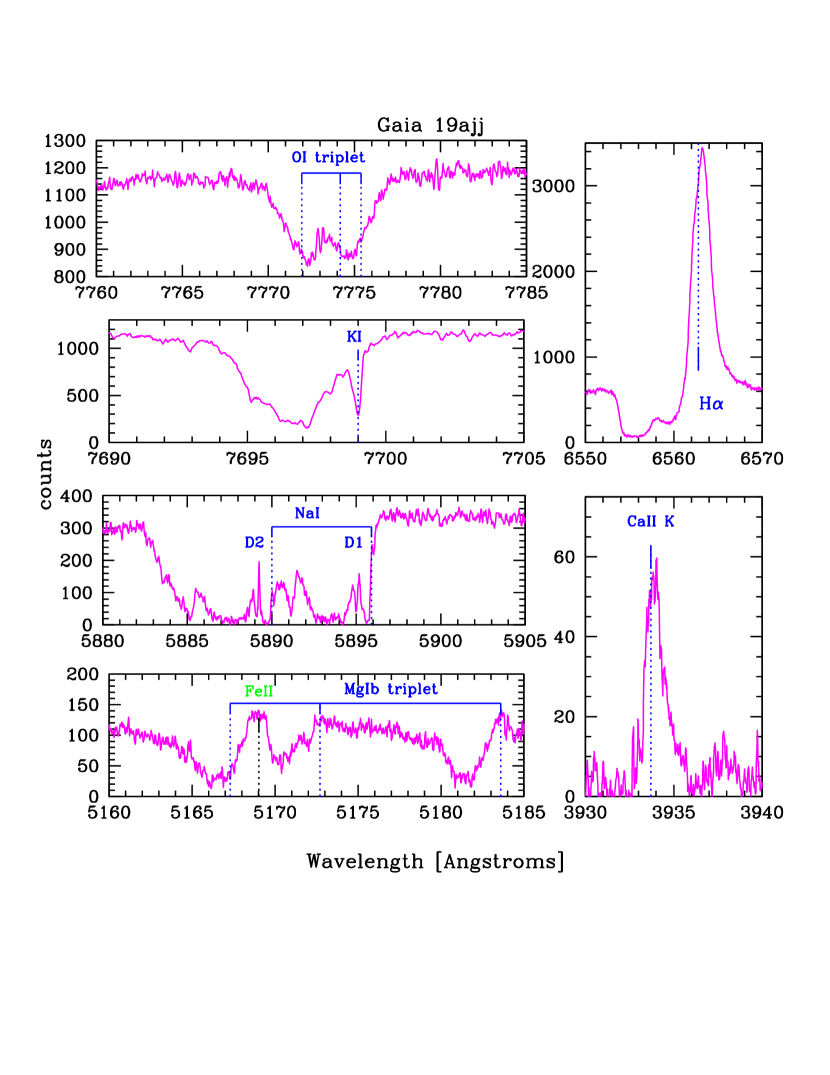
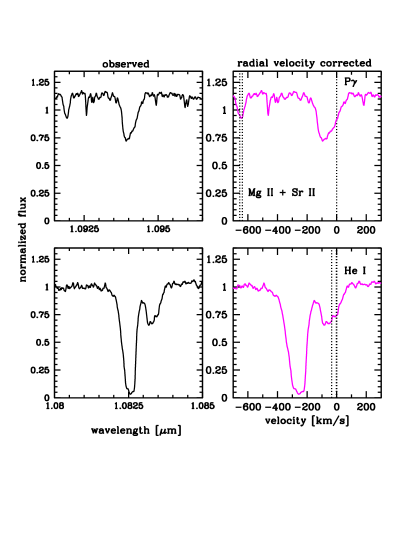
Gaia 19ajj exhibits classic P Cygni structure in the Balmer H feature, with redshifted emission peaking around km s-1 and blueshifted absorption extending to km s-1 (Figure 6). Similar structure is seen more weakly in the infrared in the Pa, Pa, and Pa lines, albeit from much lower spectral resolution (Figure 5). At Br there is simple emission, and Br and Br10 are in absorption, with very weak absorption or no sign of higher Br lines.
There is also a P Cygni signature in the Ca II “infrared” triplet lines around 8500 Å (Figure 5) that is likely present as well in the Ca II K line at 3933 Å (though masked by low S/N; Figure 6). Other lines with wind signatures in the form of purely blue-shifted absorption include: Fe II 5018, 5169, and 5316, the Mg I b triplet, the Na I D doublet, the K I 7665/7699 doublet, the O I 7774 triplet (Figure 6), and the higher excitation He I 10830 triplet (Figures 5 and 11).
The hot He I line is very strong, reaching 50% of the continuum level in the earlier SpeX spectrum and all the way to 5% of the continuum in the later NIRSPEC spectrum, with the terminal velocity around km s-1. This assumes that the rest velocity is at a heliocentric velocity of km s-1 which was the optical correction based on the Li I line, and indeed matches the location of the photospheric Mg II Sr II line in the 1m spectrum. There is no signature of a feature in either absorption or emission at He I 5876 Å, which is the next transition higher from the 10830 Å upper level, and is optically thin. The wind models of Kwan et al. (2007) which treat the He I 10830 line formation as a purely scattering process from the continuum photons are consistent with our observations. More specifically, the breadth and depth of the Gaia 19ajj line profile (Figure 11) seem to match the genre of Kwan et al. (2007) models that adopt a stellar wind geometry rather than an inner disk wind geometry. Empirically, the He I profile of Gaia 19ajj most resembles that of the strong outflow source SVS 13, as illustrated in Edwards et al. (2006).
5.2.2 Jet Lines
Shocked outflowing gas is evidenced by blueshifted and broad emission in the optical doublets of [O I], [S II], [Ca II], [Fe II], and [Ni II]. As illustrated in Figure 7, all of these lines are double-peaked with the [S II] triply peaked. In most species the higher velocity component is stronger, but in [Ca II] the lower velocity component is stronger. Uniquely for the [Ca II] doublet lines, the low-velocity peak is at zero velocity relative to the star.
In the infrared (Figure 5), jet signatures are manifest in several lines of [Fe II], along with shocked emission in the lowest energy lines. The O I line at 1.13 m is somewhat broad, and has been associated with jets in other young sources.
The [Ca II], [Ni II], [Fe II], and [S II] lines exhibited in the optical and infrared spectra of Gaia 19ajj have intermediate ionization potential, 6.1-10.4 eV. There is no evidence of the often-seen lines of [O II] or [N II] which have higher ionization (13.6-14.5 eV), suggesting moderately low temperature. The various ratios among same species lines appear consistent with intermediate density ( cm-3) – except for the [Ca II].
The [Ca II] lines are high density (Ferland & Persson, 1989; Hartigan et al., 2004; Nisini et al., 2005) and are unusual in T Tauri stars, even those showing the forbidden lines discussed above. They have been observed, however, in a number of unusual large-amplitude photometric variables such as RW Aur, V2492 Cyg (PTF 10nvg), and PTF 14jg (Hillenbrand et al., 2019), as well as in the extreme emission-line young star V1331 Cyg. As mentioned above, the [Ca II] is the only forbidden species in Gaia 19ajj having a zero-velocity component (Figure 7). The ratio of the 7291 Å to the 7324 Å is approximately 1.2:1, slightly lower than the expected 1.5:1 discussed in great detail by Hartigan et al. (2004). The [Ca II] lines are ground state transitions with their upper level populated either by collisions upward, or by downward transitions via the permitted Ca II triplet lines. If the [Ca II] occurs by fluorescence rather than collisions, this may explain both the different morphology relative to the other forbidden lines, and the slightly low doublet ratio.
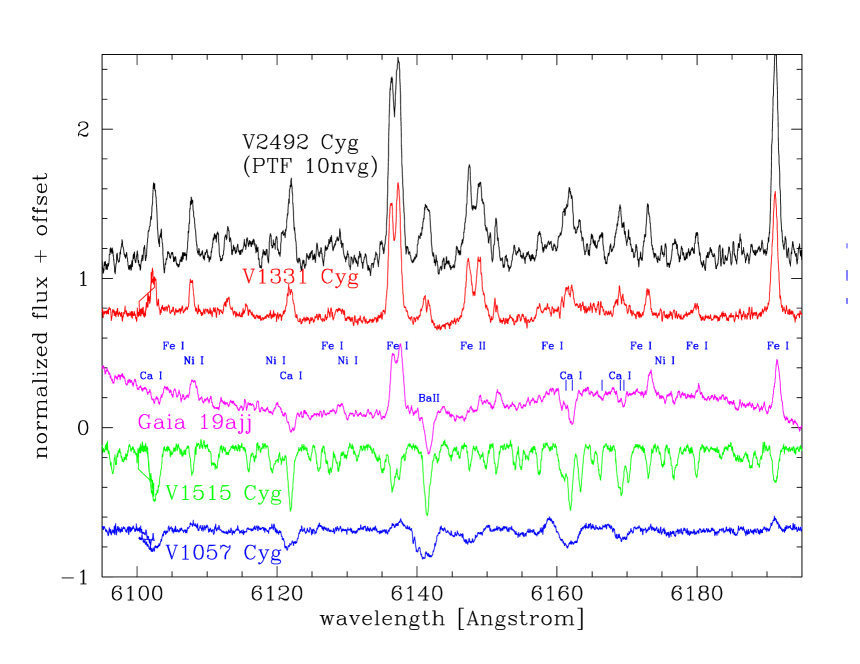
5.2.3 Narrow Emission and Weak H I Emission Lines
There is narrow rest-velocity emission in Gaia 19ajj in permitted metallic lines such as Fe I, and Ni I in the optical, as illustrated in Figure 8, There is also weak metal emission in the infrared, as illustrated in Figure 5, which shows these same species plus other lines such as Mg I and Si I in J-band and H-band, and Na I in K-band. The line strengths are generally only Å. This narrow emission spectrum is similar to that of the pre-peak spectrum of the FU Ori candidate outbursting source PTF 14jg (Hillenbrand et al., 2019), the large-amplitude accretionextinction source V2492 Cyg (PTF 10nvg) (Hillenbrand et al., 2013), as well as that of the photometrically quiet but extreme emission line star V1331 Cyg.
The infrared spectrum of Gaia 19ajj also shows weak emission in the bandheads, though perhaps superposed on troughs of absorption (see discussion below).
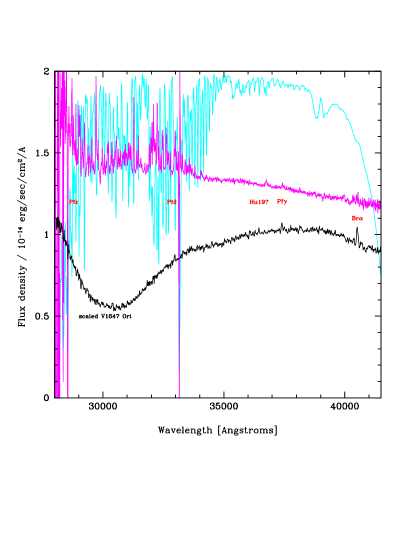
In the long wavelength spectrum (Figure 9), there is weak H I emission as evidenced by Br, Pf and Pf. There is another weak line at 3.675 m that we can not identify (The wavelength seems incorrect for Hu19 at 3.645 m and there is no corresponding Hu18 at 3.693 m). The spectrum bears some resemblance in showing these weak lines to V1647 Ori and Z CMa (Connelley & Reipurth, 2018).
5.2.4 Interpreting the Strong Emission Lines
The strongest emission in Gaia 19ajj comes from and Ca II, both associated with the accretion flow in typical young stars when these lines are strong and broad. The line has Å in its redshifted emission component, but as discussed above there is also a strong blueshifted absorption component ( Å) to the overall P-Cygni type profile, weakening the emission strength. The 8542 Å line, usually the strongest of the Ca II triplet lines, has Å (integrated flux erg s-1 cm-2 Å-1), while the 3933 Å K line, usually the stronger of the Ca II doublet, has Å (with large uncertainty due to the low S/N in the continuum in this region). Again, there is likely blueshifted absorption in the Ca II lines that reduces the emission strengths.
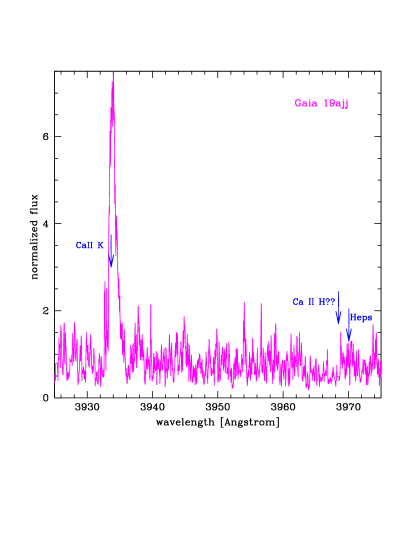
We note with some interest the complete absence of the 3968 Å H line (see Figure 10), which is highly unusual given the generally comparable fluxes of the two components of the doublet (K:H ratio in the range ) in most young accretors (e.g. Herczeg & Hillenbrand, 2008; Rigliaco et al., 2012). In active chromospheres the K:H ratio increases as the activity level decreases and also occupies the range (Houdebine, & Stempels, 1997). Suppression of the H line relative to the K line is clear in Gaia 19ajj and seems to defy the atomic physics prediction of a maximum ratio of 2 (in the optically thin case from the values). Despite the doublet ratio oddity, the three lines of the Ca II triplet, which share upper levels with the Ca II doublet, have typical ratios for young star accretors, around for the Å lines. The usual interpretation is that the triplet lines are very optically thick (c.f. the expected proportions for optically thin lines).
An explanation for the peculiar doublet ratio is that there is contaminating P Cygni structure from just 121 km/s redward of the Ca II H line. However, while is strong in Gaia 19ajj, the upper Balmer lines are weak with only hints of , , and . A complete cancellation of Ca II H emission having a strength % of the Ca II K line would require a coincidental blueshifted absorption component of equal or larger strength, but without a redshifted emission component that exceeds the very weak signal illustrated in Figure 10. We find that Herbig (1989) called attention to the same peculiarity of a lack of Ca II H despite strong Ca II K in the pre-outburst spectrum of V1057 Cyg, as well as noting it in FU Ori in the post-outburst state along with a few other unusual young stellar objects. The H line supression may be a feature of sources with strong winds having a certain temperature and column density or optical depth.
5.2.5 The Photosphere
Gaia 19ajj is compared in Figure 5 to the FU Ori type star V1057 Cyg, which shows rather prominent absorption in the 2.3 m region (Connelley & Reipurth, 2018, though weakening recently[). As noted above, Gaia 19ajj shows some signatures of emission near the bandhead regions, which turn into a drop in the continuum towards redder wavelengths due to the blended CO lines. The peculiarity of the region aside, there is resemblance of the Gaia 19ajj near-infrared spectrum with that of FU Ori stars in the prominent absorption feature, which is seen in all of the K-band, H-band, and J-bands (Connelley & Reipurth, 2018). We have two SpeX spectra taken two months apart, and they show subtle but significant changes in the overall spectrum. Specifically in this interval, the water vapor absorption bands grew stronger, resulting in a more “triangular” shape through the H-band. At the same time, the CO emission lines in the K-band became slightly weaker, while the Br and the H2 emission lines became slightly stronger. At longer wavelengths, Figure 9 shows only a flat continuum. There is no broad absorption between 2.8 and 3.3 m due to water ice, as is seen in many young embedded or Class I type stars (e.g. Connelley & Reipurth, 2018).
In terms of narrow atomic absorption, the low resolution near-infrared spectrum of Gaia 19ajj exhibits little of the absorption due to atomic lines expected in an FU Ori interpretation. Our NIRSPEC spectrum, however, does show a photospheric line (Figure 11) that can be attributed to Sr II and/or Mg II, both intermediate ionization species. Wallace et al. (2000) demonstrate that this feature is prominent in F and G type supergiants, weaker in giants, and absent in dwarfs. In the optical, aside from the hallmark Li I 6707 Å youth signature (Figure 7), the strongest rest-velocity absorption that we have identified comes from Ca I and Ba II (Figure 8). Another order contains both Ca I 5857.45 and Ba II 5853.67. It is unclear why only Ca I absorption is strongly present, and not other lines having similar excitation. One clue may be that these lines have some surface gravity sensitivity for spectral types later than mid-G (Prisinzano et al., 2012). Besides these more obvious lines, only hints of weak absorption from other neutral metals appear in the Gaia 19ajj high resolution spectrum, especially in the 5500-5900 Å region, for example species such as Si, Sc, Mg, and Fe, Ni.
Regarding Ba II, the strongest (though blended) Ba II feature at 6497 Å unfortunately is between spectral orders in our HIRES spectrum. The illustrated 6142 Å line has Å, while the 5853 Å line has Å. These equivalent widths are notably stronger than the Ba II line strengths of normal dwarf stellar photospheres (of any spectral type). These lines are known to have a positive luminosity effect, and are strong in supergiants (Andrievsky, 2006). The measured equivalent widths are about 2/3 of the line strengths seen in FU Ori, V1057 Cyg, and V1515 Cyg. While the Ba II line is typically seen in FU Ori sources, including in the recently announced objects Gaia 17bpi (Hillenbrand et al., 2018) and PTF 14jg (Hillenbrand et al., 2019), it is not present in other young stars. This is consistent with both the disk atmosphere (Hartmann & Kenyon, 1985) and the distended stellar photosphere (Petrov & Herbig, 1992) interpretation of the optical spectra of FU Ori objects, each of which are expected to produce low surface gravity spectral signatures.
6 SUMMARY OF FINDINGS AND DISCUSSION
The source Gaia 19ajj recently exhibited a large-amplitude, long term brightening event, rising in the optical by more than 5.5 mag over the past three years including over 3.5 mag in the past one year. The body of evidence suggests that the source is a young star associated with a little-studied small dark cloud located behind the Gum Nebula. The source appears to have been comparably bright about 7 years ago. Its recent color and magnitude behavior in the time domain suggests that variable extinction is part of the explanation for the slow undulative variations in the lightcurve during its overall large-amplitude rise. However, episodic accretion likely also plays a role since the lightcurve and color-curve data is inconsistent with pure extinction clearing. Furthermore, in its current bright state, the optical and infrared spectra of Gaia 19ajj exhibit strong accretion and outflow signatures. Similar to the early outburst stages of several categories of eruptive young stars, the strong wind has a rather high terminal velocity.
Some of the spectroscopic characteristics of Gaia 19ajj are FU Ori-like in nature. FU Ori stars are accretion outbursts, exhibiting large-amplitude phototometric rises over months to years, with decay times of decades to centuries. Similarities include: mild water absorption in the near-infrared, rest-velocity Ba II and Li I in the optical, and strongly blueshifted, prominent absorption in several metal lines, indicative of a strong wind. The terminal wind velocity is higher in Gaia 19ajj than in many FU Ori stars, but objects such as V1735 Cyg, Z CMa, Par 21, and V582 Aur, as well as V1647 Ori (see below) do have comparable or even larger velocities. Absent from the Gaia 19ajj spectrum, at least in its present state, are the broad atomic photospheric absorption features and the obvious spectral type change with wavelength that are typical defining characteristics of FU Ori stars. The lightcurve is also unlike that of an FU Ori, showing a previous bright phase and substantial structure in the recent photometric rise.
Some spectrosopic characteristics of Gaia 19ajj are more like those of EX Lup-type accretion bursts. EX Lup stars exhibit distinct moderate-amplitude phototometric rises over weeks to months, with decay times of months. Notably in common is the narrow atomic emission seen in both the optical and the infrared (Kóspál et al., 2011; Sicilia-Aguilar et al., 2012), with the Gaia 19ajj narrow emission somewhat weaker than generally seen in EX Lup stars. EX Lup sources lack the strong wind signatures (clear P Cygni profiles with sub-continuum blueshifted absorption) of the FU Ori stars and exhibited by Gaia 19ajj.
Finally, some of Gaia 19ajj’s spectroscopic characteristics are peculiar for either of the above outburst classes, notably the strong forbidden-line emission.
We thus look beyond these popular categories of young star brightening and develop an analogy of Gaia 19ajj to sources that have been interpreted as accretion-brightening combined with a reduction in the line-of-sight extinction along the path through the circumstellar envelope to the central young accretion system.
There are many well-known young stars that experience long-duration fades and recoveries relative to a fairly steady photometric baseline. Examples include GM Cep (e.g. Huang et al., 2019), V350 Cep (e.g. Semkov et al., 2017), and RW Aur (e.g. Koutoulaki et al., 2019), several of which exhibit UX Ori type behavior (photometric dimming events that are accompanied by reddening which turns blueward near the depths of the fades). The photometric excursions of these objects are lower amplitude than seen in the lightcurve of Gaia 19ajj, and they do not seem to exhibit signs of enhanced accretion during the bright phases777 Although this has been claimed photometrically for GM Cep, the spectroscopy of Giannini et al. (2018) indicates otherwise.. A star with a lightcurve more like that of Gaia 19ajj is HBC 340 (Dahm & Hillenbrand, 2017), which also exhibits an undulating photometric rise but, like the sources mentioned above, does not have an accompanying enhancement in the spectroscopic accretion/wind indicators.
V2492 Cyg has been characterized as a star with large-amplitude magnitude and color variations, a manifestation of extinction variations, but perhaps ultimately driven by accretion variations (see e.g. Covey et al., 2011; Kóspál et al., 2013; Hillenbrand et al., 2013; Giannini et al., 2018). A notable aspect of this source, is that in its faint state, the spectrum of V2492 Cyg is dominated by forbidden line emission formed in the jet/outflow (which becomes stronger than H as the source fades). The bright state, by contrast, features mostly lines that are formed in the magnetospheric infall region or the accretion shock. Gaia 19ajj’s bright state spectrum is not as strong or quite as rich in emission lines as V2492 Cyg, but there are definite spectral similarities (e.g. Figure 8). However, V2492 Cyg does not exhibit the molecular absorption in nor the possible region absorption that Gaia 19ajj shows (e.g. Figure 5). We also note that there is no Ba II signature in V2492 Cyg.
PV Cep is another source with large-amplitude photometric variations and also an emission-line dominated spectrum with no or very weak absorption in the optical. Over the past decade, this source experienced a 3 magnitude unsteady rise over about 5 years888See e.g. https://www.aavso.org, quite similar in timescale to Gaia 19ajj though not as large in amplitude, and similar in amplitude to V2492 Cyg but with a shorter timescale. Before this, it had experienced a flux decrease of 4 mag accompanied by a weakening of the robust Ca II triplet emission accretion indicator (Kun et al., 2011). The behavior was attributed to a combination of reduced accretion and enhanced extinction effects, the latter possibly related to changes in the inner disk structure. Lorenzetti et al. (2011) discusses the optical and infrared photometric variations of PV Cep. Caratti o Garatti et al. (2013) discuss the infrared emission line spectrum, which is much stronger than that of Gaia 19ajj, including clear CO bandhead emission and stronger jet lines (e.g. [Fe II] and ). Despite the stronger emission, the wind signatures of PV Cep appear not as prevalent as they are in Gaia 19ajj. It remains an interesting analog, however.
Comparison can also be made to V1647 Ori, which is a repeating burst source that is sometimes associated with the EX Lup category, but has larger amplitude, longer duration, and less frequent bursts than most EX Lup stars; it is perhaps best characterized as being the prototype of the V1647 Ori category. As for V2492 Cyg, while there are large color changes in V1647 Ori, extinction variations are not the dominant effect on the lightcurve (e.g. McGehee et al., 2004; Acosta-Pulido et al., 2007; Aspin & Reipurth, 2009). Further, the permitted emission lines in this source are even stronger than in V2492 Cyg or Gaia 19ajj, and there was only weak forbidden emission during the V1647 Ori outbursts. There is also no Ba II signature in V1647 Ori.
7 CONCLUSION
While it is often tempting for authors to categorize large-amplitude photometric variability in young stars in terms of known families, the variability phase space is still rather incompletely mapped. On timescales of weeks to months, there are clear differences between the variability types exhibited by Class I sources relative to those in later stages of circumstellar evolution (Class II and Class III sources), with Class I variability tending to be larger amplitude and longer timescale (Rebull et al., 2015; Wolk et al., 2018). Over months to years, both the Class I and the Class II sources can show long duration trends, as well as distinct episodic brightening events that last months to decades.
Gaia 19ajj is an example of a Class I object that is clearly a rapid accretor and driving a strong outflow. The recent photometric brightening is indeed likely driven in large part by a positive change in the accretion/outflow activity, which has also caused a reduction in the line-of-sight extinction to the central star and inner accretion zone. Although Gaia 19ajj exhibits some FU Ori-like absorption characteristics in its spectrum, notably Ba II in the optical, as well as several other low-gravity atomic lines, and broad molecular absorption in the near-infrared, it also displays EX Lup-like emission (in both the optical and the near-infrared J-band). We conclude that the best analogs may be V2492 Cyg, PV Cep, and possibly V1647 Ori, in which there are substantial changes in extinction that accompany enhanced accretion. All of these objects appear to have a repeating brightening and fading pattern on time scales of several years. It is not yet obvious to which, if any, of the above variable-accretion categories Gaia 19ajj should be associated.
8 ACKNOWLEDGMENTS
We gratefully acknowledge Simon Hodgkin for his stewardship of the Gaia Photometric Science Alerts, as well as the Gaia Photometric Science Alerts Team, DPAC, and ESA/Gaia. We also gratefully acknowledge the NASA/NEOWISE Team. Andrew Howard enabled the Keck/HIRES data acquisition. Trevor David investigated for us the potential availability of TESS data. This research has made extensive use of CDS services such as SIMBAD and Vizier. This research has benefited from consultation of the AAVSO Database; we acknowledge with thanks the variable star observations contributed there by observers worldwide.
Gaia, ASAS-SN, IRTF:SpeX, Keck:I(HIRES), Keck:II(NIRSPEC), IPHaS/VPHAS, 2MASS, WISE, NEOWISE, IRSA
References
- Acosta-Pulido et al. (2007) Acosta-Pulido, J. A., Kun, M., Ábrahám, P., et al. 2007, AJ, 133, 2020
- Ambartsumian (1949) Ambartsumian, V.A. 1949, ’Stellar Associations’, Astron. Zhour., 26, 3
- Andrievsky (2006) Andrievsky, S.M. 2006, AN, 319, 239
- Aspin & Reipurth (2009) Aspin, C., & Reipurth, B. 2009, AJ, 138, 1137
- Barentsen et al. (2013) Barentsen, G., Vink, J. S., Drew, J. E., & Sale, S. E. 2013, MNRAS, 429, 1981
- Barentsen et al. (2014) Barentsen, G., Farnhill, H. J., Drew, J. E., et al. 2014, MNRAS, 444, 3230
- Bhatt et al. (1998) Bhatt, H.C., Jain, S.K., Sagar, R. 1998, A&A, 331, 737
- Caratti o Garatti et al. (2013) Caratti o Garatti, A., Garcia Lopez, R., Weigelt, G., et al. 2013, A&A, 554, A66
- Cody et al. (2014) Cody, A. M., Stauffer, J., Baglin, A., et al. 2014, AJ, 147, 82.
- Cody & Hillenbrand (2018) Cody, A. M., & Hillenbrand, L. A. 2018, AJ, 156, A71
- Connelley et al. (2007) Connelley, M. S., Reipurth, B., & Tokunaga, A. T. 2007, AJ, 133, 1528
- Connelley & Reipurth (2018) Connelley, M. S., & Reipurth, B. 2018, ApJ, 861, A145
- Contreras Peña et al. (2019) Contreras Peña, C., Naylor, T., & Morrell, S. 2019, MNRAS, 486, 4590
- Covey et al. (2011) Covey, K. R., et al. 2011, AJ, 141, A40
- Cushing et al. (2004) Cushing, M. C., Vacca, W. D., & Rayner, J. T. 2004, PASP, 116, 362
- Cushing et al. (2005) Cushing, M. C., Rayner, J. T., & Vacca, W. D. 2005, ApJ, 623, 1115
- Cutri et al. (2003) Cutri, R. M., Skrutskie, M. F., van Dyk, S., et al. 2003, “The IRSA 2MASS All-Sky Point Source Catalog, NASA/IPAC Infrared Science Archive”.
- Cutri et al. (2015) Cutri, R. M., Mainzer, A., Conrow, T., et al. 2015, Explanatory Supplement to the NEOWISE Data Release Products.
- Dahm & Hillenbrand (2017) Dahm, S. E., & Hillenbrand, L. A. 2017, AJ, 154, 177
- Dame et al. (2001) Dame, T.M., Hartmann, D., Thaddeus, P. 2001, ApJ, 547, 792
- Dobashi (2011) Dobashi, K. 2011, PASJ, 63, S1.
- Dutra & Bica (2002) Dutra, C. M., & Bica, E. 2002, A&A, 383, 631.
- Drew et al. (2014) Drew, J. E., Gonzalez-Solares, E., Greimel, R., et al. 2014, MNRAS, 440, 2036
- Edwards et al. (2006) Edwards, S., Fischer, W., Hillenbrand, L., & Kwan, J. 2006, ApJ, 646, 319
- Ferland & Persson (1989) Ferland, G. J., & Persson, S. E. 1989, ApJ, 347, 656
- Flewelling et al. (2016) Flewelling, H. A., Magnier, E. A., Chambers, K. C., et al. 2016, arXiv:1612.05243
- Gaia Collaboration et al. (2018) Gaia Collaboration, Brown, A. G. A., Vallenari, A., et al. 2018, A&A, 616, A1
- Gárate et al. (2019) Gárate, M., Birnstiel, T., Stammler, S. M., et al. 2019, ApJ, 871, 53
- Giannini et al. (2018) Giannini, T., Munari, U., Antoniucci, S., et al. 2018, A&A, 611, A54
- Giannini et al. (2018) Giannini, T., Munari, U., Lorenzetti, D., et al. 2018, Research Notes of the American Astronomical Society, 2, 124
- Gum (1955) Gum, C.S. 1955, Mem. R.A.S., 67, 155
- Gutermuth et al. (2009) Gutermuth, R. A., Megeath, S. T., Myers, P. C., et al. 2009, ApJS, 184, 18
- Hartigan et al. (2004) Hartigan, P., Edwards, S., & Pierson, R. 2004, ApJ, 609, 261
- Hartley et al. (1986) Hartley, M., Manchester, R. N., Smith, R. M., et al. 1986, A&AS, 63, 27.
- Hartmann & Kenyon (1985) Hartmann, L., & Kenyon, S. J. 1985, ApJ, 299, 462
- Hartmann & Kenyon (1996) Hartmann, L., & Kenyon, S. J. 1996, ARA&A, 34, 207
- Hartmann et al. (2016) Hartmann, L., Herczeg, G., & Calvet, N. 2016, ARA&A, 54, 135.
- Hauschildt et al. (1999) Hauschildt, P. H., Allard, F., Ferguson, J., Baron, E., & Alexander, D. R. 1999, ApJ, 525, 871
- Herbig (1946) Herbig, G. H. 1946, PASP, 58, 163.
- Herbig (1952) Herbig, G. H. 1954, J. RASC, 46, 222
- Herbig (1957) Herbig, G. H. 1957, in IAU Symp. No. 3 on “Non-Stable Stars”, ed. G.H. Herbig, Cambridge Univ. Press, 3
- Herbig (1977) Herbig, G. H. 1977, ApJ, 217, 693
- Herbig (1989) Herbig, G. H. 1989, European Southern Observatory Conference and Workshop Proceedings, 33, 233
- Houdebine, & Stempels (1997) Houdebine, E. R., & Stempels, H. C. 1997, A&A, 326, 1143
- Lorenzetti et al. (2011) Lorenzetti, D., Giannini, T., Larionov, V. M., et al. 2011, ApJ, 732, 69
- Petrov & Herbig (1992) Petrov, P. P., & Herbig, G. H. 1992, ApJ, 392, 209
- Herbst et al. (1994) Herbst, W., Herbst, D. K., Grossman, E. J., et al. 1994, AJ, 108, 1906.
- Herbst, & Shevchenko (1999) Herbst, W., & Shevchenko, V. S. 1999, AJ, 118, 1043.
- Herczeg & Hillenbrand (2008) Herczeg, G. J., & Hillenbrand, L. A. 2008, ApJ, 681, 594
- Herter et al. (2008) Herter, T. L., Henderson, C. P., Wilson, J. C., et al. 2008, Proc. SPIE, 7014, 70140X
- Hillenbrand et al. (2013) Hillenbrand, L. A., Miller, A. A., Covey, K. R., et al. 2013, AJ, 145, A59
- Hillenbrand & Findeisen (2015) Hillenbrand, L. A., & Findeisen, K. P. 2015, ApJ, 808, 68
- Hillenbrand et al. (2018) Hillenbrand, L. A., Contreras Peña, C., Morrell, S., et al. 2018, ApJ, 869, A146
- Hillenbrand et al. (2019) Hillenbrand, L. A., Miller, A. A., Carpenter, J. M., et al. 2019, ApJ, 874, 82
- Hodgkin et al. (2013) Hodgkin, S. T., Wyrzykowski, L., Blagorodnova, N., & Koposov, S. 2013, RSPTA, 371, 20120239
- Howard et al. (2010) Howard, A. W., Marcy, G. W., Johnson, J. A., et al. 2010, Science, 330, 653
- Huang et al. (2019) Huang, P. C., Chen, W. P., Mugrauer, M., et al. 2019, ApJ, 871, A183
- Ibryamov et al. (2015) Ibryamov, S. I., Semkov, E. H., & Peneva, S. P. 2015, PASA, 32, e021
- Indebetouw et al. (2005) Indebetouw, R., Mathis, J. S., Babler, B. L., et al. 2005, ApJ, 619, 931
- Ishihara et al. (2010) Ishihara, D., Onaka, T., Kataza, H., et al. 2010, A&A, 514, A1
- Ismailov (2005) Ismailov, N. Z. 2005, Astronomy Reports, 49, 309
- Joy (1945) Joy, A.H. 1945, ApJ, 102, 168
- Kóspál et al. (2011) Kóspál, Á., Ábrahám, P., Goto, M., et al. 2011, ApJ, 736, 72
- Kóspál et al. (2013) Kóspál, Á., Ábrahám, P., Acosta-Pulido, J. A., et al. 2013, A&A, 551, A62
- Koutoulaki et al. (2019) Koutoulaki, M., Facchini, S., Manara, C. F., et al. 2019, A&A, 625, A49
- Kun et al. (2011) Kun, M., Szegedi-Elek, E., Moór, A., et al. 2011, MNRAS, 413, 2689
- Kwan et al. (2007) Kwan, J., Edwards, S., & Fischer, W. 2007, ApJ, 657, 897
- Maehara et al. (2014) Maehara, H., Kojima, T., & Fujii, M. 2014, ATel, #6770
- Mainzer et al. (2014) Mainzer, A., Bauer, J., Cutri, R. M., et al. 2014, ApJ, 792, A30
- Martin et al. (2018) Martin, E. C., Fitzgerald, M. P., McLean, I. S., et al. 2018, Ground-based and Airborne Instrumentation for Astronomy VII, Proc. SPIE, 10702, 107020A
- Marton et al. (2016) Marton, G., Tóth, L. V., Paladini, R., et al. 2016, MNRAS, 458, 3479.
- May et al. (1988) May, J., Murphy, D.C., Thaddeus, P. 1988, A&A Sup., 73, 51
- McGehee et al. (2004) McGehee, P. M., Smith, J. A., Henden, A. A., et al. 2004, ApJ, 616, 1058
- McLean et al. (1998) McLean, I.S., Becklin, E.E., Bendiksen, O., et al. 1998, Proc. SPIE, 3354, 566
- Monet (1998) Monet, D. 1998, USNO-A2.0, U.S. Naval Observatory, Flagstaff Station.
- Monet et al. (2003) Monet, D. G., Levine, S. E., Canzian, B., et al. 2003, AJ, 125, 984
- Mutafov et al. (2019) Mutafov, A. S., Semkov, E. H., Ibryamov, S. I., & Peneva, S. P. 2019, AIP Conf. Ser., 2075, 090004
- Nisini et al. (2005) Nisini, B., Bacciotti, F., Giannini, T., et al. 2005, A&A, 441, 159
- Parker et al. (2005) Parker, Q.A., Phillips, S., Pierce, M.J. et al. 2005, MNRAS, 362, 689
- Pettersson et al. (1987a) Pettersson, B. 1987a, A&A, 171, 101
- Pettersson et al. (1987b) Pettersson, B. 1987b, A&A Supp., 70, 69
- Planck Collaboration et al. (2011) Planck Collaboration, Ade, P. A. R., Aghanim, N., et al. 2011, VizieR Online Data Catalog , VIII/88.
- Price et al. (2001) Price, S. D., Egan, M. P., Carey, S. J., Mizuno, D. R., & Kuchar, T. A. 2001, AJ, 121, 2819
- Prisinzano et al. (2012) Prisinzano, L., Micela, G., Sciortino, S., Affer, L., & Damiani, F. 2012, A&A, 546, A9
- Rayner et al. (2003) Rayner, J. T., Toomey, D. W., Onaka, P. M., et al. 2003, PASP, 115, 362
- Rebull et al. (2015) Rebull, L. M., Stauffer, J. R., Cody, A. M., et al. 2015, AJ, 150, 175
- Reipurth (1983) Reipurth, B. 1983, A&A, 117, 183
- Reipurth (2016) Reipurth, B. 2016, Institute for Astronomy Special Publications, 1. http://ifa.hawaii.edu/SP1
- Reipurth & Aspin (2010) Reipurth, B., & Aspin, C. 2010, in Evolution of Cosmic Objects through their Physical Activity, ed. H.A. Harutyunian, A.M. Mickaelian, and Y. Terzian. VAOA Conf. 19
- Reipurth et al. (2012) Reipurth, B., Aspin, C., & Herbig, G. H. 2012, ApJ, 748, L5
- Rigliaco et al. (2012) Rigliaco, E., Natta, A., Testi, L., et al. 2012, A&A, 548, A56
- Rodgers et al. (1960) Rodgers, A.W., Campbell, C.T., Whiteoak, J.B. 1960, MNRAS, 121, 103
- Schlafly et al. (2018) Schlafly, E. F., Green, G. M., Lang, D., et al. 2018, ApJS, 234, 39
- Semkov et al. (2017) Semkov, E. H., Ibryamov, S. I., & Peneva, S. P. 2017, Bulgarian Astronomical Journal, 27, 75
- Shappee et al. (2014) Shappee, B. J., Prieto, J. L., Grupe, D., et al. 2014, ApJ, 788, A48
- Sicilia-Aguilar et al. (2012) Sicilia-Aguilar, A., Kóspál, Á., Setiawan, J., et al. 2012, A&A, 544, A93
- Skrutskie et al. (2006) Skrutskie, M. F., Cutri, R. M., Stiening, R., et al. 2006, AJ, 131, 1163
- Vogt et al. (1994) Vogt, S. S., Allen, S. L., Bigelow, B. C., et al. 1994, Proc. SPIE, 2198, 362
- Wallace et al. (2000) Wallace, L., Meyer, M. R., Hinkle, K., et al. 2000, ApJ, 535, 325
- Werner et al. (2004) Werner, M. W., Roellig, T. L., Low, F. J., et al. 2004, ApJS, 154, 1
- Westerlund et al. (1963) Westerlund, B.E. 1963, MNRAS, 127, 71
- Wolk et al. (2018) Wolk, S. J., Günther, H. M., Poppenhaeger, K., et al. 2018, AJ, 155, 9
- Wright et al. (2010) Wright, E. L., et al. 2010, AJ, 140, 1868
- Zacharias et al. (2005) Zacharias, N., Monet, D. G., Levine, S. E., et al. 2005, VizieR Online Data Catalog, I/297