Entropy-driven impurity-induced nematic-isotropic transition of liquid crystals
Abstract
Phase behavior of liquid crystals is of long-standing interest due to numerous applications, with one of the key issues being how the presence of impurities affects the liquid crystalline order. Here we study the orientational order of 4-cyano-4-pentylbiphenyl (5CB) and 4-cyano-4-hexylbiphenyl (6CB) nematic liquid crystals in the presence of varying concentrations of water and n-hexane molecules serving as impurities, by carrying out both fully atomistic simulations and experiments. Our results reveal that mixing of the impurities (in case of hexane) with the host liquid crystals causes a nematic-to-isotropic phase transition with hexane concentration as the control parameter while demixing (in case of water) results in only weak impurity-induced perturbations to the nematic liquid-crystalline order. We develop a coarse-grained model illustrating the general nature and entropic origin of the mixing-induced phase transition.
Liquid crystals (LCs) are recognized as a fascinating class of soft condensed matter because of their counter-intuitive behavior with fluidity and long range-ordering Prost (1995). LCs and their phase behavior are relevant both in many natural systems, as well as for a wide range of technological applications. For instance, many features observed in living systems are reminiscent of liquid crystalline texture and to model them a description of liquid crystalline order is taken into account Bouligand (2008); Rey (2010). From application perspective, while LCs were originally employed in flat panel displays Stannarius (2009), they are currently considered also in lots of other applications, including organic electronics Nazarenko et al. (2010), optics, nano-/micro manipulation Lagerwall and Scalia (2012), electronics, bio-sensing Shiyanovskii et al. (2005), novel composites, and compact lenses Li et al. (2006). All of those applications rely on the orientationally ordered state of the LCs called the nematic phase Martire and Dowell (1979); Shah et al. (2008); Chen et al. (2008); Sidky et al. (2018); Poulin et al. (1997).
While pure nematic LCs are widely studied, the properties of LC-based complex fluids, i.e., mixtures of LCs and other components, are less investigated even if related applications exist Poulin et al. (1997). In such systems new features can arise due to combining physical properties of each element or from new structural organizations Prost (1995). Yamamoto et al. Yamamoto and Tanaka (2001) have studied mixtures of water, 5CB LCs and surfactants, and observed a novel phase, labeled the ’transparent nematic’ phase, where on large scales the LC system appears isotropic while locally exhibiting nematic order. Poulin et al. Poulin et al. (1997) have observed an intriguing colloidal interaction, originating from the balance of dipole-dipole attractive and defect-mediated repulsive interactions which leads to the formation of chains of water droplets in nematic host-5CB LCs. Organization of anisotropic 1D nano-materials Hegmann et al. (2007); Bisoyi and Kumar (2011) or carbon nanotubes Dierking et al. (2004) dispersed in thermotropic LCs is the focus of current research because controlling the order in such systems leads to novel electro-optical applications. In these systems, nematic order of the LCs induces order of the anisotropic particles. However, phase behaviour of LCs can be modified when anisotropic molecules/colloids are dispersed in the LC medium. To understand such phase behaviour, Katleen et al. Denolf et al. (2007) performed experiments with 4-n-octyl-4-cyanobiphenyl (8CB) LCs in the presence of cyclohexane and water and measured the nematic-to-isotropic phase transition temperature. A linear decrease of the transition temperature is observed as the mole fraction of cyclohexane is increased while water weakly affects the transition temperature. These results were explained using macroscopic arguments based on Landau-de Gennes theory along with an additional term coupling order parameter and mole fraction of the added impurities. Yet, at this stage, description of the relevant microscopic mechanisms are largely missing in the literature as it is difficult to observe experimentally such phase transitions at the atomistic or molecular level.
In this article, we combine fully atomistic simulations and experiments to show how nematic orientational order of the LCs is influenced by the presence of various concentrations of impurities of different kinds. We start by performing atomistic simulations of a typical LC, 4-cyano-4-hexylbiphenyl (6CB). Two types of impurities mixed with the 6CB LC in its nematic phase are considered: water, which is an associative liquid, and hexane, which is non-associative. Our results show that water tends to form droplets within the LC, and hence does not significantly affect the nematic order of the LC. In contrast to this, adding hexane will lead to strong mixing of hexane and the LC, resulting in an impurity-induced nematic-to-isotropic transition at a critical hexane concentration. These numerical predictions are then confirmed by experiments with a similar system: 5 CB LCs mixed with different concentrations of water or hexane. Finally, a coarse-grained model is developed to extract the main physical features responsible for our results, illustrating the entropic origin of the impurity-induced nematic-to-isotropic transition. Our main result is twofold: (i) Ordering of LCs is only weakly perturbed by impurities which phase separate into droplets, while impurities mixing with the LCs may induce a nematic-isotropic phase transion, and (ii) such mixing and demixing within the LC host is driven simply by the presence or absence of attractive interactions between the impurity molecules.
Several efforts have been made to simulate properties of liquid crystal systems such as 4-cyano-4-alkylbiphenyl (nCB). In particular, the so-called odd-even effect in nematic-isotropic transition was recently reproduced up to a satisfactory level of accuracy in computer simulations Tiberio et al. (2009). In the present study we simulate 6CB, but homologues should lead to qualitatively similar results. To construct the atomistic models of 6CB and hexane molecules, we use force field parameters from Refs. Adam et al. (1997); Cheung et al. (2002); Jana et al. (2018). For water, the SPC/E model is employed. Details of the force fields are given in the Supplemental Material. With this model, molecular dynamics simulations are performed with a time step of 1 fs. At the initial state, the system is randomly disposed in a large simulation box of linear dimensions = 70 Åand equilibrated at a high temperature of K for ps under NVT conditions. Then, the temperature is reduced with a constant rate to the target temperature . Calculations are finally performed for another ns under NPT conditions at 1 atm and results are computed from time-averaging over the last ns.

To characterize the resulting LC configurations, the order parameter of the LCs is computed as the maximum eigenvalue of the average ordering tensor ,
| (1) |
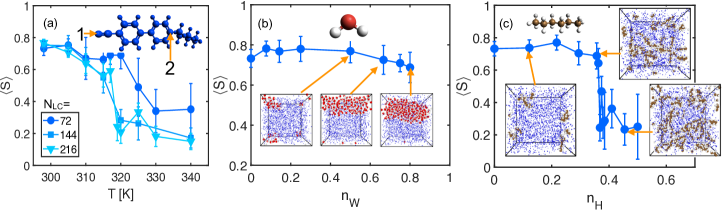
where are the Cartesian components of the unit vector of the LC molecule , is the number of LC molecules, and is the Kronecker delta. Here, the unit vector of the LC molecule is taken to be parallel to the line connecting the atom 1 and atom 2 as shown in the inset of Fig.1(a). With this formulation, having a large value of means that most of the LCs are oriented in the same direction.
Before studying the influence of impurities, the temperature-dependent orientational order of pure 6CB LC is characterized in Fig.1(a). In particular, a typical nematic to isotropic transition is observed as the temperature increases starting from the low-temperature nematic phase. The largest studied system contains LC molecules and exhibits a transition at K. In what follows, the influence of impurities is studied at room temperature ( K) where the pure system remains nematic. In general, one expects a ’phase diagram’ , with the impurity concentration.
When adding increasing numbers of water molecules to the system of LC molecules, the LCs have a strong tendency to demix with water resulting in formation of water droplets of different sizes at different water concentrations ; large, system-spanning droplets at large water concentrations appear as ’tubes’ due periodic boundaries, see the insets of Fig.1(b). It is well-established that water molecules form intermolecular hydrogen bonds of energy 23.4 KJ mol-1 Suresh and Naik (2000) between electronegative oxygen and electropositive hydrogen atoms via which a network stretching throughout the liquid is constructed and a droplet is formed Errington and Debenedetti (2001). Fig.1(b) shows that the presence of such water droplet(s) only slightly perturbs the ordering of the LCs. On the other hand, when adding hexane to the initially nematic LC, the scenario is completely different. Indeed, hexane and liquid crystals strongly mix due to hexane being a non-polar molecule because of 2 factors: (i) the only C-H bond present in hexane is non-polar due to the very similar electronegativities, and (ii) hexane is symmetric such that any polarity in the molecule would cancel out. Therefore, the only intermolecular force acting in hexane are induced dipole-dipole forces or van der Waals forces/London dispersion forces which are weak and short-ranged, preventing the aggregation of hexane in the LC medium, see the inset of Fig.1(c). This mixing of the hexane impurities with the LC molecules results in a sharp nematic-to-isotropic transition at a critical hexane concentration of , see Fig.1(c).
In order to confirm these numerical predictions of how ordering of LC molecules is affected by the presence of water and hexane, experiments are carried out. 4-cyano-4-pentylbiphenyl (5CB) instead of 6CB was studied to emphasize the universality of the observed mechanisms. At 299 K, the pure system exhibits clear nematic ordering which is characterized by a turbid white color. Upon heating, the system becomes transparent, implying a transition from the nematic to the isotropic phase, see the insets of Fig.2(d). In order to quantitatively probe this transition, nile blue molecules are added to the system as their fluorescence properties are sensitive to the LC micro-environment Tajalli et al. (2008). Indeed, the nile blue emission intensity is higher in the isotropic phase because of either an increased fluorescence absorption or a change in the dipole-moment orientation in the optically excited state.
First, in the pure LC solution, the fluorescence emission signal increases upon heating as seen in Fig.2(a). Note that upon cooling the 5CBs from 315 K to 299 K, the reverse behavior is also observed. In Fig.2(d), the nematic to isotropic phase transition of 5CB is observed at approximately 307 K (comparable to the previous experiment Shim et al. (2011)), which is close to our atomistic simulation results and therefore confirms the accuracy of our modeling. Upon addition of water to the LC system we again observe a good agreement with the atomistic simulations as no significant evolution of the fluorescence emission with water concentration is spotted [Fig.2(c)]. Furthermore, water droplets can also be seen in the experiments [inset of Fig.2(e)]. Finally, as predicted by our atomistic simulations, an impurity-induced nematic-to-isotropic transition is observed when adding hexane molecules at a fixed temperature of 299 K(Fig.2(b)). The transition is sharp, and occurs at about 20 l of added hexane in 325 l of 5CB, which translates into of 0.12 (Fig.2(e)). In comparison to the atomistic simulations with 6CB, the transition occurs at a lower hexane concentration. Such a difference is expected to result from the small difference between the molecular chain length of 5CB and 6CB, differences in the reduced temperature in the simulations and experiment, as well as from some inherent impurities of the commercial 5CB studied (98% pure). Overall, the key features predicted by our atomistic simulations are well-reproduced in experiments.
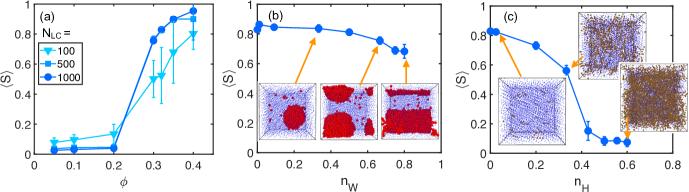
To better understand the difference between water and hexane in LCs observed both in atomistic simulations and experiments, we develop and study a coarse-grained model of our LC-impurity system Chen et al. (2014); Tian et al. (2001). The model ignores many molecular details, focusing on the role of energy and entropy in the phase behaviour, and allows to avoid finite-size effects as we can easily simulate much larger systems of up to 1000 LC molecules, see Fig. SM3 in the Supplemental Material. In the model, LC molecules are modeled as 8 purely repulsive hard-sphere beads. The number of beads is adjusted in order to match the size ratio between 6CB and water molecules. Each bead of a LC molecule interacts with the beads of the other molecules using a cut-and-shifted Lennard-Jones (LJ) potential including only the repulsive part. Intra-chain beads interact via a harmonic potential with a high spring constant of for both stretching and angle coefficients such that the chains behave like rigid rods. The hexane molecules are modeled like the LCs but with 3 beads instead of 8. Water molecules are considered as attractive particles using the same cut-and-shifted LJ potential as above but with a larger cutoff. As such, by defining as the length parameter of the LJ potential and thus the size of a water molecule, the only remaining parameter is the employed cutoff which is equal to 1.122 for the repulsive interaction (hard sphere) and 2.5 for the attractive interaction (water). For the purely repulsive particles, temperature scale is not relevant. Therefore, NVE simulations are used in order to prevent any issues due to adding a thermostat. Attractive water molecules are simulated using the NVT ensemble with in order to reasonably describe water at 300K Lam and Lutsko (2018), with the Boltzmann constant. At the initialization step, particles are randomly disposed inside a large simulation box that is reduced using a fixed compression rate in order to match the target packing fraction (with is the volume of the box, is the radius and the number of beads within each LC which is equal to 8) which plays the role of the inverse temperature in our hard-sphere model (notice that increasing and inverse temperature both lead to a decrease of entropy) Sanz et al. (2011); LCs interacting via hard interactions with as the control parameter have been studied by several groups to explore the phase behaviour of LCs Williamson and Jackson (1998); Vroege and Lekkerkerker (1992); Onsager (1949). Then, simulations are continued for steps to reach equilibrium. We point out that while in attractive systems ordering transitions can be obtained by both concentration increase or a decrease in temperature, in purely repulsive systems they can be observed only by using concentration as the control parameter.
This model is able to reproduce the isotropic-nematic transition of the pure LCs by increasing instead of reducing temperature [Fig. 3(a)]. Notice that analogously to what was found in our atomistic simulations, there is a shift and rounding of the the transition (a finite size effect) when the number of molecules is reduced. From here, we choose to work at which is large enough to be located in the nematic phase without suffering from equilibration issues that emerge at larger packing fractions. The agreement with atomistic simulations and experiments continues in the presence of coarse-grained water molecules (Fig. 3(b)). This can be expected as similarly to the full atomistic simulations, also here formation of water droplets with the LC is observed, originating from the attractive part in the water-water interaction potential [compare Fig. 3(b) with Fig. 1(b)]. Finally, adding coarse-grained hexane randomly dispersed within the LC medium perturbs the LC order parameter similarly to our observations in the atomistic simulations and experiments, resulting in an impurity-induced nematic-isotropic transition at [Fig. 3 (c)].
In conclusion, we studied the influence of adding impurities to a nematic LC system using both atomistic simulations and experiments. Depending on the nature of the impurities, two distinct behaviors are observed. For water, droplet formation (phase separation) takes place resulting in only weak perturbations to the nematic LC order, while for hexane, no demixing is observed and a sharp decrease of the nematic order parameter is found for large enough hexane concentrations. These results suggest a more general conclusion: adding non-mesogenic impurities should induce a nematic-to-isotropic phase transition only when the impurities mix with the host LCs. This picture is supported by the results from our coarse-grained model, where the structural complexity of the molecules is reduced by modelling them as rigid hard chain-type (LC and hexane) or single-bead (water) molecules. The model thus highlights the crucial role of the presence or absense of mixing of the impurities with the LCs in determining if the impurities are able to significantly perturb the LC order, and that in the case of the purely repulsive coarse-grained LC-hexane model, the impurity-induced nematic-isotropic transition is mostly driven by entropic effects. Hence, this work not only contributes to the overall understanding of the role of impurities mixed with LCs, but also provides a benchmark for controlling LC phase behavior by the addition of non-interacting impurities.
We acknowledge the support of the Academy of Finland through the Centres of Excellence Programme (2012-2017, project no. 251748; PKJ, MJA and LL), the FiDiPro Programme (project no. 13282993, PKJ), and an Academy Research Fellowship (project no. 268302, LL). JL acknowledges financial support of the Fonds de la Recherche Scientifique - FNRS. We acknowledge the computational resources provided by the Aalto University School of Science “Science-IT” project, CSC (Finland), Consortium des Equipements de Calcul Intensif (CECI), and the Fédération Lyonnaise de Modélisation et Sciences Numériques (FLMSN).
J.L. and N.P. contributed equally to this work.
References
- Prost (1995) J. Prost, The Physics of Liquid Crystals, Vol. 83 (Oxford university press, 1995).
- Bouligand (2008) Y. Bouligand, Comptes Rendus Chimie 11, 281 (2008).
- Rey (2010) A. D. Rey, Soft Matter 6, 3402 (2010).
- Stannarius (2009) R. Stannarius, Nat. Mater. 8, 617 (2009).
- Nazarenko et al. (2010) V. Nazarenko, O. Boiko, M. Anisimov, A. Kadashchuk, Y. A. Nastishin, A. Golovin, and O. Lavrentovich, Appl. Phys. Lett. 97, 284 (2010).
- Lagerwall and Scalia (2012) J. P. Lagerwall and G. Scalia, Curr. Appl. Phys. 12, 1387 (2012).
- Shiyanovskii et al. (2005) S. Shiyanovskii, O. Lavrentovich, T. Schneider, T. Ishikawa, I. Smalyukh, C. Woolverton, G. Niehaus, and K. Doane, Mol. Cryst. Liq. Cryst. 434, 259 (2005).
- Li et al. (2006) G. Li, D. L. Mathine, P. Valley, P. Äyräs, J. N. Haddock, M. Giridhar, G. Williby, J. Schwiegerling, G. R. Meredith, B. Kippelen, S. Honkanen, and N. Peyghambarian, Proc. Natl. Acad. Sci. U.S.A. 103, 6100 (2006).
- Martire and Dowell (1979) D. Martire and F. Dowell, J. Chem. Phys. 70, 5914 (1979).
- Shah et al. (2008) H. J. Shah, A. K. Fontecchio, D. Mattia, and Y. Gogotsi, J. Appl. Phys. 103, 064314 (2008).
- Chen et al. (2008) X. Chen, B. D. Hamlington, and A. Q. Shen, Langmuir 24, 541 (2008).
- Sidky et al. (2018) H. Sidky, J. J. de Pablo, and J. K. Whitmer, Phys. Rev. Lett. 120, 107801 (2018).
- Poulin et al. (1997) P. Poulin, H. Stark, T. Lubensky, and D. Weitz, Science 275, 1770 (1997).
- Yamamoto and Tanaka (2001) J. Yamamoto and H. Tanaka, Nature 409, 321 (2001).
- Hegmann et al. (2007) T. Hegmann, H. Qi, and V. M. Marx, J. Inorg. Organomet. Polym. Mater. 17, 483 (2007).
- Bisoyi and Kumar (2011) H. K. Bisoyi and S. Kumar, Chem. Soc. Rev. 40, 306 (2011).
- Dierking et al. (2004) I. Dierking, G. Scalia, P. Morales, and D. LeClere, Adv. Mater. 16, 865 (2004).
- Denolf et al. (2007) K. Denolf, G. Cordoyiannis, C. Glorieux, and J. Thoen, Phys. Rev. E 76, 051702 (2007).
- Kobinata et al. (1986) S. Kobinata, T. Kobayashi, H. Yoshida, A. Chandani, and S. Maeda, J. Mol. Struct. 146, 373 (1986).
- Vieweg et al. (2010) N. Vieweg, C. Jansen, M. K. Shakfa, M. Scheller, N. Krumbholz, R. Wilk, M. Mikulics, and M. Koch, Opt. Express 18, 6097 (2010).
- Tiberio et al. (2009) G. Tiberio, L. Muccioli, R. Berardi, and C. Zannoni, ChemPhysChem 10, 125 (2009).
- Adam et al. (1997) C. Adam, S. Clark, G. Ackland, and J. Crain, Phys. Rev. E 55, 5641 (1997).
- Cheung et al. (2002) D. Cheung, S. Clark, and M. R. Wilson, Phys. Rev. E 65, 051709 (2002).
- Jana et al. (2018) P. K. Jana, W. Chen, M. J. Alava, and L. Laurson, Phys. Chem. Chem. Phys. 20, 18737 (2018).
- Suresh and Naik (2000) S. Suresh and V. Naik, J. Chem. Phys. 113, 9727 (2000).
- Errington and Debenedetti (2001) J. R. Errington and P. G. Debenedetti, Nature 409, 318 (2001).
- Tajalli et al. (2008) H. Tajalli, A. G. Gilani, M. Zakerhamidi, and P. Tajalli, Dyes and Pigments 78, 15 (2008).
- Shim et al. (2011) T. Shim, S. Kim, D. Kim, and M. Oh-e, J. Appl. Phys. 110, 063532 (2011).
- Chen et al. (2014) W. Chen, S. Kulju, A. S. Foster, M. J. Alava, and L. Laurson, Phys. Rev. E 90, 012404 (2014).
- Tian et al. (2001) P. Tian, D. Bedrov, G. D. Smith, and M. Glaser, J. Chem. Phys. 115, 9055 (2001).
- Lam and Lutsko (2018) J. Lam and J. F. Lutsko, J. Chem. Phys. 149, 134703 (2018).
- Sanz et al. (2011) E. Sanz, C. Valeriani, E. Zaccarelli, W. C. K. Poon, P. N. Pusey, and M. E. Cates, Phys. Rev. Lett. 106, 215701 (2011).
- Williamson and Jackson (1998) D. C. Williamson and G. Jackson, J. Chem. Phys. 108, 10294 (1998).
- Vroege and Lekkerkerker (1992) G. J. Vroege and H. N. Lekkerkerker, Rep. Prog. Phys. 55, 1241 (1992).
- Onsager (1949) L. Onsager, Ann. N. Y. Acad. Sci. 51, 627 (1949).
![[Uncaptioned image]](/html/1910.05628/assets/x4.png)
![[Uncaptioned image]](/html/1910.05628/assets/x5.png)
![[Uncaptioned image]](/html/1910.05628/assets/x6.png)
![[Uncaptioned image]](/html/1910.05628/assets/x7.png)
![[Uncaptioned image]](/html/1910.05628/assets/x8.png)