X-ray signatures of the polar dusty gas in AGN
Abstract
Recent mid-infrared interferometry observations of nearby active galactic nuclei (AGN) revealed that a significant part of the dust emission extends in the polar direction, rather than the equatorial torus/disk direction as expected by the traditional unification model. We study the X-ray signatures of this polar dusty gas with ray-tracing simulations. Different from those from the ionized gas, the scattered emission from the polar dusty gas produces self-absorption and neutral-like fluorescence lines, which are potentially a unique probe of the kinematics of the polar dusty gas. The anomalously small ratios of type II AGN observed previously can be naturally explained by the polar dusty gas, because the polar emission does not suffer from heavy absorption by the dense equatorial gas. The observed Si lines of the Circinus galaxy and NGC 1068 show blue-shifts with respect to the systemic velocities of the host galaxies, consistent with an outflowing scenario of the Si K-emitting gas. The 2.5-3 keV image of the Circinus galaxy is elongated along the polar direction, consistent with an origin of the polar gas. These results show that the polar-gas-scattered X-ray emission of type II AGN is an ideal objective for future X-ray missions, such as Athena.
keywords:
atomic processes – galaxies: Seyfert – individual galaxies: the Circinus galaxy and NGC 10681 Introduction
The traditional unification model of active galactic nuclei (AGN) assumes an axisymmetric dusty torus that obscures the accretion disk and the broad-line region when the system is observed edge-on (e.g. Antonucci, 1993). Recent mid-infrared (IR) interferometry observations of nearby AGN revealed that a significant part of the dust emission extends in the polar direction, instead of the equatorial torus direction (for a recent review, see Burtscher et al., 2016). The Circinus galaxy and NGC 1068 are the two best studied sources, for which multiple components are dissected (Tristram et al., 2014; López-Gonzaga et al., 2014). This polar dust component could be the inner wall of a torus (Tristram et al., 2014), or a dusty wind driven by radiation pressure (Hnig et al., 2012) or by magnetocentrifugal force (Vollmer et al., 2018). For the wind scenario, the polar dust could be distributed along the walls of a hollow cone (Hnig et al., 2013; Stalevski et al., 2017). Single-dish mid-IR images of local AGN show ubiquitous evidences of extended emission on tens to hundreds pc scales along the polar direction (e.g. Asmus et al., 2016, and references therein). The polar dust component is also evidenced by its effect on IR SED (e.g. Lyu & Rieke, 2018). The optical depth of the polar dust can not be too large, otherwise the emission produced in the ionization cone would be strongly depleted. In some sources (e.g. NGC 1068, Antonucci et al., 1994), the optical polarization was observed to be wavelength independent on scale, implying that the electron scattering is the dominant scattering mechanism. It indicates that the polar dust distribution on such scales might be clumpy.
In this paper we study X-ray signatures of this polar dusty gas, which might be observable for obscured/type II AGN, especially for Compton-thick sources, where the direct X-ray emission of AGN is heavily obscured (e.g. Comastri, 2004). In fact, both the Circinus galaxy and NGC 1068 are Compton-thick.
When X-ray photons interact with matter, they can be absorbed or scattered. Photons absorbed by inner-shell ionization can further lead to the emission of fluorescence photons. The scattered X-ray spectrum is characterized by a Compton hump (around 10-30 keV) and a series of fluorescent lines, with Fe (6.4 keV) being the most prominent one, due to the high abundance and high fluorescence yield of iron. As a result, the fluorescence lines can be used to probe the geometrical distribution and kinematics of the gas surrounding the X-ray sources. Many calculations of scattered X-ray emission have been done assuming an accretion disk or a torus (e.g. George & Fabian, 1991; Magdziarz & Zdziarski, 1995; Murphy & Yaqoob, 2009; Liu & Li, 2014; Tanimoto et al., 2019). While the torus/disk is likely being Compton-thick, the polar dusty gas has a relatively low column density. Therefore, the polar gas will mainly affect the low-energy X-ray emission. Most importantly, the emission of the polar gas in obscured AGN can reach the observer directly, without being obscured by the dense equatorial gas. As a result, the polar dusty gas can produce much stronger low-energy emission in edge-on viewing angles compared with the equatorial gas. While the Fe lines have been extensively studied for toridal geometries (e.g. Ricci et al., 2014), the X-ray signatures of a polar dusty gas are rarely studied and compared with observations. Liu et al. (2016) measured the fluorescence line ratios of for a sample of nearby obscured AGN and found that they are an order of magnitude lower than those predicted by clumpy torus models. In other words, the observed Si lines are much stronger than what would be expected by the equatorial torus gas. In principle, the polar dusty gas could explain these anomalous fluorescence line ratios.
The importance of scattered X-ray emission from the ionized wind in type II AGN (which shown as warm absorbers in type I AGN) was recognized from early days (e.g. Krolik & Kriss, 1995). The ionized winds of AGN have been extensively studied (e.g. Proga et al., 2000), with recent studies also involving dusty winds (e.g. Dorodnistyn et al., 2016; Chan & Krolik, 2017; Williamson et al., 2019). The existence of dust within warm absorbers has been reported (e.g. Lee et al., 2001; Mehdipour & Costantini, 2018). The polar dusty gas could be the dusty and densest part of the dusty winds. Different from those from the ionized wind, the scattered emission from the polar dusty wind will be absorbed by the dusty wind itself, and neutral-like fluorescence lines will be produced. The fluorescence characteristic of the dusty wind is of special interests, because the X-ray fluorescence lines are potentially a powerful probe of the kinematics of the dusty wind, which is crucial to tell the physical nature and possible effects of the dusty wind. It is generally hard to obtain the kinematic information of dusty gas from infrared observations, as thermal dust emission lacks sharp line features.
2 Gas model and simulation method

For the equatorial gas we use the generally adopted clumpy model (e.g. Nenkova et al., 2008a; Hnig & Kishimoto, 2017). Since the equatorial component is likely to be a disk (e.g. the Circinus galaxy was observed to have a disk-like emission with a size of pc by Tristram et al., 2014), we refer to it as ”disk” below. The clumps are distributed according to a radial power law (, within a region of and ) and a Gaussian distribution in the elevation direction (]), where is the half-opening angle and is the angular extent of the disk (Figure 1). The total number of clumps () is determined by , the mean number of clumps along a radial path in the equatorial plane, and the radius of clumps . Finally, the density of individual clumps () completes the description. and can be combined as the average column density of a clump ().
The inner boundary is determined by the distance at which the dust sublimates for a given AGN luminosity. We adopt pc, corresponding to a luminosity erg s-1 (Kishimoto et al., 2007). is taken to be 10, as inferred from the clumpy modeling of infrared observations (Nenkova et al., 2008b). The density distribution index if the gravitational potential is dominated by a black hole and for a stellar cluster (e.g. Beckert & Duschl, 2004). We set , consistent with that inferred by Nenkova et al. (2008b). We take and , the typical values inferred by Nenkova et al. (2008b). The clump column density is set to be cm-2, providing a Compton-thick obscuration ( cm-2) along the radial path in the equatorial plane. The sky covering factor of the angular extent of is about 0.4. The total simulated clump number is 37000 (with pc), and the volume filling factor in the equatorial plane is (). Reflected X-ray emission of clumpy tori have been studied previously (e.g. Liu & Li, 2014; Tanimoto et al., 2019). Liu & Li (2014) found that the volume filling factor only slightly influences the reflected spectra, while the total column density and the mean number of clumps () can significantly affect the reflected emission. This is because the sky covering factor of a clumpy torus is . That is, the reflected emission is not restricted to the absolute size scale and only sensitive to the total column density, the mean number of clumps, and the angular distribution.
Following Hnig & Kishimoto (2017), we model the polar gas component (referred as ”wind” below) as a hollow cone, which is characterized by a radial distribution (, within and ), an half opening angle (), and an angular width . Similar to the equatorial clumps, the clumps in the hollow cone are described by the mean number of clumps along a radial path and the average clump column density . Since the observed polar dust emission is more extended than the equatorial one (e.g. the polar component of the Circinus galaxy has a size of pc inferred by Tristram et al., 2014), we adopt a larger region of pc for the polar wind. The other parameters are set as pc, , , , , and cm-2, corresponding to a wind column density of cm-2 along a radial path. The total number of clumps in the hollow cone is 12000 (with pc). An illustration of the simulated geometry is shown in Figure 1. We note that the adopted configuration is a general representation of a compact disk plus a polar wind, not corresponding to a real system. Generally the observed mid-infrared interferometry radii of AGN are 10-20 times larger than the dust sublimation radii measured from near-IR dust reverberation mapping (Burtscher et al., 2013). If the spatial extent of the wind is much larger than that of the disk, the scattered emission by the wind would not depend much on the presence of the disk. Thus, we also simulate the situation of a wind and a disk alone. The dependences of the scattered emission on different parameters are studied in §3.2.
We use RefleX code developed by Paltani & Ricci (2017) to perform the simulations. RefleX is a ray-tracing code designed for the study of propagation of X-ray photons in the matter surrounding an X-ray source. RefleX can model a large variety of matter geometries, which are defined by the user using an arbitrary number of simple geometrical building blocks. RefleX implements a photon-by-photon Monte Carlo simulation: Each X-ray photon is emitted following a user-specified spectral distribution and a user-specified geometrical distribution; it is then propagated through the surrounding medium, undergoing repeatedly all the usual processes that take place in the X-ray domain, namely Compton and Rayleigh scattering, photoelectric absorption and fluorescence emission, until the photon is either destroyed, or escapes the simulated object, in which case it can be used to build spectra or images. RefleX has been validated by comparison with existing models, like pexmon (Magdziarz & Zdziarski, 1995) or MYTorus (Murphy & Yaqoob, 2009). We refer to Paltani & Ricci (2017) for more details. The simulation presented here assume a power-law input spectrum with a photon index of 1.8 in the keV energy range (e.g. Nandra & Pounds, 1994). All atoms are assumed to be neutral in the simulation. The gas composition is assumed to be the Solar abundances from Anders & Grevesse (1989).
3 Simulation Results
3.1 Spectral results
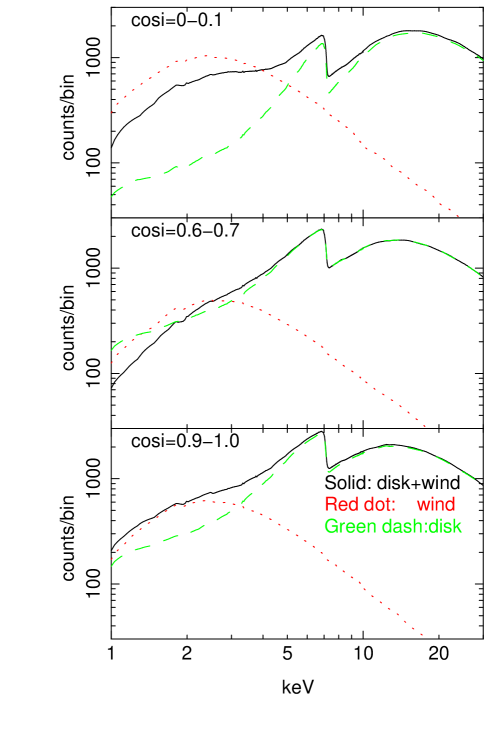
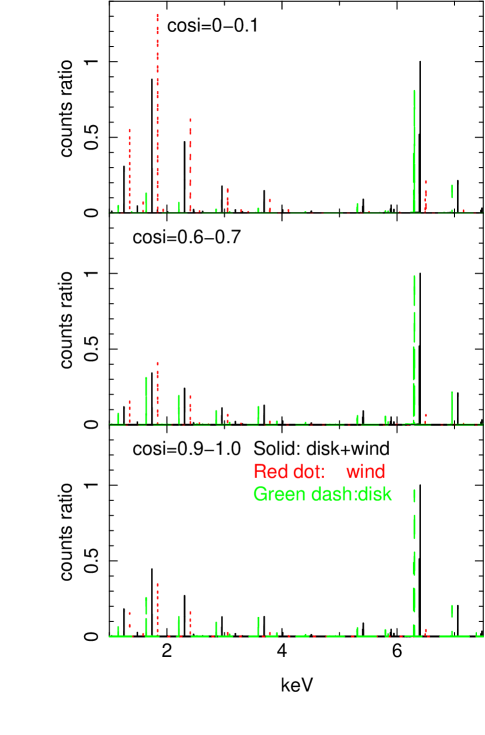
As noted in the introduction, the scattered X-ray emission by a dusty wind would have different characteristics from that by an ionized wind, as a dusty wind produces self-absorption and neutral-like fluorescence lines. To study the scattered X-ray signature of the polar dusty wind, we have calculated the scattered X-ray emission for geometries of disk, wind, and disk+wind, separately. In this section we present the results of the default setting listed in §2, and their dependences on adopted parameters are studied in §3.2. The resulting continuum and fluorescence lines at different inclination angles for different geometries are plotted in the left and right panels of Figure 2, respectively.
The most notable difference between the disk+wind model and the disk model occurs for inclination angles around 90 degrees, i.e., viewing the system edge-on. As can be seen from the left panel of Figure 2, for , the emission below 5 keV is 5-10 times stronger in the disk+wind model than in the disk model. The reason is that the emission of the polar wind above the disk can reach the observer directly, suffering no heavy absorption by the dense equatorial gas. The emission of the wind model below 5 keV is about twice that of the disk+wind model. This is because in the disk+wind model, the emission of the inner part of the wind component is absorbed by the disk component. On the other hand, the high energy end of the scattered emission of the disk+wind model is dominated by the disk component. This is expected, since the scattering of high-energy photons is more effective for large column densities. The self-absorption of the wind is seen as the drop of the scattered continuum of the disk model below 2 keV.
For (similar to the direction of the hollow cone ), the spectrum of the disk+wind model is similar to that of the disk model, except at the lowest energy ( keV), where the spectrum of the disk+wind model is a little weaker than that of the disk model. This is due to the extra absorption provided by the wind component.

For , the face-on viewing angles, the flux of the disk+wind model spectrum is also higher than that of the disk model spectrum, but only with a factor of 2. Compared with the case of , the contribution of the wind component is a little higher. It is because for face-on viewing angles, the absorption by the wind component is less effective.
The corresponding fluorescence lines (right panel of Figure 2) show a similar trend as the scattered continuum. For example, the Si photons in edge-on angles of the disk+wind model are 6 times more abundant than those of the disk model, and most of the Si photons are produced by the wind component. Note that % Si photons of the wind component are absorbed by the disk component, while the Fe photons of the disk+wind model are close to the sum of the wind and the disk components.
The line ratios of for the disk and disk+wind models are plotted in Figure 3, along with the observed ranges () measured from nearby type II AGN (Liu et al., 2016). As can be seen, in edge-on viewing angles, the ratio of the disk model is 5-10 times larger than the observed values, while the ratio of the disk+wind model is about 20, consistent with the observed values. The dependences of the results on different parameters are studied in next section.
3.2 Spectral results: parameter study
Since the scattered emission of AGN looks prominent only for type II AGN, the intrinsic continuum of which are heavily obscured, we focus on edge-on viewing angles below. In this case, the exact spectrum of the disk+wind model depends on the modelling of the spatial extent of the disk and wind. For example, if the disk has a smaller angular extent (, corresponding to a smaller covering factor), the emission of the inner part of the wind will be less absorbed by the disk. The same is true if the wind has a larger spatial extent (a larger ). As an approximation, for edge-on angles, the resulting spectrum of the disk+wind model can be treated as the sum of the emission from the disk and the wind material above the disk. Therefore, for simplicity, we will present a parameter study of the wind component only and do not considering the disk. The effects of different configurations of a clumpy disk/torus have been studied in the literatures (e.g. Liu & Li, 2014; Tanimoto et al., 2019).
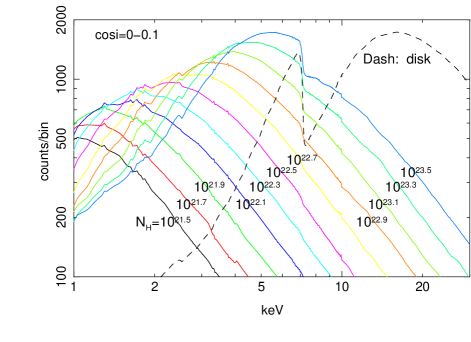

First, to study the effect of the material extent of the polar wind, we simulate the wind model with different wind column densities between and cm-2 by changing the clump density. The results of edge-on viewing angles are plotted in the left panel of Figure 4. As can be seen, the scattered high energy emission increases with the column density of the wind, while the emission at low energy end decreases with the column density of the wind, due to absorption. As a result, the peak of the scattered emission increases with the column density of the wind. We note that even with a wind column density as low as cm-2, the wind component dominates over the disk component for energies below 3 keV. The emission of the wind is comparable to that of the disk around 5-7 keV for a wind column density cm-2. While for a wind column density around cm-2, the wind starts to dominate for energies within keV. These results clearly show that the wind component can contribute significantly to the X-ray spectrum of type II AGN.
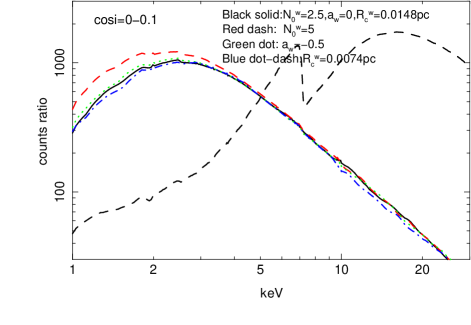
To estimate the effect of different wind column densities on ratios, we added the Fe and Si fluxes from the disk model to those of the wind model of different wind column densities. The result is plotted in the right panel of Figure 4. As can be seen, the ratios first decrease with the wind column density within cm-2, reach a minimum ratio (10) around cm-2, and then increase with the wind column density within cm-2. A column density of cm-2 corresponds to an optical depth for photons with energy around the Si K region. A higher column density will result in more Si photons when the optical depth is smaller than 1 and will produce more absorption when the optical depth is above 1. This behavior is also shown in the scattered continuum, which is highest around cm-2 at energies 1.8 keV, as seen in the left panel of Figure 4. Overall, the resulting ratios are within , only slightly depending on the wind column density.
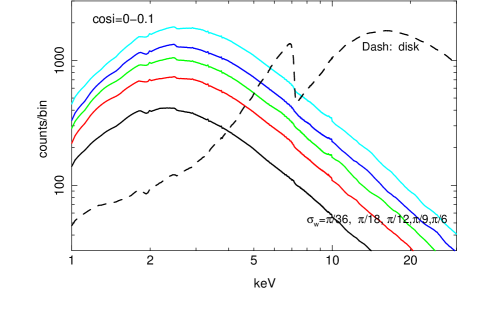
Second, to study the effect of the angular extent of the polar wind, we adopt different angular widths of the wind, with ,, , , and . The results are shown in the left panel of Figure 5. All the other parameters are kept as the default. As can be seen, the scattered X-ray emission increases with the angular extent of the wind. The ratios also increase with the angular extent. While for energies below 3 keV, the effect of the stronger absorption caused by the larger angular extent is also seen.
Finally, to study the effect of the clumpiness of the wind, we simulate one case with a higher clump number of . The clump density () is reduced by a factor of 2 to keep the wind column density the same as the default value. The result is plotted as the red dash line in the right panel of Figure 5. It looks quite similar to the default case, except below 3 keV, where the scattered emission is a little higher than that of the default case. We also simulate the wind model with a wind distribution index and a smaller clump radius pc. The results are also plotted in the right panel of Figure 5. These two parameters hardly affect the scattered emission.
3.3 Morphological results
As shown in §3.1, when viewing the disk+wind model in edge-on angles, the wind and disk components dominate the low-energy ( keV) and high-energy ( keV) parts of the scattered X-ray emission, respectively. This can also be seen in the morphology of the emission at different energies. In Figure 6 we plot the simulated maps of Fe and keV photons with inclination angles of . These simulated maps are plotted in physical scale, not in angular scale, just intended to show the different morphologies of the scattered emission from different components. The real angular extent of the polar-gas-scattered X-ray emission should be similar to those revealed by mid-infrared interferometry observations. As can be seen, the inner part of the Fe map follows the elliptical contours of the equatorial disk component; while the keV map is bipolar and traces the hollow conic wind component. That is, the polar-gas-scattered X-ray emission has an elongation similar to the emission-line-dominated soft X-ray emission produced in the ionization cone. This reflects the fact that the low-energy photons are dominated by the scattered emission of the polar wind. The polar wind also produce Fe photons, but with a level much fainter than those from the disk. It is interesting to note that the largest angular size of the polar winds revealed by mid-infrared interferometry ( for the Circinus galaxy) is similar to the sub-pixel spatial resolution of Chandra. We will discuss the observational evidence of polar-gas-scattered X-ray emission in next section.
4 Observational evidences
4.1 Spectral evidences
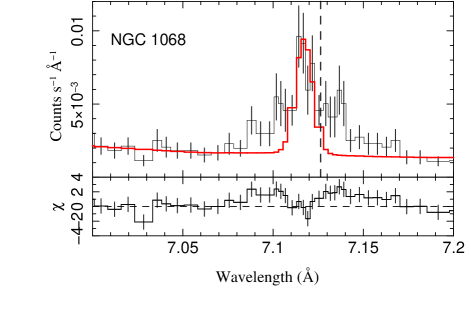
As shown in previous section, the polar dusty gas produces strong X-ray fluorescence lines, such as the Si line at 1.74 keV, for edge-on viewing angles. If the dusty gas is in an outflowing-wind mode, the fluorescence lines will show blue-shifts with respect to the systemic velocities of the host galaxies. The receding side of the wind is likely to be obscured, as indicated by the one-side ionization cones and the one-side polar dust emission for the Circinus galaxy (Tristram et al., 2014; Stalevski et al., 2017) and NGC 1068 (López-Gonzaga et al., 2014). In the soft X-ray band, Chandra High Energy Transmission Grating (HETG, Canizares et al., 2005) provides the best currently available spectral resolution of 0.012 Å(full width half maximum, FWHM), and the line centroids can be measured with an accuracy 0.1 times of FWHM ( Å), corresponding to a velocity shift of km s-1 (Ishibashi et al., 2006).
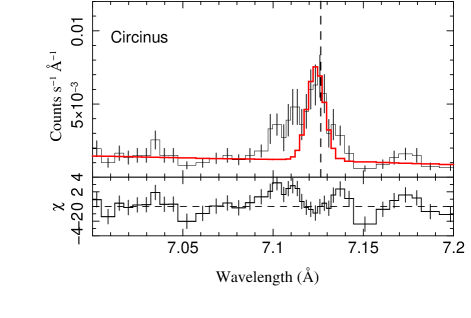
The Si lines of the Circinus galaxy and NGC 1068 have been studied with Chandra HETG observations in the literature (e.g Sambruna et al., 2001; Ogle et al., 2003; Kallman et al., 2014; Liu, 2016), but no detailed redshifts were compared with the host galaxies. For convenience, we replot the Chandra HETG spectra of the Si line of the Circinus galaxy and NGC 1068, corrected for the systemic redshifts of the host galaxies (0.00145 and 0.00379, respectively), in Figure 7. All the archive Chandra HETG data are used. The data are reprocessed following the standard process with tgcat script111http://tgcat.mit.edu(Huenemoerder et al., 2011), except that the zero-order centroids are determined from photons within keV, to avoid the possible contamination by off-center soft X-ray emission. (We noted that the Si lines presented in Liu (2016) were corrected for the redshifts of the Si lines, not the systemic redshifts of the host galaxies.) As can be seen in Figure 7, the Si peaks are blue-shifted with respect to the systemic velocities of the host galaxies, although the photon statistics are limited (the photon counts around the Si peaks are about 80 and 50, for the Circinus galaxy and NGC 1068, respectively). If we fit a narrow Gaussian line (with a fixed width of 0.003 Å) to the Si peaks, we obtain redshifts of and , for the Circinus galaxy and NGC 1068, respectively (for a confidence level of 90%). They correspond to outflow velocities of and km s-1, respectively. The residuals around 7.11 Å are likely due to the Mg XII line, while those around 7.14 Å are less obvious. These results are consistent with an outflowing scenario of the Si K-emitting gas.
4.2 Morphological evidences
With a sub-pixel spatial resolution (Li et al., 2004), Chandra can directly reveal the circumnuclear region of nearby Compton-thick AGN through scattered hard continuum ( keV) and Fe lines (Fabbiano, 2019). Flattened hard continuum and Fe lines (200 pc), perpendicular to the ionization cone, were found in NGC 4945 (Marinucci et al., 2012, 2017). Marinucci et al. (2013) found a clumpy Fe distribution in the Circinus galaxy. A clumpy material distribution was also revealed in NGC 1068 (Marinucci et al., 2016). Double-peaked Fe lines (separated by 36 pc), both of which displaced from the centroid of keV photons, were discovered in ESO 428-G014 (Fabbiano et al., 2019). Especially interesting is that an elongated Fe feature ( pc, but not in the keV continuum map), similar to that of the CO(2-1) ALMA image, was discovered in NGC 5643, and both the Fe and the CO lines could be originated from the obscuring torus (Fabbiano et al., 2018). These results are consistent with the existence of thick obscuring gas along the equatorial plane.
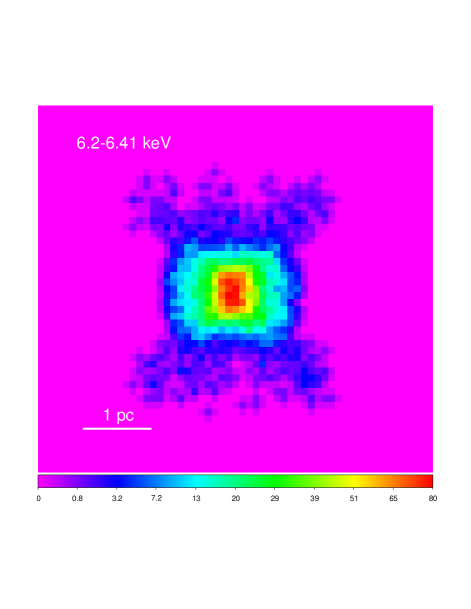
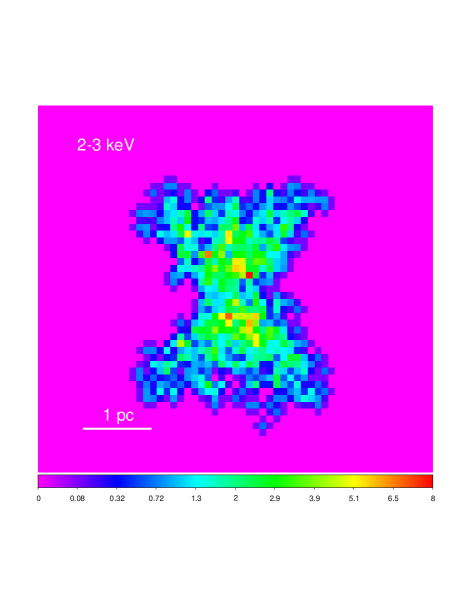
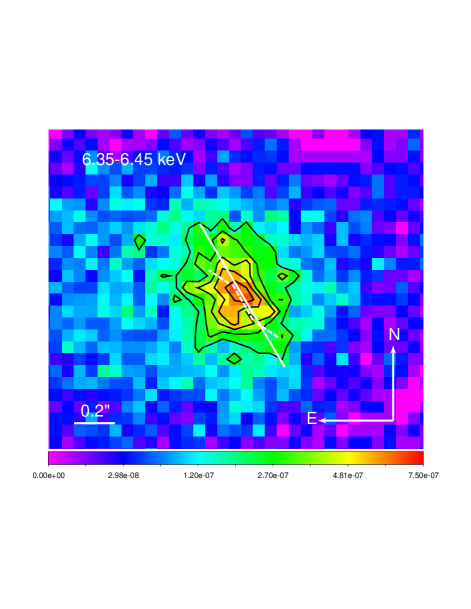
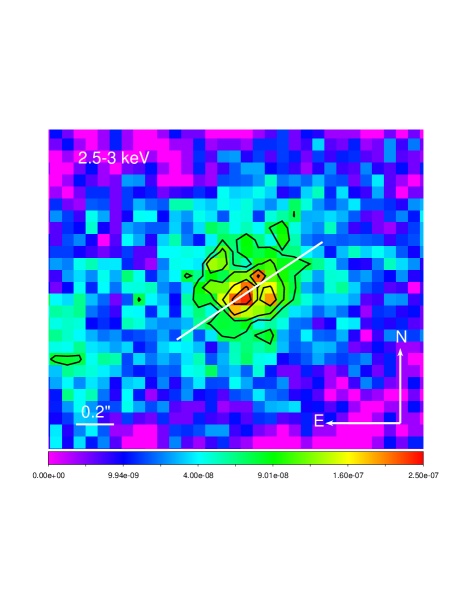
Since the largest angular size of the polar dust probed by mid-infrared interferometry is similar to the sub-pixel spatial resolution of Chandra, it is interesting to check the elongation of low-energy X-ray emission for bright nearby sources. For this purpose, we have extracted the Fe and keV images of the Circinus galaxy from the deepest Chandra ACIS observation (ObsID 12823, 150 ks). We also extracted the images of NGC 1068, and found their photon statistics (with an ACIS exposure ks) are much less than the Circinus galaxy, and thus not presented here. The range of keV is chosen to avoid possible line contamination produced in the ionization cone and to be dominated by the scattered emission as shown in the spectral fitting by Arévalo et al. (2014). The resulting images are shown in Figure 8 along with the elongation of the warped disk observed with the water maser (Greenhill et al., 2003). We measured the orientation of the maps using the intensity distribution with the brightest 25 pixels (with find_galaxy program written by Cappellari, 2002). The position angles of the Fe and keV maps are and (with respect to the vertical direction clockwise), respectively. They are shown as the while solid lines in Figure 8. It is interesting to see that the elongation of the Fe map is along the direction of the maser disk, while the keV map is perpendicular to the maser disk. These behaviors are consistent with the simulated morphologies of the disk+wind model shown in §3.2.
We note that the elongation of the Fe emission of the Circinus galaxy on scales is more close to the horizontal direction, as already illustrated in Smith & Wilson (2001). This direction and size are similar to those of the prominent 12 m bar revealed in VLT/VISIR image of Circinus (Stalevski et al., 2017). They modelled the 12 m bar as the dusty cone edge, which becomes bright due to the illumination of anisotropy radiation from a tilted disk. That is, the Fe emission of the Circinus galaxy on scales could be the emission from the dusty wind. It illustrates the complex circumnuclear region of the Circinus galaxy and a possible close connection between the Fe emission and the mid-infrared emission.
5 Discussion and conclusion
The polar dusty gas of AGN revealed by mid-IR interferometry observations can produce unique features in the scattered X-ray emission. When viewed with edge-on angles, the low-energy continuum and fluorescence photons produced by the polar dusty gas can be much stronger than those originating from the equatorial disk gas for obscured AGN. The exact contribution of the polar gas is sensitive to the column density () and the angular extent () of the polar gas. Different from those from the ionized gas, the scattered emission from the dusty gas produces self-absorption and neutral-like fluorescence lines, which are potentially a unique probe of the kinematics of the polar dusty gas.
As mentioned in the introduction, the observed ratios are around (Liu et al., 2016). (The Circinus galaxy has a largest ratio of 60, but its Si photons are likely to be absorbed by a dust lane on a larger scale (e.g. Roche et al., 2006; Mezcua et al., 2016), and its real ratio should be 40% of the observed value.) These ratios are 5-10 times lower than those predicted by clumpy torus models. The polar dusty gas provides a natural explanation of the observed bright Si lines. Indeed, the predicted ratio of the simulated disk+wind model is , close to the observed values. In turn, the bright Si lines observed in these AGN are a strong support for the existence of the polar dusty gas in these AGN.
We examined the Chandra HETG data of the Si line of the Circinus galaxy and NGC 1068, which show blue-shifts with respect to the systemic velocities of the host galaxies. The results indicate that the Si K-emitting gas is outflowing from the host galaxies and support the idea that the observed polar dust is associated with a dusty wind (e.g. Hnig et al., 2012; Vollmer et al., 2018). The current measurements are limited by available photon statistics, which could be much improved with future high throughput X-ray missions, such as Athena (Nandra et al., 2013) and Arcus (Smith et al., 2016). The microcalorimeters of Athena will have an effective area about 100 times larger than Chandra HETG within a larger energy range of 0.2–12 keV, with a spectral resolution of 2.5 eV. The proposed grating spectrometer of Arcus will have a spectral resolution of 3000 within 8–50 Å, with an effective area cm2, more than 10 times that of Chandra HETG. Thus, X-ray spectroscopy of the fluorescence lines from the polar dusty gas is an ideal objective for future X-ray missions, and a better understanding of the physical nature of the polar dusty gas is expected.
Similar to low-energy fluorescence photons, the polar dusty gas of AGN also produces stronger low-energy continuum compared with the disk gas. For type II AGN, such a polar-gas-scattered continuum could be a major contribution to the observed spectrum. Observationally, it is not as easy to tell as fluorescence lines, since the observed X-ray continuum is also mixed with other components, such as scattered emission from ionized gas (e.g. Guainazzi & Bianchi, 2007). However, to measure accurately the properties of the disk/torus component of AGN, the polar-gas-scattered component must be taken into account. As a result, constraints on the polar dusty gas might be obtained.
The scattered X-ray emission of the polar dusty gas also produces a unique morphology. It shows a bipolar-like feature, different from that of high-energy photons originating from the disk. We checked the Chandra keV image of the Circinus galaxy and found that it is elongated along the polar direction, consistent with the polar-gas-scattered X-ray emission. In contrast, the Fe map of the inner part of the Circinus galaxy is elongated along the disk direction, consistent with an equatorial disk origin. This peculiar morphology of polar-gas-scattered emission can also be better studied with future X-ray missions with high spatial resolution, like Lynx, the X-ray imager of which will have a spatial resolution of with a much larger effective area (Lynx team, 2018).
In our simulation, we have assumed that all atoms are in gas phase and not included the dust grains, as in most X-ray scattering simulations. Different from Compton-scattering by atoms in gas phase, the dust grains scatter X-ray photons through small angles (Overbeck, 1965). Because the absorption cross-section of dust grains dominates over the scattering cross-section below 3 keV (e.g. Corrales et al., 2016), the dust grains are unlikely to affect our results qualitatively. Above 5 keV, the scattering cross-section of dust grains is comparative to the absorption cross-section, and the forward scattering of dust is likely to affect the scattered X-ray emission of AGN (Gohil & Ballantyne, 2015). We plan to implement the dust grains in RefleX to investigate their effects on the scattered high-energy X-ray emission of AGN. The polar wind (either dusty neutral or ionized) could affect the polarization of the observed X-ray emission of AGN (e.g. Dorodnitsyn & Kallman, 2011; Marin et al., 2018a, b). Marin et al. (2018a) found that for type II AGN, the low-energy polarization spectrum is dominated by the scattered emission from the polar wind, and a neutral polar wind will produce unpolarized fluorescence lines imprinted on the polarized continuum. Thus the polar dusty gas will also leave unique features in the polarization spectrum of type II AGN. On the other hand, since the equatorial disk and the polar wind have different spatial scales, they may response differently to the variability of the intrinsic radiation of central AGN. The times lags on timescale of ten years between the low-energy X-ray emission and Fe line would be an indication of different emitting regions.
In summary, the polar dusty gas can contribute significantly to the observed X-ray emission of type II AGN. The polar-gas-scattered fluorescence lines are potentially a powerful probe of the kinematics of the polar dusty gas, which are crucial to understand the physical nature of the polar dusty gas. The Si and Fe lines can be easily measured for a relatively large samples, and the sources with smaller ratios would be ideal targets for mid-IR interferometry follow-up observations. Future X-ray missions (such as Athena) would enable a large sample of obscured AGN that can be studied with polar-gas-scattered X-ray emission.
Acknowledgements
We thank our referee for suggestions of polarization and variability features of the polar dusty wind and other comments that greatly improve the paper. JL is supported by National Natural Science Foundation of China (11773035 and 11811530630). JL and SFH acknowledge support by the European Union though European Research Council Starting Grant ERC-StG-677117 DUST-IN-THE-WIND. CR is supported by the CONICYT+PAI Convocatoria Nacional subvencion a instalacion en la academia convocatoria año 2017 PAI77170080. This research used data obtained from the Chandra Data Archive.
References
- Antonucci (1993) Antonucci, R. 1993, ARA&A, 31, 473
- Antonucci et al. (1994) Antonucci, R., Hurt, T., Miller, J. 1994, ApJ, 430, 210
- Anders & Grevesse (1989) Anders, E. & Grevesse, N. 1989, Geochimica et Cosmochimica Acta, 53, 197
- Asmus et al. (2016) Asmus, D., Hnig, S. F., Gandhi, P. 2016, ApJ, 822, 109
- Arévalo et al. (2014) Arévalo, P., Bauer, F. E., Puccetti, S., Walton, D. J., Koss, M., Boggs, S. E., Brandt, W. N., Brightman, M., Christensen, F. E., Comastri, A. et al. 2014, ApJ, 791, 81
- Beckert & Duschl (2004) Beckert, T.& Duschl, W. J. 2004, A&A, 426, 445
- Burtscher et al. (2016) Burtscher, L., Hnig, S. F., Jaffe, W., Kishimoto, M., Lopez-Gonzaga, N., Meisenheimer, K., Tristam, Konrad R. W. 2016, SPIE, 9907
- Burtscher et al. (2013) Burtscher, L., Meisenheimer, K., Tristram, K. R. W. 2013, A&A, 558, 149
- Canizares et al. (2005) Canizares, C. R., Davis, J. E., Dewey, D., et al. 2005, PASP, 117, 1144
- Cappellari (2002) Cappellari, M. 2002, MNRAS, 333, 400
- Chan & Krolik (2017) Chan, C. & Krolik, J. H. 2017, ApJ, 843, 58
- Comastri (2004) Comastri, A. 2004, ASSL, 308, 245
- Corrales et al. (2016) Corrales, L. R., García, J., Wilms, J. Baganoff, F. 2016, MNRAS, 458, 1345
- Dorodnitsyn et al. (2008) Dorodnitsyn, A., Kallman, T., Proga, D. 2008, ApJ, 675, 5
- Dorodnitsyn & Kallman (2011) Dorodnitsyn, A. & Kallman, T. 2011, Ap&SS, 336, 245
- Dorodnistyn et al. (2016) Dorodnitsyn, A., Kallman, T., Proga, D. 2016, ApJ, 819, 115
- Fabbiano et al. (2018) Fabbiano, G., Paggi, A., Siemiginowska, A., Elvis, M. 2018, ApJ, 869, L36
- Fabbiano et al. (2019) Fabbiano, G., Siemiginowska, A., Paggi, A., Elvis, M., Volonteri, M., Mayer, L., Karovska, M., Maksym, W. P., Risaliti, G., Wang, J. 2019, ApJ, 870, 69
- Fabbiano (2019) Fabbiano, G. 2019, arXiv:190301970
- George & Fabian (1991) George, I. M. & Fabian, A. C. 1991, MNRAS, 249, 352
- Gohil & Ballantyne (2015) Gohil, R. & Ballantyne, D. R. 2015, MNRAS, 449, 1449
- Greenhill et al. (2003) Greenhill, L. J., Booth, R. S., Ellingsen, S. P., Herrnstein, J. R., Jauncey, D. L., McCulloch, P. M., Moran, J. M., Norris, R. P., Reynolds, J. E., Tzioumis, A. K. 2003, ApJ, 590, 162
- Guainazzi & Bianchi (2007) Guainazzi, M. & Bianchi, S. 2007, MNRAS, 374, 1290
- Hnig et al. (2012) Hnig, S. F., Kishimoto, M., Antonucci, R., Marconi, A., Prieto, M. A., Tristram, K., Weigelt, G. 2012, ApJ, 755, 149
- Hnig et al. (2013) Hnig, S. F., Kishimoto, M., Tristram, K. R. W., Prieto, M. A., Gandhi, P., Asmus, D., Antonucci, R., Burtscher, L., Duschl, W. J., Weigelt, G. 2013, ApJ, 771, 87
- Hnig & Kishimoto (2017) Hnig, S. F., Kishimoto, M. 2010, A&A, 523, 27
- Hnig & Kishimoto (2017) Hnig, S. F., Kishimoto, M. 2017, ApJ, 838, L20
- Huenemoerder et al. (2011) Huenemoerder D.P., et al., 2011, AJ, 141, 129
- Ishibashi et al. (2006) Ishibashi, K., Dewey, D., Huenemoerder, D. P., Testa, P. 2006, 644, L117
- Jaffe et al. (2004) Jaffe, W., Meisenheimer, K., Rttgering, H. J. A., Leinert, Ch., Richichi, A., Chesneau, O., Fraix-Burnet, D., Glazenborg-Kluttig, A., Granato, G.-L., Graser, U., et al. 2004, Nature, 429, 47
- Kallman et al. (2014) Kallman, T., Evans, D. A., Marshall, H., Canizares, C., Longinotti, A., Nowak, M., Schulz, N. 2014, ApJ, 780, 121
- Kishimoto et al. (2007) Kishimoto, M., Hnig, S. F., Beckert, T., Weigelt, G. 2007, A&A, 476, 713
- Krolik & Kriss (1995) Krolik, J. H. & Kriss, G. A. 1995, ApJ, 447, 512
- Lee et al. (2001) Lee, J. et al. 2001, ApJ, 554, L13
- Leftley et al. (2018) Leftley, J. H., Tristram, K. R. W., Hnig, S. F., Kishimoto, M., Asmus, D., Gandhi, P. 2018, ApJ, 862, 17
- Li et al. (2004) Li, J., Kastner, Joel H., Prigozhin, G. Y., Schulz, N. S., Feigelson, E. D., Getman, K. V. 2004, ApJ, 610, 1204
- Liu et al. (2016) Liu, J., Liu, Y., Li, X., Xu, W., Gou, L., Cheng, C. 2016, MNRAS, 459, L100
- Liu (2016) Liu, J. 2016, MNRAS, 459, L105
- Liu & Li (2014) Liu, Y. & Li, X. 2014, ApJ, 787, 52
- López-Gonzaga et al. (2014) López-Gonzaga, N., Jaffe, W., Burtscher, L., Tristram, K. R. W., Meisenheimer, K. 2014, A&A, 565, 71
- López-Gonzaga et al. (2016) López-Gonzaga, N., Burtscher, L., Tristram, K. R. W., Meisenheimer, K., Schartmann, M. 2016, A&A, 591, 47
- Lyu & Rieke (2018) Lyu, J. & Rieke, G. H. 2018, ApJ, 866, 92
- Lynx team (2018) The Lynx Team, 2018, arXiv:1809.09642
- Magdziarz & Zdziarski (1995) Murphy, K. D. & Yaqoob, T. 2009, MNRAS, 397, 1549
- Marinucci et al. (2012) Marinucci, A., Risaliti, G., Wang, J., Nardini, E., Elvis, M., Fabbiano, G., Bianchi, S., Matt, G. 2012, MNRAS, 423, L6
- Marinucci et al. (2013) Marinucci, A.; Miniutti, G.; Bianchi, S.; Matt, G.; Risaliti, G. 2013, MNRAS, 436, 2500
- Marinucci et al. (2016) Marinucci, A., Bianchi, S., Matt, G. et al. 2016, MNRAS, 456, L94
- Marinucci et al. (2017) Marinucci, A.; Bianchi, S.; Fabbiano, G.; Matt, G.; Risaliti, G.; Nardini, E.; Wang, J. 2017, MNRAS, 470, 4039
- Marin et al. (2018a) Marin, F., Doviak, M., Muleri, F., Kislat, F. F., Krawczynski, H. S. 2018, MNRAS, 473, 1286
- Marin et al. (2018b) Marin, F., Doviak, M., Kammoun, E. S. MNRAS, 478, 950
- Mehdipour & Costantini (2018) Mehdipour, M. & Costantini, E. 2018, A&A, 619, 20
- Mezcua et al. (2016) Mezcua, M., Prieto, M. A., Fernández-Ontiveros, J. A., Tristram, K. R. W. 2016, MNRAS, 457, L94
- Murphy & Yaqoob (2009) Murphy, K. D. & Yaqoob, T. 2009, MNRAS, 397, 1549
- Nandra & Pounds (1994) Nandra, K. & Pounds, K. A. 1994, MNRAS, 268, 405
- Nandra et al. (2013) Nandra, K. et al. 2013, arXiv:1306.2307
- Nenkova et al. (2008a) Nenkova, M., Sirocky, M. M., Nikutta, R., Ivezić, Ž., & Elitzur, M. 2008, ApJ, 685, 147
- Nenkova et al. (2008b) Nenkova, M., Sirocky, M. M., Nikutta, R., Ivezić, Ž., & Elitzur, M. 2008, ApJ, 685, 160
- Netzer (2015) Netzer, H. 2015, ARA&A, 53, 365
- Ogle et al. (2003) Ogle, P. M., Brookings, T., Canizares, C. R., Lee, J. C., Marshall, H. L. 2003, A&A, 402, 849O
- Overbeck (1965) Overbeck, J. W. 1965, ApJ, 141, 864O
- Paltani & Ricci (2017) Paltani, S.; Ricci, C. 2017, A&A, 607, 31
- Proga et al. (2000) Proga, D., Stone, J. M., Kallman, T. R. 2000, ApJ, 543, 686
- Ricci et al. (2014) Ricci, C., Ueda, Y., Paltani, S., Ichikawa, K., Gandhi, P., Awaki, H. 2014, MNRAS, 441, 3622
- Roche et al. (2006) Roche, P. F., Packham, C., Telesco, C. M., Radomski, J. T., Alonso-Herrero, A., Aitken, D. K., Colina, L.; Perlman, E. 2006, MNRAS, 367, 1689
- Sambruna et al. (2001) Sambruna, R. M., Netzer, H., Kaspi, S., Brandt, W. N., Chartas, G., Garmire, G. P., Nousek, J. A., Weaver, K. A. 2001, ApJ, 546, L13
- Smith & Wilson (2001) Smith, D. A. & Wilson, A. S. 2001, ApJ, 557, 180
- Smith et al. (2016) Smith, R. K. et al. 2016, SPIE, 9905, 4
- Stalevski et al. (2017) Stalevski, M., Asmus, D., Tristram, K. R. W. 2017, MNRAS, 472, 3854
- Stalevski et al. (2017) Stalevski, M., Tristram, K. R. W., Asmus, D. 2019, MNRAS, 484, 3334
- Tanimoto et al. (2019) Tanimoto, A., Ueda, Y., Odaka, H., Kawaguchi, T., Fukazawa, Y., Kawamuro, T. 2019, ApJ, 877, 95
- Tristram et al. (2014) Tristram, K. R. W., Burtscher, L., Jaffe, W., Meisenheimer, K., Hnig, S. F., Kishimoto, M., Schartmann, M., Weigelt, G. 2014, A&A, 563, 82
- Vollmer et al. (2018) Vollmer, B., Schartmann, M., Burtscher, L., Marin, F., Hnig, S., Davies, R., Goosmann, R. 2018, A&A, 615, 164
- Williamson et al. (2019) Williamson, D., Venanzi, M., Hnig, S. F. 2019, ApJ, 876, 137