Backfolded acoustic phonons in metal-oxide superlattices
Abstract
We report the observation of low-frequency modes in the Raman spectra of thin-film superlattices of the high-temperature superconductor YBa2Cu3O7-δ and various manganite perovskites. Our study shows that these modes are caused by the backfolding of acoustic phonons due to the additional periodicity introduced by the superlattice. Such modes were previously only observed for ultra-pure semiconductor superlattices. They can be used to determine the bilayer thickness of the superlattice and its speed of sound. Moreover, we use the spatial resolution of Raman microscopy to map the film thickness inhomogeneity across a sample, making these modes a useful tool to characterize thin-film superlattices.
Thin-film multilayers of metal-oxides host a wide range of emergent, tunable and potentially useful properties Chakhalian et al. (2007); Reyren et al. (2007); Bibes, Villegas, and Barthélémy (2011); Hwang et al. (2012); Driza et al. (2012); Rogdakis et al. (2012); Chakhalian et al. (2014); Lorenz et al. (2016); Mallett et al. (2016); Keunecke et al. (2019) beyond those observed in multilayers of more conventional semi-conductors such as Si or GaAs Smith and Mailhiot (1990); Mannhart and Schlom (2010). This is owed to the various types of magnetic, charge, ferroelectric and superconducting orders that the constituent metal-oxides layers can host Tokura (2006); Keimer et al. (2015). The novel properties of thin-film multilayers and superlattices result from interactions across the interface, such as spin and orbital reconstruction, charge-transfer and phonon-coupling Bibes, Villegas, and Barthélémy (2011); Hwang et al. (2012); Driza et al. (2012); Chakhalian et al. (2014), as well as some hitherto unidentified mechanisms Mallett et al. (2016); Perret et al. (2018). As such, multilayers of metal-oxides constitute a fertile playground both to discover interesting physics and to tailor functionalities that could shape future electronics.
Besides the scientific challenge of understanding the properties of metal-oxide superlattices, there is the persistent technical challenge of maintaining the quality of crystal structure, interfaces and layer thickness in such samples Norton (2004). Growth techniques for such samples includeNorton (2004) pulsed laser deposition (PLD) Dijkkamp et al. (1987), molecular beam epitaxy (MBE) Schlom et al. (1988) and sputtering Rao et al. (1996).
Here we report on the observation of low-frequency Raman modes in metal-oxide superlattices, with a focus on superlattices of the high-temperature superconductor YBa2Cu3O7 and MnO3 manganites, which are exemplary multilayers for displaying the effects described above Chakhalian et al. (2014); Mallett et al. (2016); Perret et al. (2018). The low-energy modes are optical-phonons which arise in superlattices due to the backfolding of the -axis acoustic phonon branch and, to the best of our knowledge, are detected for the first time in metal-oxide heterostructures. Until now the observation of backfolded acoustic phonon modes has only been reported in superlattices of high-quality MBE-grown semiconductor superlattices, such as GaAs/AlAs Colvard et al. (1980); Cardona (1989); Rouhani and Khourdifi (1991); Sapriel and He (1991). The occurence and the properties of these modes was fully explained and described within a comprehensive theoretical framework Colvard et al. (1985); Cardona (1989); Dharma-wardana, Zhang, and Lockwood (1993). The modes can thus be used to characterize the quality and properties of the superlattice, such as the speed of sound and/or the bilayer thickness. Given the fast acquisition time of the measurement and the potential for micrometer spatial resolution, such modes can be a useful diagnostic for characterizing superlattices of given materials.
In particular, in the present work we focus on epitaxial superlattices of the cuprate superconductor YBa2Cu3O7 (YBCO) and manganite MnO3, where Pr0.5La0.2Ca0.3 (PLCMO), Nd1-x(Ca1-ySry)x (NCSMO) or La1-xSrx (LSMO). Details of the samples can be found in the supplementary information. The samples are grown by PLD on La0.3Sr0.7Al0.65Ta0.35O3 (LSAT) substrates that are (0 0 1)-oriented (commercially available from Crystec) following the process described in Refs. Malik et al. (2012); Perret et al. (2018). The superlattices involve ten repetitions of cuprate-manganite layers, whose thickness we denote using the following scheme; PLCMO(10 nm)/YBCO(7 nm) translates to a 7 nm thick YBCO layer grown on top of a 10 nm thick PLCMO layer. The topmost layer is the manganite followed by a 2 nm thick LaAlO3 capping layer to protect the film surface from degradation. We performed ex situ studies with x-ray diffraction, x-ray reflectivity, and polarized neutron reflectivity to measure the layer thickness, uniformity, and interface roughness. Representative results can be found in the supplementary materials of Refs. Mallett et al. (2016); Perret et al. (2018). These show our samples are of high-quality, with a small interface roughness ( nm) that tends to increase with additional cuprate/manganite layers and minimal chemical diffusion across the interface.

The Raman spectra were recorded with a Jobin-Yvon LabRam HR800 spectrometer using the nm excitation line of a HeNe laser Hepting et al. (2014). The measurements were carried out in full back scattering with geometry indicated by Porto’s notation. For example, indicates backscattering with incident polarization 45∘ to the Mn-O nearest-neighbour bond with the cross-polarised scattered light measured. We find spurious reflections in our spectrometer that lead to artefacts around cm-1 and cm-1 - these spectral regions are removed from the reported spectra for clarity. Unless noted otherwise, the spectra shown were recorded at room temperature. All reported spectra have been divided by the Bose thermal factors to obtain the imaginary part of the Raman scattering susceptibility, Im. Further details can be found in the supplementary material.
To set the scene, Fig. 1(a) shows the Raman Stokes signal from a PLCMO(10nm)/YBCO(7nm) superlattice (sketched) collected at room-temperature in geometry over a wide spectral range.The spectrum reveals multiple broad overlapping phonon modes above 50 cm-1 arising from both YBCO, manganite and the interaction between them. A rich spectral fingerprint is expected as a simplified space group of the manganite, , already allows 21 Raman-active modesAbrashev et al. (2001) (the more realistic symmetry – that include the MnO6 octahedral tilts - having 54 Raman-active phonon modes). The manganite spectra are also consistent with a disordered rhombohedral phase with space group Iliev et al. (2003). YBCO has 5 main Raman active phonon modes, with additional modes in special cases of charge- and oxygen-orderingBakr et al. (2013). An analysis of this spectral region will be presented elsewhere, as here we focus on the Raman scattering below cm-1.
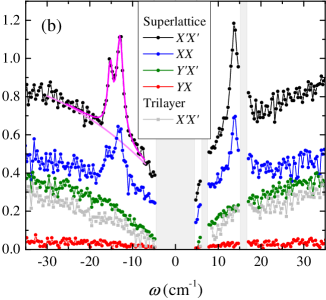
In particular, we focus on two prominent features in the low-energy spectra which are marked by the arrow in panel (a) and highlighted in Fig. 1(b). In panel (b), both the Stokes and the anti-Stokes signals at K in a narrow spectral region around the elastic-line are shown. The modes are clearly pronounced for both the and geometries, but they are not observed for the cross-polarised geometries which indicates an type symmetry. Importantly, these sharp modes are only observed from superlattice samples. For example, we include in Fig. 1(b) a spectrum from a trilayer of the same material, PLCMO(20nm)/YBCO(7nm)/PLCMO(20nm), for which the sharp low-energy features are absent.
To quantitatively characterize these peaks, we fit them using a quadratic background and a pseduo-Voigt line shape as detailed in the supplementary material. An exemplary fit is shown by the magenta line superimposed to the superlattice data in Fig. 1(b), whereas the modelled background is a lighter coloured thin magenta line. The fitted peaks shown in Fig. 1(b) are centred at and cm-1, with the absolute uncertainty in the peak positions estimated to be cm-1, primarily due to systematic uncertainties. The half widths at half maximum (HWHM) are and cm-1 respectively. The area of each mode, , is proportional to its Raman susceptibility. While we cannot quantify the Raman susceptibility from our data in absolute terms, we can compare the Bose-corrected areas of these new modes with that of a regular phonon mode. In particular, we find an area of (a.u.) for the phonon excitation at cm-1, and areas of and for the two low-energy modes respectively. This illustrates that the new modes have Raman cross-sections comparable to the weaker phonon modes above 70 cm-1.
In transition metal-oxides like those studied here, modes in this frequency range might be ascribed to magnetic excitations Murugavel et al. (2000). However, for several reasons this is unlikely in our case, despite the significant Mn magnetic moments. Firstly, long-range magnetic order is established only below K in our PLCMO and NCSMO samplesMallett et al. (2016); Perret et al. (2018); Khmaladze et al. (2019), whereas these peaks are intense and sharp already at room-temperature. Secondly, the new modes are only observed for superlattice samples and not in films of the pure manganite material with comparable thickness to the superlattices. Thirdly, whereas magnons are usually observed in crossed polarization, the and polarization channels of our superlattices do not exhibit low-energy modes (Fig. 1(b)). In addition, the low energy modes are not observed in trilayer samples, which rules out that they originate solely due to an interaction between the cuprate and manganite.
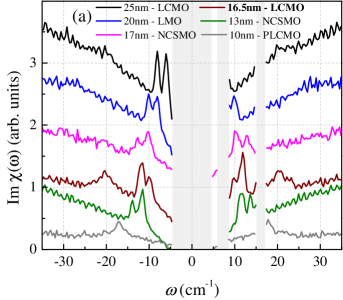
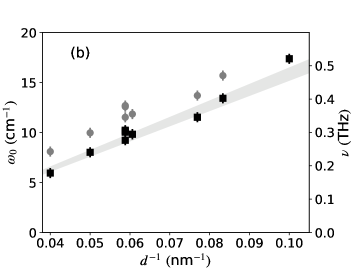
Furthermore, Fig. 2 illustrates that the position of these peaks depends on the bilayer thickness in the superlattice samples ( the sum of the YBCO and manganite film thickness). Fig. 2(a) shows spectra for superlattice samples with a range of bilayer thickness, . Spectra have been offset for clarity. The shift of the modes to lower energy with larger bilayer thickness is clearly seen from the raw data. Figure 2(b) shows the fitted energies of the two observable low-energy modes, , as data points plotted against . The solid line in the figure has the form , where the meaning and choice of the value is discussed below. The peak areas, , and widths, , do not appear to show any systematic variation across the samples studied. Finally, we note the possible presence of additional low-energy peaks barely resolved by our measurements, except in particular cases such as the nm sample (brown curve).
These observations show that the low-energy modes most probably arise from a back-folding of the Brillouin-zone, due to the superlattice periodicity, which brings new Raman-active excitations at low energies onto the point.
Such a situation has been well documented and analysed in superlattices comprising of GaAs-AlAs semiconductors for acoustic phonon branches Colvard et al. (1980); Cardona (1989); Rouhani and Khourdifi (1991); Sapriel and He (1991). There are well-established models for this situation, starting from either a continuum approximation or linear-chain type models Colvard et al. (1985); Cardona (1989), of which detailed versions have been developed in order to capture finite-size effects of the sample Dharma-wardana, Zhang, and Lockwood (1993). All such models agree however with the general behaviour captured by the simpler Rytov model Rytov (1956). Within this model, the phonon dispersion is described by
where the subscripts and denote the two materials in the superlattice and is the sound-velocity (with the density of the material and is the elastic modulus along the -axis direction). and are the thicknesses of the layers comprising the superlattice and . This expression describes a folding of the phonon dispersions about , where , and the opening of gaps at the zone center and boundaries. Figure 3(a) sketches the back-folding effect with approximate values for our experiments. With the Raman measurements, we (de)excite the phonon modes at where is the refractive index of the superlattice and the laser wavelength.
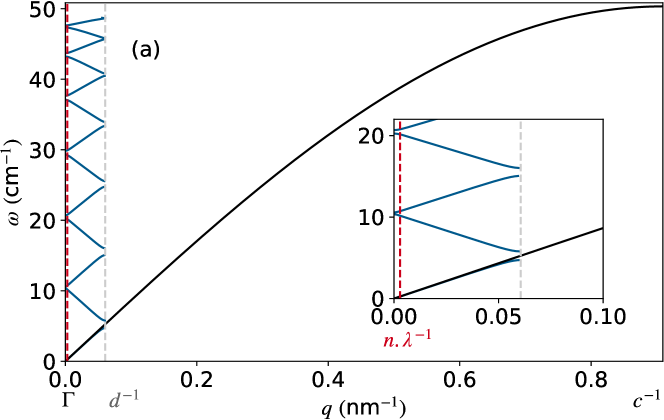
This model describes accurately our observations. In particular, the straight line in Fig. 2(b) is given by where is obtained from the nominal layer thicknesses (estimated from x-ray reflectivity measurements) and is the weighted average of the -axis speed of sound in the two materials (here we are using the most common 7 nm YBCO layer and 10 nm manganite layer thicknesses) Cardona (1989). The value of is m.s-1 as determined from the bulk-moduli and densities Hazama et al. (2000); Jorgensen et al. (1990), but similar values are obtained from other measurements of the speed of soundSeikh et al. (2003); Li et al. (2016); Pintschovius and Reichardt (1998); Weber et al. (2011).The width of the line in Fig. 2(b) comes from the uncertainty in for the individual YBCO and manganite layers. represents an average of the two peak-positions which are split due to mixing and the finite- of the laser lineColvard et al. (1985). Therefore, our experimental results are consistent with a slightly higher value of m.s-1.
A generalized relaxation time of the mode can be expressed as , which is approximately 40 ps. If we assume m.s-1, then the scattering length of the mode is nm. This is close to the total film thickness and suggestive of scattering of the phonon at the top surface of the superlattice and bottom interface with the substrate.
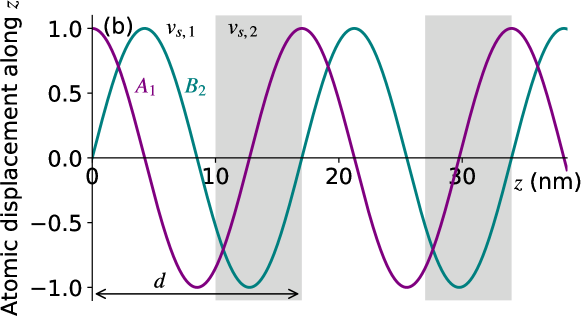
We now discuss the intensity of the peaks. Close to the Brillouin zone center, the upper and lower branches develop preferential or symmetry. The atomic displacement amplitude for the two symmetries are sketched in Fig. 3(b), following Ref. Colvard et al. (1980). The mode is not Raman-active (off-resonance), and therefore the relative Raman cross-section of the two branches will be different near the point. The relative thickness and speed of sound of the manganite and YBCO layers determine whether the upper or lower branch has dominant symmetry. We denote these as and , respectively, whereby layer 1 (the manganite) has a slower speed of sound than layer 2 (YBCO): . For , the mode has lower energy than the mode which results in a smaller intensity of the lower energy mode in the Raman spectrum. The sample representing this case is marked in bold in the legend of Fig. 2(a). For most of our samples holds, so that the situation is reversed with the higher energy mode having a lower intensity. For , the second-order back-folded phonon branch will not be Raman-active. This is the case for the “20nm - LMO” sample in Fig. 2(a) and approximately the case for the samples with 10 nm and 7 nm layer thickness, which may be the reason we only rarely see the second-order back-folded modes. More quantitative predictions of the phonon intensities require first-principles calculations of the photoelastic coefficients Colvard et al. (1985).
We also note that we observe similar low-frequency modes in superlattices grown in our laboratory where the YBCO is replaced for another metal oxide. These include SrFeO3/La2/3Ca1/3MnO3 Perret et al. (2017) and SrRuO3/La2/3Ca1/3MnO3 superlattices.
The results above show that these low-energy modes can be used to determine the spatial variation in a superlattice’s bilayer thickness (or more generally its repeat-unit thickness), , because (i) their position, , is a function of and (ii) the micro-Raman technique we use here has a 10 m2 spatial resolution in the plane. Spatial uniformity is of particular interest for growth techniques whereby the deposition rate of the films may not be constant across the sample. One particularly important example in terms of oxide materials is the growth by PLD onto substrates with surface area comparable to the size of the plasma plume. The spatial dependence of the intensity and HWHM may also be used to characterize film quality.
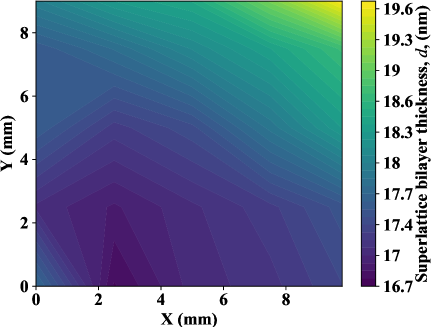
To exemplify the potential of our method, we performed measurements on a 7x7 points grid across the surface of a nominally LCMO(10 nm)/YBCO(10 nm) superlattice grown by PLD on an LSAT with surface area mm2. The results are summarized in Fig. 4. The colour scale represents as determined from the fitted of the two low-energy modes at each point and m.s-1 as determined in Fig. 2(b). The data are linearly interpolated between the measurement points and we estimate the uncertainty in to be nm. Fig. 4 shows that the LCMO-YBCO layer thicknesses are not uniform across the approximate mm2 area that was measured. Instead, we identify a smooth gradient in the value of from one corner to the opposite corner.
Finally, we note that we observed only a subtle temperature dependence of the low-frequency modes between room-temperature to 10 K, as shown in the supplementary information. This is despite the various electronic and magnetic phase transitions that our samples exhibit below 300 K Mallett et al. (2016); Perret et al. (2018); Khmaladze et al. (2019).
In summary, we report systematic measurements of low-frequency modes in metal-oxide superlattices grown by pulsed laser deposition. We show that these modes arise from a back-folded -axis acoustic phonon branch. As such, their observation demonstrates the high quality of the thin-film superlattices. The modes can be used to characterize the bilayer thickness of the superlattice and/or the -axis speed of sound. We utilized the spatial resolution of the Raman microscopy to map the film thickness inhomogeneity across a larger mm sample. This information is important for monitoring and improving the quality of future metal-oxide superlattices which might comprise the elementary building blocks of next generation electronic devices.
Acknowledgements.
This work was supported by the Schweizerische Nationalfonds (SNF) through grant No. 200020-172611. BPPM acknowledges support from the Rutherford Foundation of New Zealand. AC acknowledges support of the MacDiarmid Institute. We thank Dr. F. Weber and Dr. R Heid for valuable discussions on this work.References
- Chakhalian et al. (2007) J. Chakhalian, J. W. Freeland, H.-U. Habermeier, G. Cristiani, G. Khaliullin, M. van Veenendaal, and B. Keimer, “Orbital reconstruction and covalent bonding at an oxide interface,” Science 318, 1114–1117 (2007).
- Reyren et al. (2007) N. Reyren, S. Thiel, A. D. Caviglia, L. F. Kourkoutis, G. Hammerl, C. Richter, C. W. Schneider, T. Kopp, A.-S. Ruetschi, D. Jaccard, M. Gabay, D. A. Muller, J.-M. Triscone, and J. Mannhart, “Superconducting Interfaces Between Insulating Oxides,” Science 317, 1196–1199 (2007).
- Bibes, Villegas, and Barthélémy (2011) M. Bibes, J. E. Villegas, and A. Barthélémy, “Ultrathin oxide films and interfaces for electronics and spintronics,” Advances in Physics 60, 5–84 (2011), https://doi.org/10.1080/00018732.2010.534865 .
- Hwang et al. (2012) H. Y. Hwang, Y. Iwasa, M. Kawasaki, B. Keimer, N. Nagaosa, and Y. Tokura, “Emergent phenomena at oxide interfaces,” Nature materials 11, 103 (2012).
- Driza et al. (2012) N. Driza, S. Blanco-Canosa, M. Bakr, S. Soltan, M. Khalid, L. Mustafa, K. Kawashima, G. Christiani, H.-U. Habermeier, G. Khaliullin, C. Ulrich, M. Le Tacon, and B. Keimer, “Long-range transfer of electron-phonon coupling in oxide superlattices,” Nature Materials 11 (2012), 10.1038/nmat3378.
- Rogdakis et al. (2012) K. Rogdakis, J. Seo, Z. Viskadourakis, Y. Wang, L. A. Qune, E. Choi, J. Burton, E. Tsymbal, J. Lee, and C. Panagopoulos, “Tunable ferroelectricity in artificial tri-layer superlattices comprised of non-ferroic components,” Nature communications 3, 1064 (2012).
- Chakhalian et al. (2014) J. Chakhalian, J. W. Freeland, A. J. Millis, C. Panagopoulos, and J. M. Rondinelli, “Emergent properties in plane view: Strong correlations at oxide interfaces,” Rev. Mod. Phys. 86, 1189–1202 (2014).
- Lorenz et al. (2016) M. Lorenz, M. R. Rao, T. Venkatesan, E. Fortunato, P. Barquinha, R. Branquinho, D. Salgueiro, R. Martins, E. Carlos, A. Liu, et al., “The 2016 oxide electronic materials and oxide interfaces roadmap,” Journal of Physics D: Applied Physics 49, 433001 (2016).
- Mallett et al. (2016) B. P. P. Mallett, J. Khmaladze, P. Marsik, E. Perret, A. Cerreta, M. Orlita, N. Biškup, M. Varela, and C. Bernhard, “Granular superconductivity and magnetic-field-driven recovery of macroscopic coherence in a cuprate/manganite multilayer,” Phys. Rev. B 94, 180503 (2016).
- Keunecke et al. (2019) M. Keunecke, F. Lyzwa, D. Schwarzbach, V. Roddatis, N. Gauquelin, K. Müller-Caspary, J. Verbeeck, S. J. Callori, F. Klose, M. Jungbauer, et al., “High- Interfacial Ferromagnetism in SrMnO3/LaMnO3 Superlattices,” Advanced Functional Materials , 1808270 (2019).
- Smith and Mailhiot (1990) D. L. Smith and C. Mailhiot, “Theory of semiconductor superlattice electronic structure,” Rev. Mod. Phys. 62, 173–234 (1990).
- Mannhart and Schlom (2010) J. Mannhart and D. G. Schlom, “Oxide interfaces? an opportunity for electronics,” Science 327, 1607–1611 (2010).
- Tokura (2006) Y. Tokura, “Critical features of colossal magnetoresistive manganites,” Reports on Progress in Physics 69, 797 (2006).
- Keimer et al. (2015) B. Keimer, S. Kivelson, M. Norman, S. Uchida, and J. Zaanen, “From quantum matter to high-temperature superconductivity in copper oxides,” Nature 518, 179–186 (2015).
- Perret et al. (2018) E. Perret, C. Monney, S. Johnston, J. Khmaladze, F. Lyzwa, R. Gaina, M. Dantz, J. Pelliciari, C. Piamonteze, B. Mallett, M. Minola, B. Keimer, T. Schmitt, and C. Bernhard, “Coupled cu and mn charge and orbital orders in YBa2Cu3O7/Nd 0.65(Ca 1-ySry)0.35MnO3 multilayers,” Communications Physics 1, 45 (2018).
- Norton (2004) D. P. Norton, “Synthesis and properties of epitaxial electronic oxide thin-film materials,” Materials Science and Engineering: R: Reports 43, 139–247 (2004).
- Dijkkamp et al. (1987) D. Dijkkamp, T. Venkatesan, X. Wu, S. Shaheen, N. Jisrawi, Y. Min-Lee, W. McLean, and M. Croft, “Preparation of Y-Ba-Cu oxide superconductor thin films using pulsed laser evaporation from high bulk material,” Applied Physics Letters 51, 619–621 (1987).
- Schlom et al. (1988) D. Schlom, J. N. Eckstein, E. Hellman, S. Streiffer, J. Harris Jr, M. Beasley, J. Bravman, T. Geballe, C. Webb, K. Von Dessonneck, et al., “Molecular beam epitaxy of layered Dy-Ba-Cu-O compounds,” Applied physics letters 53, 1660–1662 (1988).
- Rao et al. (1996) R. Rao, Q. Gan, C. Eom, Y. Suzuki, A. McDaniel, and J. Hsu, “Uniform deposition of YBa2Cu3O7 thin films over an 8 inch diameter area by a 90 degree off-axis sputtering technique,” Applied physics letters 69, 3911–3913 (1996).
- Colvard et al. (1980) C. Colvard, R. Merlin, M. V. Klein, and A. C. Gossard, “Observation of folded acoustic phonons in a semiconductor superlattice,” Phys. Rev. Lett. 45, 298–301 (1980).
- Cardona (1989) M. Cardona, “Folded, confined, interface, surface, and slab vibrational modes in semiconductor superlattices,” Superlattices and Microstructures 5, 27–42 (1989).
- Rouhani and Khourdifi (1991) B. D. Rouhani and E. Khourdifi, “Localised and extended acoustic waves in superlattices light scattering by longitudinal phonons,” in Light Scattering in Semiconductor Structures and Superlattices (Springer US, 1991) pp. 139–158.
- Sapriel and He (1991) J. Sapriel and J. He, “Interaction of light with acoustic waves in superlattices and related devices,” in Light Scattering in Semiconductor Structures and Superlattices (Springer, 1991) pp. 123–138.
- Colvard et al. (1985) C. Colvard, T. A. Gant, M. V. Klein, R. Merlin, R. Fischer, H. Morkoc, and A. C. Gossard, “Folded acoustic and quantized optic phonons in (GaAl)As superlattices,” Phys. Rev. B 31, 2080–2091 (1985).
- Dharma-wardana, Zhang, and Lockwood (1993) M. W. C. Dharma-wardana, P. X. Zhang, and D. J. Lockwood, “Finite-size effects on superlattice acoustic phonons,” Physical Review B 48, 11960–11964 (1993).
- Malik et al. (2012) V. K. Malik, I. Marozau, S. Das, B. Doggett, D. K. Satapathy, M. A. Uribe-Laverde, N. Biskup, M. Varela, C. W. Schneider, C. Marcelot, J. Stahn, and C. Bernhard, “Pulsed laser deposition growth of heteroepitaxial YBa2Cu3O7/La0.67Ca0.33MnO3 superlattices on NdGaO3 and Sr0.7La0.3Al0.65Ta0.35O3 substrates,” Phys. Rev. B 85, 054514 (2012).
- Hepting et al. (2014) M. Hepting, M. Minola, A. Frano, G. Cristiani, G. Logvenov, E. Schierle, M. Wu, M. Bluschke, E. Weschke, H.-U. Habermeier, E. Benckiser, M. Le Tacon, and B. Keimer, “Tunable charge and spin order in thin films and superlattices,” Phys. Rev. Lett. 113, 227206 (2014).
- Abrashev et al. (2001) M. V. Abrashev, J. Bäckström, L. Börjesson, M. Pissas, N. Kolev, and M. N. Iliev, “Raman spectroscopy of the charge- and orbital-ordered state in ,” Phys. Rev. B 64, 144429 (2001).
- Iliev et al. (2003) M. N. Iliev, M. V. Abrashev, V. N. Popov, and V. G. Hadjiev, “Role of Jahn-Teller disorder in Raman scattering of mixed-valence manganites,” Phys. Rev. B 67, 212301 (2003).
- Bakr et al. (2013) M. Bakr, S. M. Souliou, S. Blanco-Canosa, I. Zegkinoglou, H. Gretarsson, J. Strempfer, T. Loew, C. T. Lin, R. Liang, D. A. Bonn, W. N. Hardy, B. Keimer, and M. Le Tacon, “Lattice dynamical signature of charge density wave formation in underdoped ,” Phys. Rev. B 88, 214517 (2013).
- Murugavel et al. (2000) P. Murugavel, C. Narayana, A. Sood, S. Parashar, A. Raju, and C. Rao, “Magnetic excitations in charge-ordered Nd0.5Ca0.5MnO3: A Brillouin scattering study,” EPL (Europhysics Letters) 52, 461 (2000).
- Khmaladze et al. (2019) J. Khmaladze, S. Sarkar, M. Soulier, F. Lyzwa, R. de Andres Prada, E. Perret, B. P. P. Mallett, M. Minola, B. Keimer, and C. Bernhard, “Granular superconductivity and charge/orbital order in /manganite trilayers,” Phys. Rev. Materials 3, 084801 (2019).
- Rytov (1956) S. Rytov, “Acoustical properties of a thinly laminated medium,” Sov. Phys. Acoust 2, 68–80 (1956).
- Hazama et al. (2000) H. Hazama, Y. Nemoto, T. Goto, A. Asamitsu, and Y. Tokura, “Ultrasonic study of perovskite manganites La1-xSrxMnO3,” Physica B: Condensed Matter 281-282, 487 – 488 (2000).
- Jorgensen et al. (1990) J. Jorgensen, S. Pei, P. Lightfoot, D. Hinks, B. Veal, B. Dabrowski, A. Paulikas, R. Kleb, and I. Brown, “Pressure-induced charge transfer and dTc/dP in YBa2Cu3O7-x,” Physica C 171, 93–102 (1990).
- Seikh et al. (2003) M. Seikh, C. Narayana, S. Parashar, and A. Sood, “Temperature-dependent Brillouin scattering studies of surface acoustic modes in Nd0.5Sr0.5MnO3,” Solid State Communications 127, 209–214 (2003).
- Li et al. (2016) W. Li, B. He, C. Zhang, S. Liu, X. Liu, S. Middey, J. Chakhalian, X. Wang, and M. Xiao, “Coherent acoustic phonons in YBa2Cu3O7/La1/3Ca2/3MnO3 superlattices,” Applied Physics Letters 108, 132601 (2016), https://doi.org/10.1063/1.4945333 .
- Pintschovius and Reichardt (1998) L. Pintschovius and W. Reichardt, Phonon Dispersions and Phonon Density-of-States in Copper-Oxide Superconductors, edited by A. Furrer, Neutron Scattering in Layered Copper-Oxide Superconductors (Springer, Dordrecht, 1998).
- Weber et al. (2011) F. Weber, S. Rosenkranz, J.-P. Castellan, R. Osborn, H. Zheng, J. F. Mitchell, Y. Chen, S. Chi, J. W. Lynn, and D. Reznik, “Response of Acoustic Phonons to Charge and Orbital Order in the 50,” Phys. Rev. Lett. 107, 207202 (2011).
- Perret et al. (2017) E. Perret, K. Sen, J. Khmaladze, B. P. P. Mallett, M. Yazdi-Rizi, P. Marsik, S. Das, I. Marozau, M. A. Uribe-Laverde, R. de Andrés Prada, J. Strempfer, M. Döbeli, N. Biškup, M. Varela, Y.-L. Mathis, and C. Bernhard, “Structural, magnetic and electronic properties of pulsed-laser-deposition grown SrFeO3-δ thin films and SrFeO3-δ/La2/3Ca1/3MnO3 multilayers,” Journal of Physics: Condensed Matter 29, 495601 (2017).