Towards a phylogenetic measure to quantify HIV incidence
Abstract
One of the cornerstones in combating the HIV pandemic is being able to assess the current state and evolution of local HIV epidemics. This remains a complex problem, as many HIV infected individuals remain unaware of their infection status, leading to parts of HIV epidemics being undiagnosed and under-reported. To that end, we firstly present a method to learn epidemiological parameters from phylogenetic trees, using approximate Bayesian computation (ABC). The epidemiological parameters learned as a result of applying ABC are subsequently used in epidemiological models that aim to simulate a specific epidemic. Secondly, we continue by describing the development of a tree statistic, rooted in coalescent theory, which we use to relate epidemiological parameters to a phylogenetic tree, by using the simulated epidemics. We show that the presented tree statistic enables differentiation of epidemiological parameters, while only relying on phylogenetic trees, thus enabling the construction of new methods to ascertain the epidemiological state of an HIV epidemic. By using genetic data to infer epidemic sizes, we expect to enhance understanding of the portions of the infected population in which diagnosis rates are low.
1 Introduction
About 37 million people are currently infected with HIV and an estimated 35 million people have died due to the effects of AIDS (the eventual result of HIV infection) since the beginning of the epidemic at the start of the twentieth century [1]. Global efforts have ensued to enhance the collection, dissemination and accessibility of epidemiological data related to HIV. One of the most burdensome aspects in curtailing the spread of HIV emerges from infected individuals being unaware of their infection status. This stems from the fact that a host can be infected for many years before noticing any symptoms [2, 3, 4]. As a result, a significant fraction of the HIV infected population remains undiagnosed, hampering effectiveness of interventions and assessment of further developments of the epidemic. Consequently, methods that deliver a well-founded estimate of the number of HIV infected individuals are paramount [5]. Such an estimate enables deduction of the number of undiagnosed infected individuals. State-of-the-art methods that aim to provide estimates of the size of HIV epidemics generally consist of applying compartment models to routine surveillance data to estimate the number of infected individuals (i.a. number of new diagnoses over time and CD4+ cell counts) [6, 7].
An abundance of clinical data is available in the context of HIV epidemics, as upon diagnosis a number of tests are performed and the results thereof collected. One of those tests comprises of assessing the specific genotype of the virus infecting a patient [8]. To that extent, the genetic sequence of the virus is determined. As a result, a vast amount of HIV sequences have been collected over the last decades.
The main benefit of developing a method to quantify a HIV epidemic that relies on genetic data is to gain insight into the specific sub-populations that contain a high rate of undiagnosed individuals, thus allowing for more effective health policies, through diagnosis strategies that are directed towards these particular sub-populations.
We validate our research on the HIV-1 epidemic in Portugal (see Section 3.1). We therefore first present inference of the epidemiological parameters of said epidemic by applying approximate Bayesian computation (ABC) [9]. We apply ABC to fit a model that contains the epidemiological parameters in question (see Section 3.2).
We further show that calibrating simulations to specific epidemics is essential, as the epidemiological dynamics has an important impact on the shape of the phylogenetic tree (see Section 4).
We then construct a tree statistic that enables differentiation of epidemiological parameters based on phylogenetic trees (see Section 3.4) and evaluate it on a set of epidemiological simulations (see Section 4.3).
2 Background
2.1 Phylogenetic trees
Phylogenetic trees represent evolutionary relationships between organisms.
A rooted phylogenetic tree consists of a root, internal nodes, leaves and branches interconnecting nodes with other nodes and leaves.
The branches of a phylogenetic tree indicate a measure of distance between the organisms represented by their respective leaves. This distance can be based on the amount of genetic change or can represent natural time, by using a molecular clock [10]. A smaller path between two nodes (i.e. traversing the tree through the nodes from one leaf to another) thus suggests a stronger evolutionary relatedness [11].
2.2 Epidemiological models
Compartment models are one of the most popular concepts stemming from mathematical epidemiology [12], Compartment models aim to capture population dynamics by stratifying individuals into different compartments, through some difference in state. They include transitions between compartments over time, representing changes in state in the modelled population. We illustrate this with the SIR Model [13], which consists of three coupled non-linear ordinary differential equations, representing the change in each compartment over time;
| (1) |
| (2) |
| (3) |
With the infection rate, the recovery rate and time.
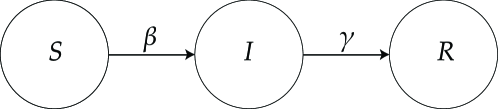
The model consists of 3 compartments; Susceptible (), Infected () and Recovered () (or removed) and transitions between those compartments (see Figure 1). , and represent the number of people in the respective compartment at a certain point in time. The rates and depend on different factors (i.a. population density, infectiousness and pathology).
The model and extended versions thereof are especially relevant when trying to answer health policy questions. In our work, such models will be used to simulate specific HIV epidemics.
2.3 Detecting missed infections in phylogenetic trees.
The starting point for our tree statistic was the method presented in [14], which uses the coalescent [15] to provide an indication of the extent to which samples are missing, or overly present in a specific phylogenetic tree.
| (4) |
With the interval index, the interval length, the number of lineages to coalesce in an interval, the population size and the lineage coalescence probability.
| (5) |
To be able to gauge to what extent the population making up the tree under investigation is under- or oversampled, one can convert the node probabilities to z-scores, by using equation 5. The equation quantifies the relation between number of leaves expected at a node and number of observed leaves for that node [14].
2.4 Portuguese HIV-1 epidemic
The first reports of HIV-1 diagnoses in Portugal go back to 1983. By 2014, 53072 diagnoses had been reported [16]. As in most European HIV epidemics, subtype B is the most prevalent HIV-1 subtype, followed by subtype G which is atypical in a European setting [17]. Within the ”men who have sex with men” risk group, the number of yearly diagnoses show a mild but steady increase, while modes of transmission have transformed from intravenous drug use being the main cause of new infections to infections stemming from heterosexual sex in the period 2000-2014 [16]. This change is associated with lower diagnoses rates overall (consistent with diagnoses in Europe in general), possibly illustrating the beneficial results of a health policy implementation that was particularly effective for intravenous drug-users (e.g. through providing single-use needles). We apply our research on data stemming from this epidemic.
3 Methods and Materials
3.1 Portuguese Data
The data used in the experiments was made available through a HIV-1 resistance database from Hospital Egas Moniz.
Henceforth, we will refer to the used data as ’Portuguese data’ for the sake of brevity.
Data storage and querying was achieved through the RegaDB system [18]. Said system allows for complex querying, which was key to assemble all the relevant data in an efficient manner.
We proceeded by querying genetic sequences of HIV-1 belonging to distinct patients.
In doing so, we assembled three genetic sequence sets, differing in the HIV-1 subtypes they contain. The first set only holds subtype B sequences (n= 2216) . The second set is made up of subtype G sequences (n=1961). And a final set (n= 6079) that does not take into account the specific subtype (and thus also includes other subtypes besides B and G). HIV-1 sequences were classified using the Rega typing tool [19, 20]. Each patient only contributed one genetic sequence to a set, if multiple sequences were associated with a single patient, the sequence established first was selected.
For each set, an alignment was created using MAFFT [21]. The resulting alignments were then used to infer phylogenetic trees using maximum likelihood trough RAxML [22].
RAxML was used with the GTR- model. A maximum likelihood tree was constructed and subsequently annotated through bootstraps. Bootstrapping was halted automatically based on extended majority rule consensus trees (i.e. autoMRE).
In order to preserve the confidential nature of the employed patient data, tree inference was carried out on local computers exclusively and only anonymized patient data was used.
3.2 Simulation calibration
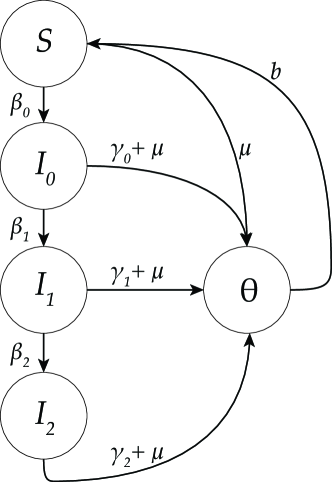
In order to validate our tree statistic on a real world epidemic, being able to generate simulation data that was plausible with regard to the real world epidemic was essential. We thus proceeded by inferring relevant epidemiological parameters in order to calibrate subsequent simulations. To that end, we opted to use ABC [9] to learn said parameters, this approach was inspired by the work presented in [23]. ABC is closely related to Markov chain Monte Carlo (MCMC), but unlike MCMC, does not require the calculation of exact likelihoods, which can be intractable for complex models [23, 24]. Learning the relevant epidemiological parameters in an ABC setting requires the presence of some distance measure, as an alternative to the exact likelihoods used in MCMC approaches. Taking into account that the available epidemic data we want to infer parameters from exists in the form of a phylogenetic tree, and the possibility of generating new phylogenetic trees through simulation, we employ a kernel method developed by Poon [25] as a distance measure between two trees. In concreto, we rely on a specified compartment model (see Figure 2 for the used model) that enables the generation of trees.
By using the aforementioned kernel method, we assume that correspondence in trees reflect similarities between the model and the epidemic underlying the observed tree. In order to explore the possible parameters of the specified model efficiently, ABC is used. In essence, ABC varies parameter values in order to simulate more data by using the proposed parameter values in a specified model and aims to minimise the distance between the newly generated data and the observed data (in this case using the kernel method as a distance measure) [9, 23]. Table 1 shows the parameters used in our ABC application.
| Parameter | Range | Initial | Prior | |
|---|---|---|---|---|
| [ - ] | , and | |||
| [ - ] | , and | |||
| [ - ] | , and | |||
| [ - ] | , and |
3.3 Simulations
rcolgem [26, 27] was used to simulate epidemics, based on parameter ranges obtained from application of the ABC-kernel method. Each simulation set consisted of 1000 simulations, outputting phylogenetic trees, and a log of the population dynamics over time. The used model (based on [28, 29]) is given by the following equations, and is illustrated in Fig. 2.
The model is an extension of a SIR model, and consists of three infection stages and includes births and deaths (i.e. conceptual addition and removal of simulated individuals) without a recovery state. Used parameter values, determined from the results of ABC application, are as follows; , , , , and while is varied between and and the sample size (i.e. the number of leaves in the tree) between and . Parameters were sampled between the specified ranges using Latin hypercube sampling. The goal being to find parameters for the simulation engine that result in phylogenetic trees that are similar to the ones inferred from the Portugal data, in order to match the underlying epidemic.
3.4 Constructing the -score
The starting point in constructing our tree statistic was the method described in [14]. The result of applying said method on a tree is an annotated tree, which includes node probabilities for each node in the tree. In order to construct our tree statistic from such an annotated tree, we devised a procedure to infer information about the population on the basis of z-scores. We proceeded by defining a statistic that demonstrates the overall extent to which a tree is over- or undersampled. We call this statistic . To convert the obtained annotated tree to a single statistic value, we rely on the z-score in the root of the tree, as node probabilities are by definition propagated to the root node; , with the z-score of the root and the number of samples (i.e. leaves) making up the tree. In order to apply the method, a tree and a need to be specified. Through experimental analyses, we found that a large is necessary to obtain informative results, we thus specified .
4 Results
4.1 Approximate Bayesian computation

Figure 3 presents the results of ABC application for the parameter. The figure indicates that the ABC chain converged after about 1500 iterations and had thus learned plausible values for said parameters with regard to the specified model.
4.2 Phylogenetic tree assessment
We first present a visual comparison of tree topologies between the tree inferred from the Portuguese dataset, a tree obtained through an ABC application calibrated simulation and a PANGEA [30] simulation, which aims to model the HIV epidemic in sub-Saharan Africa. If topologies show major discrepancies, we assume this indicated the simulations are not well calibrated with regard to the actual epidemic, while a relatively corresponding topology would indicate simulations resembling the actual epidemic. The PANGEA tree serves as an example of topology difference when comparing different epidemics.
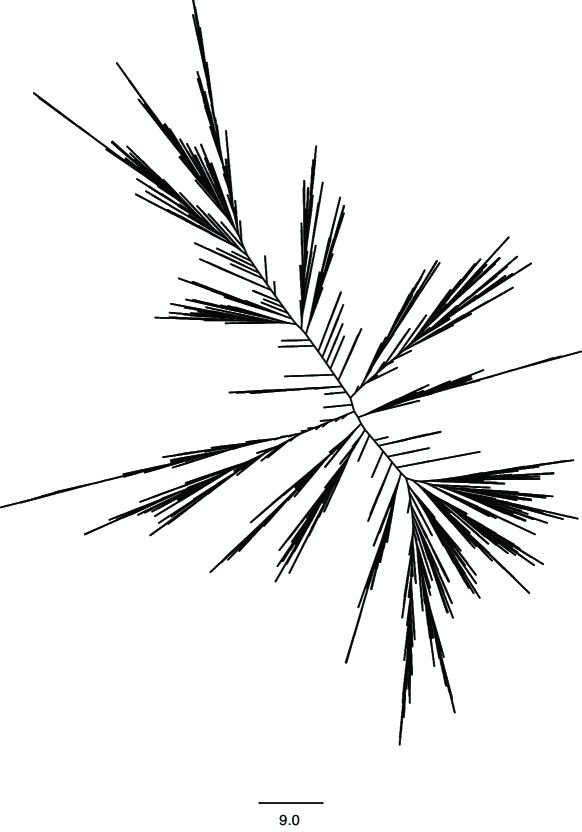
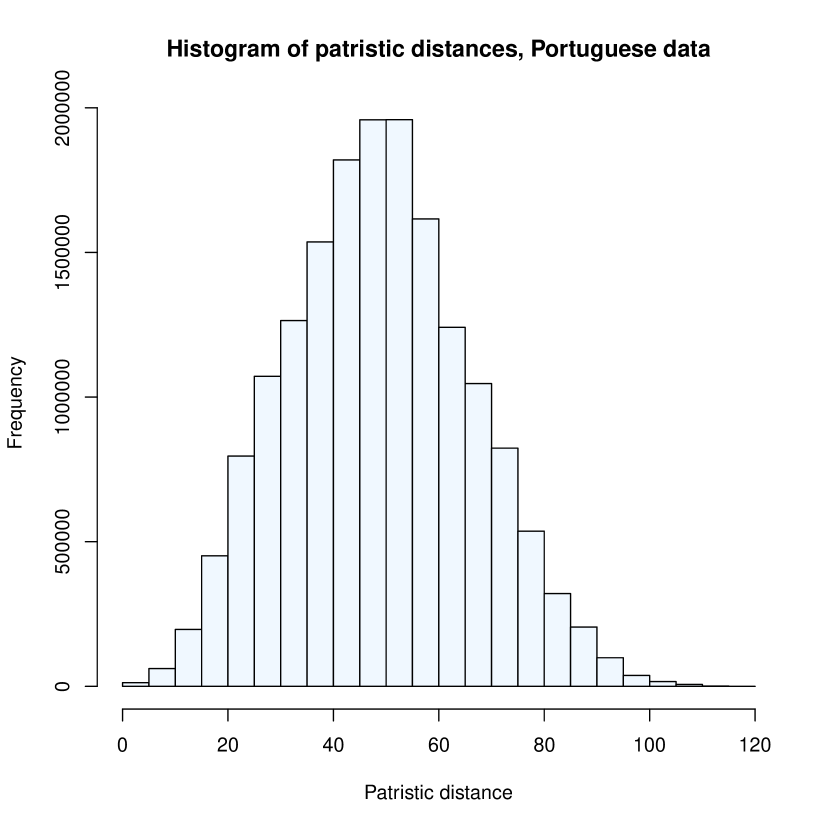
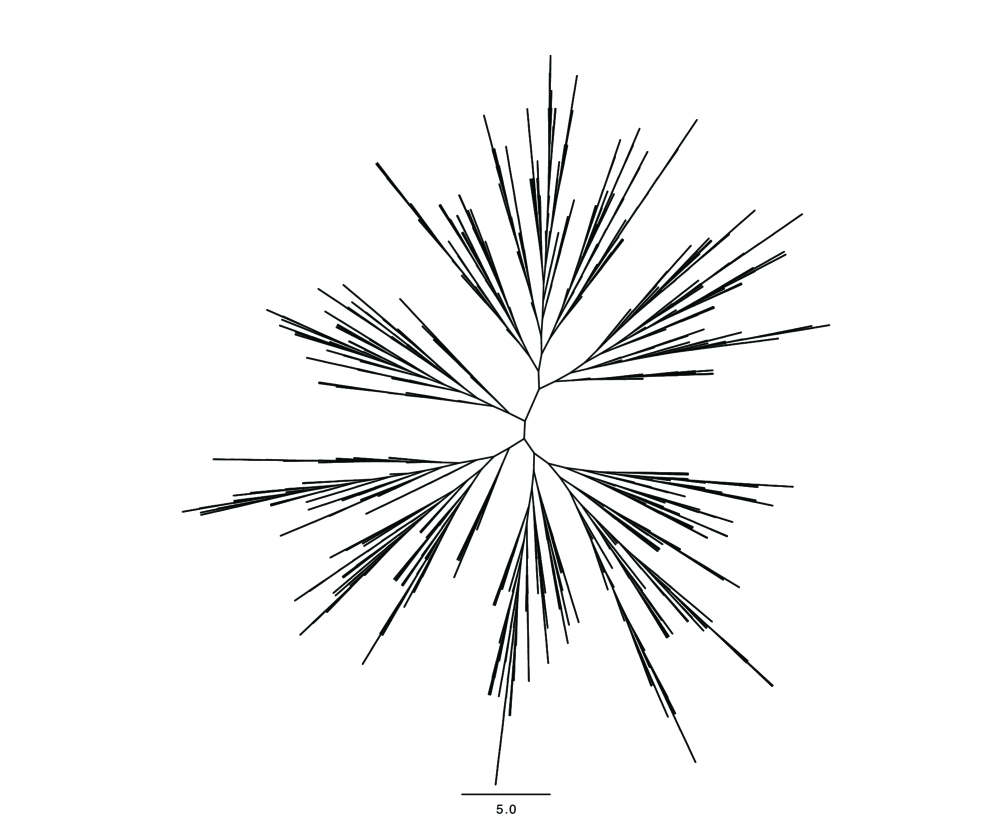
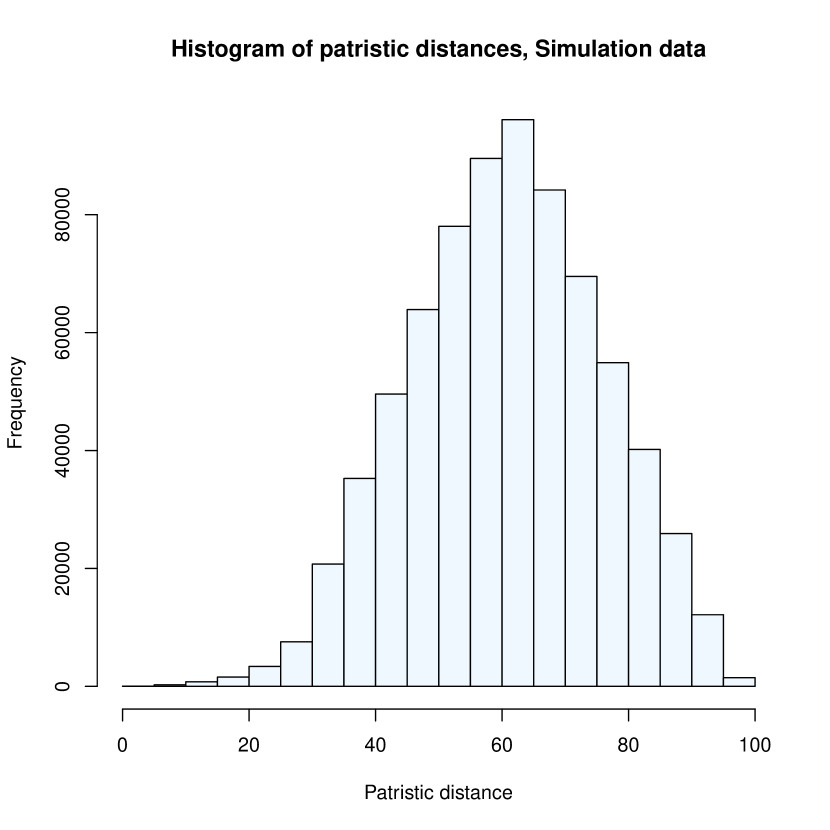
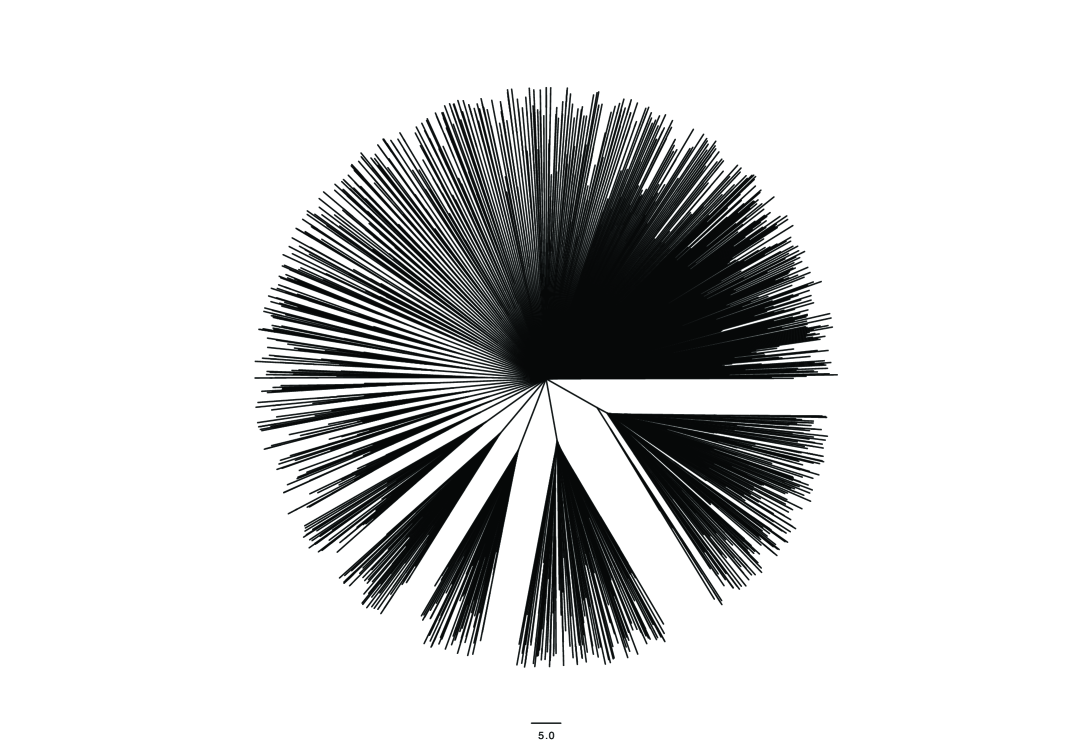
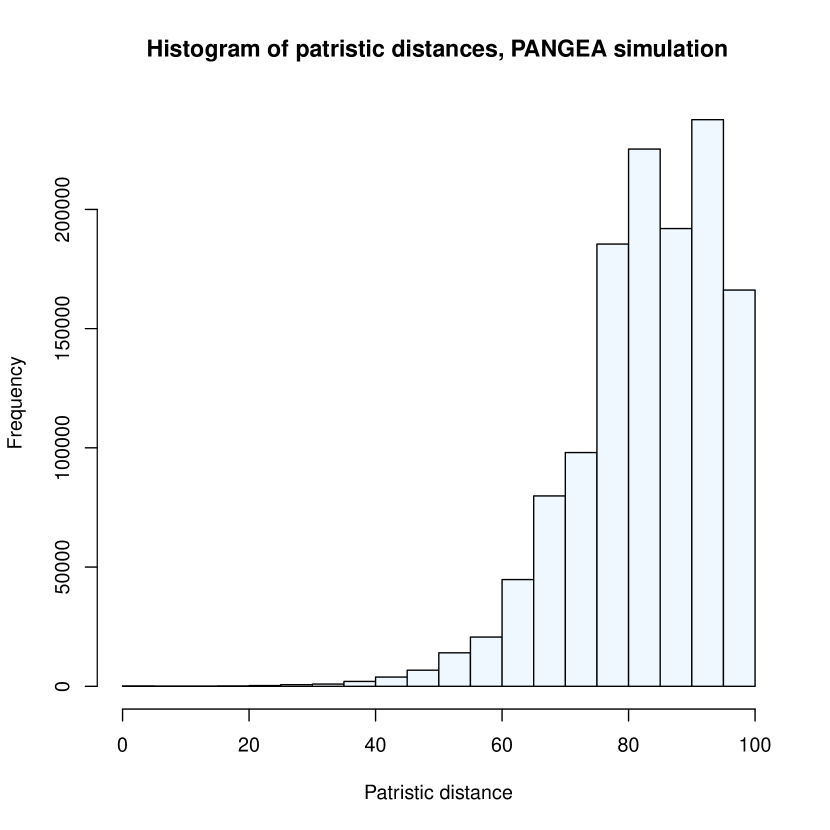
Figures 4(a), 4(c) and 4(e) provide a visual representation of the relevant phylogenetic trees. Figure 4(a) stems from the Portuguese dataset, and as such offers a baseline of desired tree topology. Figure 4(c) presents the tree obtained through a ABC calibrated simulation, and 4(e) shows a tree from a PANGEA simulation. We demonstrate visually that the relevant tree topologies display a relatively high level of correspondence. We further investigated tree correspondence by using patristic distances [31]. The patristic distance between two leaves and is the number of changes needed to in order for it to become identical to [32]. Figures 4(b), 4(b) and 4(f) present a histogram of the patristic distances present in the tree stemming from the Portuguese dataset the ABC calibrated simulated tree and the PANGEA tree respectively. These show that the ABC calibrated simulation tree is concordant with the tree stemming from the Portuguese epidemic.
4.3 -score distribution
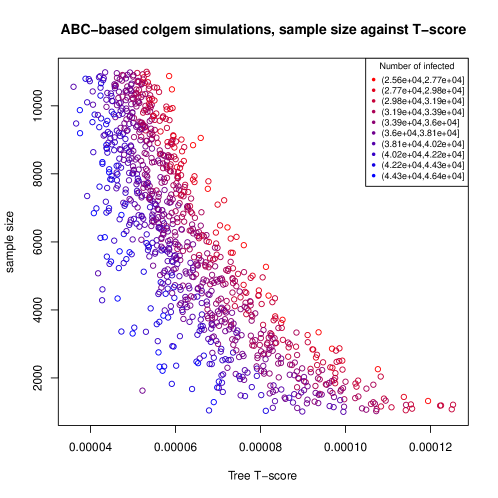
Figure 5 presents the result of application of our method on 1000 trees obtained from rcolgem simulations. In the figure, obtained scores are plotted against tree sample sizes and the number of infected individuals in the simulations, shown as a gradient from (red) to (blue). As a reminder, the number of infected individuals is determined by and . We can clearly observe a distribution that allows distinction of the number of infected by scores and sample sizes. Indicating that we obtained an informative distribution through application of our method. The figure shows that a lower score correlates with a larger portion of the infected population not being included in the phylogenetic tree. Additionally, as sample size goes down the distribution becomes wider, indicating sufficiently large trees are necessary to allow for meaningful inferences.
5 Discussion and Conclusions
The presented results show that the presented score enables differentiation of epidemiological parameters based on phylogenetic trees.
As such, an interesting further development would be to learn a function , i.e. learning the effect of epidemiological parameters on values in general, and from there, , i.e. constructing a function that relates obtained scores to possible epidemiological parameters, which we assume to be feasible, as should be ascertainable trough census data and epidemiological studies.
We would further like to extend the score to include a measure of uncertainty associated to inferences. A possible approach to accomplish this would be to apply our method on multiple subtrees, resulting from pruning the tree under investigation, and determining the extent to which results remain coherent with regard to the number of pruned leaves.
Additionally, investigating the effect of simulating epidemics using current models specifically tailored to HIV-1 (e.g. an approach where the currently prevalent CD4+ models would be adapted to generate phylogenetic trees) would be an interesting further development.
Planned further research includes adaptation of the method presented in [14] to draw coalescent probabilities from a distribution that is specific to HIV evolutionary dynamics.
We have presented a tree statistic that can be employed to assort phylogenetic trees on the basis of their underlying epidemiological parameters. By doing so, we provide a first step towards a method to infer epidemiological parameters from phylogenetic trees using coalescent theory, which would additionally be able to indicate the specific subpopulations in which diagnosis rates are low, providing a crucial tool for health policy researchers.
Acknowledgments
Pieter Libin was supported by a PhD grant of the FWO (Fonds Wetenschappelijk Onderzoek Vlaanderen) and a grant of the VUB research council (VUB/OZR2714).
References
- [1] UNAIDS. Fact sheet - latest global and regional statistics on the status of the aids epidemic., July 2017.
- [2] Lisa B Hightow-Weidman, Carol E Golin, Kelly Green, Eva NP Shaw, Pia DM MacDonald, and Peter A Leone. Identifying people with acute hiv infection: demographic features, risk factors, and use of health care among individuals with ahi in North Carolina. AIDS and Behavior, 13(6):1075–1083, 2009.
- [3] Gregory F Burton, Brandon F Keele, Jacob D Estes, Tyler C Thacker, and Suzanne Gartner. Follicular dendritic cell contributions to hiv pathogenesis. In Seminars in immunology, volume 14, pages 275–284. Elsevier, 2002.
- [4] Kristof Theys, Pieter Libin, Andrea-Clemencia Pineda-Pena, Ann Nowe, Anne-Mieke Vandamme, and Ana B Abecasis. The impact of hiv-1 within-host evolution on transmission dynamics. Current opinion in virology, 28:92–101, 2018.
- [5] Elizabeth M Begier, Yussef Bennani, Lisa Forgione, Amado Punsalang, David B Hanna, Jeffrey Herrera, Lucia Torian, Maria Gbur, Kent A Sepkowitz, and Farah Parvez. Undiagnosed hiv infection among New York City jail entrants, 2006: results of a blinded serosurvey. JAIDS Journal of Acquired Immune Deficiency Syndromes, 54(1):93–101, 2010.
- [6] Ard van Sighem, Fumiyo Nakagawa, Daniela De Angelis, Chantal Quinten, Daniela Bezemer, Eline Op de Coul, Matthias Egger, Frank de Wolf, Christophe Fraser, and Andrew Phillips. Estimating hiv incidence, time to diagnosis, and the undiagnosed hiv epidemic using routine surveillance data. Epidemiology (Cambridge, Mass.), 26(5):653, 2015.
- [7] Alessia Mammone, Patrizio Pezzotti, Vincenza Regine, Laura Camoni, Vincenzo Puro, Giuseppe Ippolito, Barbara Suligoi, and Enrico Girardi. How many people are living with undiagnosed hiv infection? an estimate for Italy, based on surveillance data. AIDS (London, England), 30(7):1131, 2016.
- [8] Madhu Vajpayee and Teena Mohan. Current practices in laboratory monitoring of hiv infection. The Indian journal of medical research, 134(6):801, 2011.
- [9] Mikael Sunnåker, Alberto Giovanni Busetto, Elina Numminen, Jukka Corander, Matthieu Foll, and Christophe Dessimoz. Approximate bayesian computation. PLoS computational biology, 9(1):e1002803, 2013.
- [10] Mark Ridley. Evolution. John Wiley & Sons Incorporated, 2009.
- [11] Marco Salemi, Philippe Lemey, and Anne-Mieke Vandamme. The phylogenetic handbook: a practical approach to phylogenetic analysis and hypothesis testing. Cambridge University Press, 2009.
- [12] Fred Brauer. Compartmental models in epidemiology. In Mathematical epidemiology, pages 19–79. Springer, 2008.
- [13] William O Kermack and Anderson G McKendrick. A contribution to the mathematical theory of epidemics. In Proceedings of the Royal Society of London A: mathematical, physical and engineering sciences, volume 115, pages 700–721. The Royal Society, 1927.
- [14] Stephanie Stacy, Allison Black, and Trevor Bedford. Using the coalescent framework to detect missed infections in phylogenetic trees. SURP, Fred Hutchinson, 2016.
- [15] John FC Kingman. The coalescent. Stochastic processes and their applications, 13(3):235–248, 1982.
- [16] António Diniz, Raquel Duarte, Joana Bettencourt, Teresa Melo, Paulo Nogueira, Carla Farinha, Maria Isabel Alves, José Martins, and Ana Lisette Oliveira. Portugal infeção vih, sida e tuberculose em números, 2015. Portugal Infeção VIH, SIDA e Tuberculose em números, 2015, pages 5–70, 2015.
- [17] Ana B Abecasis, Annemarie MJ Wensing, Dimitris Paraskevis, Jurgen Vercauteren, Kristof Theys, David AMC Van de Vijver, Jan Albert, Birgitta Asjö, Claudia Balotta, Danail Beshkov, et al. Hiv-1 subtype distribution and its demographic determinants in newly diagnosed patients in europe suggest highly compartmentalized epidemics. Retrovirology, 10(1):7, 2013.
- [18] Pieter Libin, Gertjan Beheydt, Koen Deforche, Stijn Imbrechts, Fossie Ferreira, Kristel Van Laethem, Kristof Theys, Ana Patricia Carvalho, Joana Cavaco-Silva, Giuseppe Lapadula, et al. Regadb: community-driven data management and analysis for infectious diseases. Bioinformatics, 29(11):1477–1480, 2013.
- [19] Andrea-Clemencia Pineda-Peña, Nuno Rodrigues Faria, Stijn Imbrechts, Pieter Libin, Ana Barroso Abecasis, Koen Deforche, Arley Gómez-López, Ricardo J Camacho, Tulio de Oliveira, and Anne-Mieke Vandamme. Automated subtyping of hiv-1 genetic sequences for clinical and surveillance purposes: performance evaluation of the new rega version 3 and seven other tools. Infection, Genetics and Evolution, 19:337–348, 2013.
- [20] Luiz Carlos Junior Alcantara, Sharon Cassol, Pieter Libin, Koen Deforche, Oliver G Pybus, Marc Van Ranst, Bernardo Galvao-Castro, Anne-Mieke Vandamme, and Tulio de Oliveira. A standardized framework for accurate, high-throughput genotyping of recombinant and non-recombinant viral sequences. Nucleic acids research, 37(suppl_2):W634–W642, 2009.
- [21] Kazutaka Katoh, Kazuharu Misawa, Kei-ichi Kuma, and Takashi Miyata. Mafft: a novel method for rapid multiple sequence alignment based on fast fourier transform. Nucleic acids research, 30(14):3059–3066, 2002.
- [22] Alexandros Stamatakis. Raxml version 8: a tool for phylogenetic analysis and post-analysis of large phylogenies. Bioinformatics, 30(9):1312–1313, 2014.
- [23] Art FY Poon. Phylodynamic inference with kernel abc and its application to hiv epidemiology. Molecular biology and evolution, 32(9):2483–2495, 2015.
- [24] Pieter Libin, Laurens Hernalsteen, Kristof Theys, Perpetua Gomes, Ana Abecasis, and Ann Nowe. Bayesian inference of set-point viral load transmission models. In 30th Benelux Conference on Artificial Intelligence, pages 107–121, 2018.
- [25] Art FY Poon, Lorne W Walker, Heather Murray, Rosemary M McCloskey, P Richard Harrigan, and Richard H Liang. Mapping the shapes of phylogenetic trees from human and zoonotic rna viruses. PLoS one, 8(11):e78122, 2013.
- [26] David A Rasmussen, Erik M Volz, and Katia Koelle. Phylodynamic inference for structured epidemiological models. PLoS computational biology, 10(4):e1003570, 2014.
- [27] Erik M Volz. Complex population dynamics and the coalescent under neutrality. Genetics, 190(1):187–201, 2012.
- [28] Erik M Volz. Estimating hiv transmission rates with rcolgem, 2014. accessed: August 2017.
- [29] Erik M Volz. Simulating genealogies with an epidemiological coalescent model using rcolgem, 2015. accessed: August 2017.
- [30] Oliver Ratmann, Emma B. Hodcroft, Michael Pickles, Anne Cori, Matthew Hall, Samantha Lycett, Caroline Colijn, Bethany Dearlove, Xavier Didelot, Simon Frost, A.S. Md Mukarram Hossain, Jeffrey B. Joy, Michelle Kendall, Denise Kühnert, Gabriel E. Leventhal, Richard Liang, Giacomo Plazzotta, Art F.Y. Poon, David A. Rasmussen, Tanja Stadler, Erik Volz, Caroline Weis, Andrew J. Leigh Brown, Christophe Fraser, and . Phylogenetic tools for generalized hiv-1 epidemics: Findings from the pangea-hiv methods comparison. Molecular Biology and Evolution, 34(1):185–203, 2017.
- [31] Pieter Libin, Ewout Vanden Eynden, Francesca Incardona, Ann Nowé, Antonia Bezenchek, EucoHIV Study Group, Anders Sönnerborg, Anne-Mieke Vandamme, Kristof Theys, and Guy Baele. Phylogeotool: interactively exploring large phylogenies in an epidemiological context. Bioinformatics, 33(24):3993–3995, 2017.
- [32] Tod F Stuessy and Christiane König. Patrocladistic classification. Taxon, 57(2):594–601, 2008.