Automatic Quality Estimation for Natural Language Generation:
Ranting (Jointly Rating and Ranking)
Abstract
We present a recurrent neural network based system for automatic quality estimation of natural language generation (NLG) outputs, which jointly learns to assign numerical ratings to individual outputs and to provide pairwise rankings of two different outputs. The latter is trained using pairwise hinge loss over scores from two copies of the rating network.
We use learning to rank and synthetic data to improve the quality of ratings assigned by our system: we synthesise training pairs of distorted system outputs and train the system to rank the less distorted one higher. This leads to a 12% increase in correlation with human ratings over the previous benchmark. We also establish the state of the art on the dataset of relative rankings from the E2E NLG Challenge Dušek et al. (2019), where synthetic data lead to a 4% accuracy increase over the base model.
(2.5cm,1cm) In Proceedings of INLG, Tokyo, Japan, October 2019.
1 Introduction
While automatic output quality estimation (QE) is an established field of research in other areas of NLP, such as machine translation (MT) Specia et al. (2010, 2018), research on QE in natural language generation (NLG) from structured meaning representations (MR) such as dialogue acts is relatively recent Dušek et al. (2017); Ueffing et al. (2018) and often focuses on output fluency only Tian et al. (2018); Kann et al. (2018). In contrast to traditional metrics, QE does not rely on gold-standard human reference texts Specia et al. (2010), which are expensive to obtain, do not cover the full output space, and are not accurate on the level of individual outputs Novikova et al. (2017); Reiter (2018). Automatic QE for NLG has several possible use cases that can improve NLG quality and reliability. For example, rating individual NLG outputs allows to ensure a minimum output quality and engage a backup, e.g., template-based NLG system, if a certain threshold is not met. Relative ranking of multiple NLG outputs can be used directly within a system to rerank n-best outputs or to guide system development, selecting optimal system parameters or comparing to state of the art.
In this paper, we present a novel model that jointly learns to perform both tasks—rating individual outputs as well as pairwise ranking. We show that this leads to performance improvements over previously published results Dušek et al. (2017). Our model is portable, since we do not assume any specific input schema and only rely on ratings of the text output, which are relatively easy to obtain, e.g. through crowdsourcing for a small number of outputs of an initial NLG system. The model learns to rank or rate according to any criterion annotated in the data, such as adequacy, fluency, or overall quality (see e.g., Wen et al., 2015; Manishina et al., 2016; Novikova et al., 2017). Our main contributions are as follows:
-
•
A novel, domain- and input representation-agnostic, and conceptually simple model for NLG QE, which jointly learns ratings and pairwise rankings. It is able to seamlessly switch between the two and is directly applicable for n-way ranking (see Section 3). Crucially, it does not require human-authored references during inference.
-
•
An original methodology for synthetically generating training instances for pairwise ranking based on introducing errors (see Section 4).
-
•
A significant, 12% relative improvement in Pearson correlation with human ratings over results previously published on the dataset of Novikova et al. (2017), as well as the first pairwise ranking results for NLG QE on the E2E ranking dataset of Dušek et al. (2019), with significant improvements over the baseline due to synthetic training instance generation (see Sections 5 and 6).
Both datasets are freely available, and we release our experimental code on GitHub.111The datasets can be downloaded under the following links: https://github.com/jeknov/EMNLP_17_submission, http://www.macs.hw.ac.uk/InteractionLab/E2E/. Our code is available at https://github.com/tuetschek/ratpred.
2 The Task(s)
| Instance | Rating/Rank | |
|---|---|---|
| MR | inform_only_match(name=‘hotel drisco’, area=‘pacific heights’) | 4 |
| RNNLG output | the only match i have for you is the hotel drisco in the pacific heights area. | |
| MR | inform(name=‘The Cricketers’, eat_type=‘coffee shop’, rating=high, family_friendly=yes, near=‘Café Sicilia’) | |
| Zhang output | The Cricketers is a children friendly coffee shop near Café Sicilia with a high customer rating . | better |
| TR2 output | The Cricketers can be found near the Café Sicilia. Customers give this coffee shop a high rating. It’s family friendly. | worse |
The task of NLG QE for ratings is to assign a numerical score to a single NLG output, given its input MR, such as a dialogue act (consisting of the main intent, attributes and values). The score can be e.g. on a Likert scale in the 1-6 range Novikova et al. (2017). In a pairwise ranking task, the QE system is given two outputs of different NLG systems for the same MR, and decides which one has better quality (see Figure 1).
3 Model
Our model is a direct extension of the freely available RatPred system Dušek et al. (2017). The original RatPred model assigns numerical ratings to single outputs and is a dual-encoder Lu et al. (2017), consisting of two GRU-based recurrent neural networks Cho et al. (2014) encoding the MR and the system output, followed by fully connected layers and a final linear layer providing the score. The system is trained using squared error loss, and it uses dropout over embeddings Hinton et al. (2012).
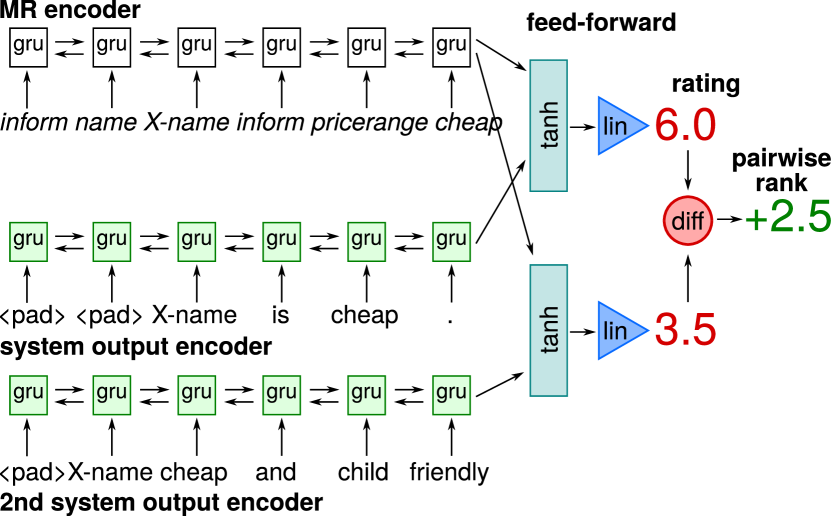
We make RatPred’s encoders bidirectional and add a novel extension to allow pairwise ranking—a second copy of the system output encoder plus the fully connected layers and linear layer (Figure 2). All network parameters are shared among the two copies. This way, the network is able to rate two NLG outputs at once. We add a simple difference operator on top of this; the pairwise rank is computed as the difference between the two predicted scores. In addition to the squared loss for rating, we incur pairwise hinge loss for ranking. The final loss function looks as follows:
indicates if the current instance is a ranking-based one (value of 1 for ranking and 0 for rating, effectively a mask to only incur the correct loss). denotes the true score for a NLG output, and denote scores assigned by the model for (up to) two NLG outputs.222Since the ranking result is a difference of two scores assigned by copies of the same network, we can assume without loss of generality that ranks higher than . Note that is ignored in rating instances, while a true score is ignored for ranking. This way, the same network performs ranking and rating jointly, and it can be exposed to training instances of both types in any order. Our model is also directly applicable to n-way rankings—using it to score a group of NLG outputs and comparing the scores is equivalent to comparing the pairwise ranking.
Jointly learning to rank and rate was first introduced by Sculley (2010) for support vector machines and similar approaches have been applied for image classification Park et al. (2017); Liu et al. (2018) as well as audio classification Lee et al. (2016), However, we argue that the application for text classification/QE is novel, as is the implementation as a single neural network with two parts that share parameters, capable of training from mixed ranking/rating instances with masking to incur the proper loss.
4 Synthetic Training Data Generation
| MR | inform(name=’house of nanking’,food=chinese) |
|---|---|
| RNNLG output (0 errors) | house of nanking serves chinese food . |
| \hdashline[0.5pt/2pt] 1 error | house of nanking restaurant chinese food . |
| 2 errors | house of nanking serves food chinese food cheaply . |
| 3 errors | food house of nanking house of nanking serves chinese chinese food . |
Synthesising errors: The original NLG output is distorted by introducing errors (underlined) of the following types: Words in the texts are removed or duplicated at original or random positions, random words from a dictionary learned from training data are used to replace current words or added at random positions. Other words are preferred over articles and punctuation in making the changes (see Dušek et al., 2017 for details).
Rating instances: We use the same settings as Dušek et al. (2017) for synthetic individual rating instances – generating up to 4 errors and lowering the target rating by 1 each time (lowering by 2 if the original value was 6). We are able to generate more synthetic rating instances since Dušek et al. (2017) did not use all available NLG system outputs due to a bug in their code (cf. Table 1).
Ranking Instances: Following our new method, pairs of outputs with a different number of errors (e.g., 0-1, 1-3) are then sampled as synthetic training instances for ranking. In our setting, we introduce up to 4 errors and create instances for all numbers of errors against the original (0-1 through 0-4), plus a set of 5 other, randomly chosen instances (e.g. 1-3, 2-4). We use both rating and ranking synthetic instances for NEM data and only ranking synthetic instances for E2E data.
We use RatPred’s code to generate synthetic rating instances from both NLG outputs and human-authored texts by distorting the text and lowering its score (i.e., randomly removing or adding words; cf. Dušek et al. (2017) and Figure 3 for details). We also create synthetic training pairs by using the same NLG output/human-authored text under two different levels of distortion (e.g., one vs. two artificially introduced errors). The system is then trained to rank higher the version of the text with fewer errors (see Figure 3 for an example). This novel approach can be used to generate synthetic training data for both ranking and rating tasks—in a rating task, the generated ranking instances are simply mixed among the original training instances for rating, and the model uses both kinds for training. Note that synthetic data are never used for validation or testing in any of our setups.
5 Experimental Setup
5.1 Datasets
We experiment on the following two datasets, both in the restaurant/hotel information domain:
-
•
NEM333While the dataset authors did not give it a name, we use “NEM” as an acronym for “New Evaluation Metrics”, which comes from the title of the paper. Novikova et al. (2017) – Likert-scale rated outputs (scores 1–6) of 3 NLG systems over 3 datasets, totalling 2,460 instances.
-
•
E2E system rankings Dušek et al. (2019) – outputs of 21 systems on a single NLG dataset with 2,979 5-way relative rankings.
We choose these two datasets because they contain human-assessed outputs from a variety of NLG systems. Another candidate is the WebNLG corpus Gardent et al. (2017), which we leave for future work due to MR format differences.
Although both selected datasets contain ratings for multiple criteria (informativeness, naturalness and quality for NEM and the latter two for E2E), we follow Dušek et al. (2017) and focus on the overall quality criterion in our experiments as it takes both semantic accuracy and fluency into account.
We use RatPred’s preprocessing, synthetic data generation, and 5-way cross-validation split on the NEM dataset. In addition, we generate synthetic training pairs as described in Section 4. We convert the 5-way rankings from the E2E set to pairwise rankings Sakaguchi et al. (2014) (leaving out ties), which produces 15,001 instances. We split the data into training, development and test sections in an 8:1:1 ratio, ensuring that each section contains NLG outputs for different MRs Lampouras and Vlachos (2016).444We first split the data according to MRs, then assign different MRs with all corresponding system outputs into different sections. In addition to the human-assessed NLG outputs themselves, human-authored training data for the NLG systems are also available and are used for synthetic instances. We use a partial delexicalisation (replacing names with placeholders).555See Table 3 in the Supplementary for details.
5.2 Model Settings
We evaluate our model in several configurations, with increasing amounts of synthetic training data. Note that even setups using training human references (i.e. additional in-domain data) are still “referenceless”—they do not use human references for test MRs. Setups using human references for validation and test MRs (“reference-aided”; marked with “*” in Table 1) are not referenceless and are mainly shown for comparison with Dušek et al. (2017).
We use the same network parameters for all setups, selected based on a small-scale grid search on the development data of both sets, taking training speed into consideration.666See Table 4 in the Supplementary for details. As a result, we use a network with fewer parameters than Dušek et al. (2017), which makes our base setup worse-performing than the original base setup, despite our use of bidirectional encoders (cf. Section 6). On the other hand, training runs several times faster. We use Adam Kingma and Ba (2015) for training, evaluating on the validation set after each epoch and selecting the best-performing configuration. Synthetic data are removed after 50 (out of 100) epochs. Following Dušek et al. (2017), we run all experiments with 5 different random initializations of the networks and report averaged results.
5.3 Evaluation Metrics
On the NEM data, we follow Dušek et al. (2017) to compare with their results. We use Pearson correlation of system-provided ratings with human ratings as our primary evaluation metric; we also measure Spearman rank correlation, mean absolute error (MAE) and root mean squared error (RMSE). On the E2E data, we use pairwise ranking accuracy (or Precision@1), a common ranking metric. We also measure mean ranking loss, i.e., mean score difference in wrongly rated instances.
6 Results and Discussion
| System | Training insts | Pearson | Spearman | MAE | RMSE |
| Constant | - | - | - | 1.013 | 1.233 |
| BLEU* Papineni et al. (2002) | - | 0.074 | 0.061 | 2.264 | 2.731 |
| METEOR* Lavie and Agarwal (2007) | - | 0.095 | 0.099 | 1.820 | 2.129 |
| ROUGE-L* Lin (2004) | - | 0.079 | 0.072 | 1.312 | 1.674 |
| CIDEr* Vedantam et al. (2015) | - | 0.061 | 0.058 | 2.606 | 2.935 |
| \hdashline[0.5pt/2pt] RatPred Dušek et al. (2017) base system | 1,476 | 0.273 | 0.260 | 0.948 | 1.258 |
| + generated data based on training system outputs | 3,937 | 0.283 | 0.268 | 0.948 | 1.273 |
| + generated data based on training human references | 45,137 | 0.330 | 0.274 | 0.914 | 1.226 |
| \hdashline[0.5pt/2pt] + generated data based on test human references* | 80,522 | 0.354 | 0.287 | 0.909 | 1.208 |
| Our base system | 1,476 | 0.253 | 0.252 | 0.917 | 1.221 |
| + generated data based on training system outputs | 8,856 | 0.332 | 0.308 | 0.924 | 1.241 |
| + generated pairs for ranking | 22,140 | 0.347 | 0.320 | 0.936 | 1.261 |
| + generated data based on training human references | 59,436 | 0.343 | 0.278 | 0.922 | 1.238 |
| + generated pairs for ranking | 163,764 | 0.369 | 0.295 | 0.925 | 1.250 |
| \hdashline[0.5pt/2pt] + generated data based on test human references* | 85,441 | 0.344 | 0.265 | 0.925 | 1.249 |
| + generated pairs for ranking* | 236,578 | 0.345 | 0.256 | 0.944 | 1.277 |
| System | Training insts | Accuracy | Avg. loss |
|---|---|---|---|
| Our base system | 11,921 | 0.708 | 0.173 |
| + generated pairs based on training system outputs | 50,324 | 0.732† | 0.158 |
| + generated pairs based on training human references | 428,873 | 0.740 | 0.153 |
The results on the NEM dataset in Table 1 show that our improved synthetic data generation methods bring significant improvements in correlation.777We used the Williams (1959) test to assess significant differences in correlation, following Graham and Baldwin (2014) and Kilickaya et al. (2017). On the other hand, they worsen MAE and RMSE scores slightly, probably due to missing supervision on the exact rating in synthetic ranking instances. Compared to Dušek et al. (2017), we get a 12% increase in Pearson correlation on the best referenceless configurations; our best referenceless system method outperforms even Dušek et al. (2017)’s reference-aided system. Note that the absolute correlations, while still not ideal, are much higher than those achieved by word-overlap-based metrics such as BLEU, which stay well below 0.1.
Our reference-aided setup did not improve with synthetic ranking pairs. Probably this is because there are already enough training data for the domain. Furthermore, this system is more prone to overfit the validation set (exploiting validation references during training). The intra-class correlation coefficient (ICC) of 0.45 measuring rater agreement on the NEM data as reported by Novikova et al. (2017) (‘moderate agreement’) also suggests that a certain level of noise may hinder further improvements on this dataset.
Table 2 shows our results on the E2E data. Here, all configurations perform well above random chance (i.e. accuracy of 0.5). Using the synthesised ranking pairs brings a small but statistically significant888We used pairwise bootstrap resampling Koehn (2004) to assess significance in ranking accuracy. improvement over the base model (3% using only NLG system outputs, additional 1% if also human references from NLG system training data are used for synthetic pairs generation).
We also explored training the system using data from both sets; however, this did not bring performance improvements, probably due to different text styles in the two datasets – the NEM data include requests, confirmations, etc., while the E2E data only contain informative statements.
7 Related Work
QE has been an active topic in many NLP tasks—image captioning Anderson et al. (2016), dialogue response generation Lowe et al. (2017), grammar correction Napoles et al. (2016) or text simplification Martin et al. (2018)—with MT being perhaps the most prominent area Specia et al. (2010); Avramidis (2012); Specia et al. (2018). QE for NLG recently saw an increase of focus in various subtasks, such as title generation Ueffing et al. (2018); Camargo de Souza et al. (2018) or content selection and ordering Wiseman et al. (2017). Furthermore, several recent studies focus on predicting NLG fluency only, e.g., Tian et al. (2018); Kann et al. (2018).
However, apart from our work, Dušek et al. (2017) is the only general NLG QE system to our knowledge, which aims to predict the overall quality of a generated utterance, where quality includes both fluency and semantic coverage of the MR. Note that the correct semantic coverage of MRs is a problem for many neural NLG approaches Gehrmann et al. (2018); Dušek et al. (2019); Nie et al. (2019). Compared to Dušek et al. (2017), our model is able to jointly rate and rank NLG outputs and includes better synthetic training data creation methods.
Our approach to QE is similar to adversarial evaluation—distinguishing between human- and machine-generated outputs (Goodfellow et al., 2014). This approach is employed in generators for random text Bowman et al. (2016) and dialogue responses Kannan and Vinyals (2016); Li et al. (2017); Bruni and Fernandez (2017). We argue that our approach is more explainable with users being able to reason with the ordinal output score.
Acknowledgments
This research received funding from the EPSRC projects DILiGENt (EP/M005429/1) and MaDrIgAL (EP/N017536/1) and Charles University project PRIMUS/19/SCI/10.
References
- Anderson et al. (2016) Peter Anderson, Basura Fernando, Mark Johnson, and Stephen Gould. 2016. Spice: Semantic propositional image caption evaluation. In Proceedings of the European Conference on Computer Vision, pages 382–398, Amsterdam, The Netherlands.
- Avramidis (2012) Eleftherios Avramidis. 2012. Comparative quality estimation: Automatic sentence-level ranking of multiple machine translation outputs. In Proceedings of the International Conference on Computational Linguistics, pages 115–132, Mumbai, India.
- Bowman et al. (2016) Samuel R Bowman, Luke Vilnis, Oriol Vinyals, Andrew M Dai, Rafal Jozefowicz, and Samy Bengio. 2016. Generating sentences from a continuous space. In Proceedings of the SIGNLL Conference on Computational Natural Language Learning, Berlin, Germany.
- Bruni and Fernandez (2017) Elia Bruni and Raquel Fernandez. 2017. Adversarial evaluation for open-domain dialogue generation. In Proceedings of the 18th Annual SIGdial Meeting on Discourse and Dialogue, pages 284–288, Saarbrücken, Germany.
- Cho et al. (2014) Kyunghyun Cho, Bart van Merrienboer, Caglar Gulcehre, Dzmitry Bahdanau, Fethi Bougares, Holger Schwenk, and Yoshua Bengio. 2014. Learning Phrase Representations using RNN Encoder-Decoder for Statistical Machine Translation. In Proceedings of the Conference on Empirical Methods in Natural Language Processing, pages 1724–1734, Doha, Qatar.
- Dušek et al. (2017) Ondřej Dušek, Jekaterina Novikova, and Verena Rieser. 2017. Referenceless Quality Estimation for Natural Language Generation. In Proceedings of the Workshop on Learning to Generate Natural Language, Sydney, Australia. arXiv:1708.01759.
- Dušek et al. (2019) Ondřej Dušek, Jekaterina Novikova, and Verena Rieser. 2019. Evaluating the State-of-the-Art of End-to-End Natural Language Generation: The E2E NLG Challenge. Computer Speech & Language, 59:123–156. arXiv:1901.07931.
- Gardent et al. (2017) Claire Gardent, Anastasia Shimorina, Shashi Narayan, and Laura Perez-Beltrachini. 2017. The WebNLG Challenge: Generating Text from RDF Data. In Proceedings of the International Conference on Natural Language Generation, pages 124–133, Santiago de Compostela, Spain.
- Gehrmann et al. (2018) Sebastian Gehrmann, Falcon Z. Dai, Henry Elder, and Alexander M. Rush. 2018. End-to-End Content and Plan Selection for Data-to-Text Generation. In Proceedings of the International Conference on Natural Language Generation, Tilburg, The Netherlands.
- Goodfellow et al. (2014) Ian Goodfellow, Jean Pouget-Abadie, Mehdi Mirza, Bing Xu, David Warde-Farley, Sherjil Ozair, Aaron Courville, and Yoshua Bengio. 2014. Generative adversarial nets. In Proceedings of the Advances in Neural Information Processing Systems, pages 2672–2680, Montréal, Canada.
- Graham and Baldwin (2014) Yvette Graham and Timothy Baldwin. 2014. Testing for Significance of Increased Correlation with Human Judgment. In Proceedings of the Conference on Empirical Methods in Natural Language Processing, pages 172–176, Doha, Qatar.
- Hinton et al. (2012) Geoffrey E. Hinton, Nitish Srivastava, Alex Krizhevsky, Ilya Sutskever, and Ruslan R. Salakhutdinov. 2012. Improving neural networks by preventing co-adaptation of feature detectors. arXiv:1207.0580.
- Kann et al. (2018) Katharina Kann, Sascha Rothe, and Katja Filippova. 2018. Sentence-Level Fluency Evaluation: References Help, But Can Be Spared! In Proceedings of the Conference on Computational Natural Language Learning, pages 313–323, Brussels, Belgium.
- Kannan and Vinyals (2016) Anjuli Kannan and Oriol Vinyals. 2016. Adversarial evaluation of dialogue models. In NIPS Workshop on Adversarial Training, Barcelona, Spain. arXiv:1701.08198.
- Kilickaya et al. (2017) Mert Kilickaya, Aykut Erdem, Nazli Ikizler-Cinbis, and Erkut Erdem. 2017. Re-evaluating Automatic Metrics for Image Captioning. In Proceedings of the Conference of the European Chapter of the ACL, pages 199–209, Valencia, Spain.
- Kingma and Ba (2015) Diederik Kingma and Jimmy Ba. 2015. Adam: A Method for Stochastic Optimization. In Proceedings of the International Conference on Learning Representations, San Diego, CA, USA. arXiv:1412.6980.
- Koehn (2004) Philipp Koehn. 2004. Statistical significance tests for machine translation evaluation. In Proceedings of the Conference on Empirical Methods in Natural Language Processing, pages 388–395, Barcelona, Spain.
- Lampouras and Vlachos (2016) Gerasimos Lampouras and Andreas Vlachos. 2016. Imitation learning for language generation from unaligned data. In Proceedings of the International Conference on Computational Linguistics: Technical Papers, pages 1101–1112, Osaka, Japan.
- Lavie and Agarwal (2007) Alon Lavie and Abhaya Agarwal. 2007. Meteor: An Automatic Metric for MT Evaluation with High Levels of Correlation with Human Judgments. In Proceedings of the Workshop on Statistical Machine Translation, pages 228–231, Prague, Czech Republic.
- Lee et al. (2016) Hung-Shin Lee, Yu Tsao, Chi-Chun Lee, Hsin-Min Wang, Wei-Cheng Lin, Wei-Chen Chen, Shan-Wen Hsiao, and Shyh-Kang Jeng. 2016. Minimization of Regression and Ranking Losses with Shallow Neural Networks on Automatic Sincerity Evaluation. In Proceedings of InterSpeech, pages 2031–2035, San Francisco, CA, USA.
- Li et al. (2017) Jiwei Li, Will Monroe, Tianlin Shi, Sébastien Jean, Alan Ritter, and Dan Jurafsky. 2017. Adversarial learning for neural dialogue generation. In Proceedings of the Conference on Empirical Methods in Natural Language Processing, pages 2157–2169, Copenhagen, Denmark.
- Lin (2004) Chin-Yew Lin. 2004. ROUGE: A package for automatic evaluation of summaries. In Text summarization branches out: Proceedings of the ACL-04 workshop, pages 74–81, Barcelona, Spain.
- Liu et al. (2018) Xiaobai Liu, Qian Xu, Jingjie Yang, Jacob Thalman, Shuicheng Yan, and Jiebo Luo. 2018. Learning Multi-Instance Deep Ranking and Regression Network for Visual House Appraisal. IEEE Transactions on Knowledge and Data Engineering, 30(8):1496–1506.
- Lowe et al. (2017) Ryan Lowe, Michael Noseworthy, Iulian V. Serban, Nicolas Angelard-Gontier, Yoshua Bengio, and Joelle Pineau. 2017. Towards an automatic Turing test: learning to evaluate dialogue responses. In Proceedings of Annual Meeting of the ACL, pages 1116–1126, Vancouver, Canada.
- Lu et al. (2017) Yichao Lu, Phillip Keung, Shaonan Zhang, Jason Sun, and Vikas Bhardwaj. 2017. A practical approach to dialogue response generation in closed domains. arXiv:1703.09439.
- Mairesse et al. (2010) F. Mairesse, M. Gašić, F. Jurčíček, S. Keizer, B. Thomson, K. Yu, and S. Young. 2010. Phrase-based statistical language generation using graphical models and active learning. In Proceedings of the Annual Meeting of the ACL, pages 1552–1561, Uppsala, Sweden.
- Manishina et al. (2016) Elena Manishina, Bassam Jabaian, Stéphane Huet, and Fabrice Lefevre. 2016. Automatic Corpus Extension for Data-driven Natural Language Generation. In Proceedings of the Tenth International Conference on Language Resources and Evaluation (LREC 2016), pages 3624–3631, Portorož, Slovenia.
- Martin et al. (2018) Louis Martin, Samuel Humean, and Pierre-Emmanuel Mazare. 2018. Reference-less Quality Estimation of Text Simplification Systems. In Proceedings of the 1st Workshop on Automatic Text Adaption, Tilburg, The Netherlands.
- Napoles et al. (2016) Courtney Napoles, Keisuke Sakaguchi, and Joel Tetreault. 2016. There’s No Comparison: Reference-less Evaluation Metrics in Grammatical Error Correction. In Proceedings of the Conference on Empirical Methods in Natural Language Processing, pages 2109–2115, Austin, TX, USA.
- Nie et al. (2019) Feng Nie, Jin-Ge Yao, Jinpeng Wang, Rong Pan, and Chin-Yew Lin. 2019. A Simple Recipe towards Reducing Hallucination in Neural Surface Realisation. In Proceedings of the 57th Annual Meeting of the Association for Computational Linguistics, pages 2673–2679, Florence, Italy.
- Novikova et al. (2017) Jekaterina Novikova, Ondřej Dušek, Amanda Cercas Curry, and Verena Rieser. 2017. Why We Need New Evaluation Metrics for NLG. In Proceedings of the Conference on Empirical Methods in Natural Language Processing, pages 2243–2253, Copenhagen, Denmark.
- Papineni et al. (2002) Kishore Papineni, Salim Roukos, Todd Ward, and Wei-Jing Zhu. 2002. BLEU: a method for automatic evaluation of machine translation. In Proceedings of the Annual Meeting of the ACL, pages 311–318, Philadelphia, PA, USA.
- Park et al. (2017) Kayoung Park, Seunghoon Hong, Mooyeol Baek, and Bohyung Han. 2017. Personalized Image Aesthetic Quality Assessment by Joint Regression and Ranking. In IEEE Winter Conference on Applications of Computer Vision, pages 1206–1214, Santa Rosa, CA, USA.
- Reiter (2018) Ehud Reiter. 2018. A Structured Review of the Validity of BLEU. Computational Linguistics, 44(3):1–8.
- Sakaguchi et al. (2014) Keisuke Sakaguchi, Matt Post, and Benjamin Van Durme. 2014. Efficient elicitation of annotations for human evaluation of machine translation. In Proceedings of the Workshop on Statistical Machine Translation, pages 1–11, Baltimore, MD, USA.
- Sculley (2010) D. Sculley. 2010. Combined regression and ranking. In Proceedings of the International Conference on Knowledge Discovery and Data Mining, pages 979–988, Washington, DC, USA.
- Camargo de Souza et al. (2018) José G. Camargo de Souza, Michael Kozielski, Prashant Mathur, Ernie Chang, Marco Guerini, Matteo Negri, Marco Turchi, and Evgeny Matusov. 2018. Generating E-Commerce Product Titles and Predicting their Quality. In Proceedings of the International Conference on Natural Language Generation, pages 233–243, Tilburg, The Netherlands.
- Specia et al. (2010) Lucia Specia, Dhwaj Raj, and Marco Turchi. 2010. Machine translation evaluation versus quality estimation. Machine Translation, 24(1):39–50.
- Specia et al. (2018) Lucia Specia, Carolina Scarton, and Gustavo Henrique Paetzold. 2018. Quality Estimation for Machine Translation. Number 39 in Synthesis Lectures on Human Language Technologies. Morgan & Claypool.
- Tian et al. (2018) Ye Tian, Ioannis Douratsos, and Isabel Groves. 2018. Treat the system like a human student: Automatic naturalness evaluation of generated text without reference texts. In Proceedings of the International Conference on Natural Language Generation, pages 109–118, Tilburg, The Netherlands.
- Ueffing et al. (2018) Nicola Ueffing, José G. C. de Souza, and Gregor Leusch. 2018. Quality Estimation for Automatically Generated Titles of eCommerce Browse Pages. In Proceedings of the Conference of the North American Chapter of the ACL, pages 52–59, New Orleans, LA, USA.
- Vedantam et al. (2015) Ramakrishna Vedantam, C. Lawrence Zitnick, and Devi Parikh. 2015. CIDEr: Consensus-Based Image Description Evaluation. In Proceedings of the IEEE Conference on Computer Vision and Pattern Recognition, pages 4566–4575, Boston, MA, USA. arXiv:1411.5726.
- Wen et al. (2015) Tsung-Hsien Wen, Milica Gasic, Nikola Mrkšić, Pei-Hao Su, David Vandyke, and Steve Young. 2015. Semantically Conditioned LSTM-based Natural Language Generation for Spoken Dialogue Systems. In Proceedings of the Conference on Empirical Methods in Natural Language Processing, pages 1711–1721, Lisbon, Portugal.
- Williams (1959) Evan James Williams. 1959. Regression analysis. Wiley, New York, NY, USA.
- Wiseman et al. (2017) Sam Wiseman, Stuart M Shieber, and Alexander M Rush. 2017. Challenges in data-to-document generation. In Proceedings of the Conference on Empirical Methods in Natural Language Processing, pages 2243–2253, Copenhagen, Denmark.
Automatic QE for NLG: Ranting (Joint Rating and Ranking) – Supplementary Material
| Attribute | Delexicalisation |
|---|---|
| address | full |
| area | names only (excl. city centre, riverside) |
| customer rating | - |
| food/cuisine | - |
| kids-friendly | - |
| meal type | - |
| nearby venue/monument name | full |
| phone number | full |
| postcode | full |
| price | full |
| price range | - |
| venue count | full |
| venue name | full |
| venue type | - |
| Parameter | Value |
|---|---|
| Embedding/GRU cell width | 50 |
| Dropout keep rate | 0.8 |
| Batch size | 50 |
| Learning rate | 0.0001 |
| Number of fully connected layers | 1 |
| Max. number of epochs | 100 |
| Epochs using synthetic data | 50 |