Size and density sorting of dust grains in SPH simulations of protoplanetary discs II: Fragmentation
Abstract
Grain growth and fragmentation are important processes in building up large dust aggregates in protoplanetary discs. Using a 3D two-phase (gas-dust) SPH code, we investigate the combined effects of growth and fragmentation of a multi-phase dust with different fragmentation thresholds in a time-evolving disc. We find that our fiducial disc, initially in a fragmentation regime, moves toward a pure-growth regime in a few thousands years. Timescales change as a function of the disc and dust properties. When fragmentation is efficient, it produces, in different zones of the disc, Fe/Si and rock/ice ratios different from those predicted when only pure growth is considered. Chemical fractionation and the depletion/enrichment in iron observed in some chondrites can be linked to the size-density sorting and fragmentation properties of precursor dusty grains . We suggest that aggregation of chondritic components could have occurred where/when fragmentation was not efficient if their aerodynamical sorting has to be preserved. Chondritic components would allow aerodynamical sorting in a fragmentation regime only if they have similar fragmentation properties. We find that, in the inner disc, and for the same interval of time, fragmenting dust can grow larger when compared to the size of grains predicted by pure growth. This counter-intuitive behaviour is due to the large amount of dust which piles up in a fragmenting zone followed by the rapid growth that occurs when this zone transitions to a pure growth regime. As an important consequence, dust can overcome the radial-drift barrier within a few thousands years.
keywords:
protoplanetary discs — SPH –chondrites1 Introduction
In protoplanetary discs, collisions among dust grains can lead to sticking and, thus, to the formation of larger aggregates. However, if the relative velocity between colliding particles becomes greater than a critical velocity, a collision would likely result in fragmentation (Blum & Wurm, 2008).
Dust growth and fragmentation are competitive and complex processes. They are regulated by the interactions between dust grains under the effect of the gas drag in discs, as well as e.g. by thermal processes like sublimation and condensation. The dust-gas interactions have been investigated in great detail in numerous studies such as Weidenschilling (1977); Dullemond & Dominik (2004); Barrière-Fouchet et al. (2005); Cuzzi & Weidenschilling (2006); Laibe & Price (2012); Laibe et al. (2012); Booth et al. (2015).
Several theoretical studies focused on the effects of grain growth and fragmentation in determining the dust behaviour and its distribution in protoplanetary discs (Dullemond & Dominik, 2005; Laibe et al., 2008; Brauer et al., 2008a; Dominik & Dullemond, 2008; Laibe et al., 2014a; Laibe et al., 2014b; Gonzalez et al., 2015a). On the other hand, there are several experimental and numerical studies which aimed at understanding the different physical properties and thresholds of fragmentation between dust grains and between dust aggregates (Blum & Wurm, 2008; Wada et al., 2009; Teiser & Wurm, 2009; Zsom et al., 2010; Wada et al., 2013; Meru et al., 2013; Yamamoto et al., 2014). There are several factors that determine the critical velocity of a dust grain/aggregate such as its chemical composition, porosity and size (Blum & Wurm, 2008). However, to date, there is no unified theoretical framework which can be used to extrapolate unknown fragmentation properties of aggregates of different size and species. Nevertheless, there is a large spread of values for fragmentation thresholds for different types of dusty grains that range from 1 to 50 (Blum & Wurm, 2008; Wada et al., 2009; Teiser & Wurm, 2009; Zsom et al., 2010; Wada et al., 2013; Meru et al., 2013; Yamamoto et al., 2014; Deckers & Teiser, 2016).
Fragmentation can constitute a crucial problem in the framework of planet formation. The so-called radial-drift barrier describes the process for which grains cannot grow large enough to decouple from the gas before the gas drag-induced drifts makes them fall onto the central star (Weidenschilling, 1977). Fragmentation may thus damp the growth, preventing grains from becoming large enough to overcome the radial drift barrier (Brauer et al., 2008a; Johansen et al., 2008) making the process of planet formation inefficient. However, more recent studies have shown that, even in high fragmentation regimes, dust particles can pile up, grow and decouple from the gas (Gonzalez et al., 2015b; Gonzalez et al., 2017a, b). This is due to the key role of the dust back-reaction (i.e. the drag of dust on gas) and its role in the formation of self-induced dust trap. Other proposed mechanisms to solve the radial-drift barrier include photophoresis (Wurm et al., 2010; Wurm et al., 2013; Cuello et al., 2016), dead zones (Kretke & Lin, 2007; Armitage, 2011), embedded protoplanets and particle traps (Paardekooper & Mellema, 2004; Fouchet et al., 2007, 2010; Pinilla et al., 2012; Gonzalez et al., 2012, 2015a), evaporation fronts (Brauer et al., 2008b), streaming instability (Johansen et al., 2007), high dust to gas ratios (Laibe, 2014), radial mixing (Keller & Gail, 2004), meridional circulation (Fromang et al., 2011), radiation pressure (Vinković, 2014), or grain porosity (Kataoka et al., 2013).
In Pignatale et al. (2017), hereafter Paper I, we studied the size-density sorting of the multi-phase dust component of a protoplanetary disc in a pure-growth regime. We found that i) dust grains can be efficiently size-density sorted111Two co-located grains and with size , and density , are size-density sorted if they have the same aerodynamic parameter (), i.e. ., and ii) changes in the chemical composition in different disc zones can be driven by the combined effects of intrinsic density and size of the dust grains on their dynamics. We also found that the properties of the dust aggregates were in good agreement with the physical properties of chondrites (chemically fractionated with their components size-density sorted) (Scott & Krot, 2003). In fact, since the interactions between dust and gas are driven by the aerodynamic parameter, , of the dust grains (Cuzzi & Weidenschilling, 2006), the dust motions (vertical settling and radial drift) in discs act as sorting mechanisms. Sorting is considered an efficient process to fractionate the dust (Benoit et al., 1998; Kuebler et al., 1999; Liffman, 2005; Jacquet et al., 2012) and also the gas from the solar composition, if total or partial separation between the two phases occurs (Pignatale et al., 2016).
In Paper I we focused our attention on a large T-Tauri disc () where the disc structure does not result in high relative velocities between dust particles. In that case, a pure-growth regime is a very good approximation to describe the process of grain growth. This work is the direct follow-up of Paper I. Here we focus on the effect of fragmentation in determining the dust content and properties in the inner region of discs. This study is driven by the fact that, in these zones, the relative velocities between particles could easily reach high values (see equation 3) and, thus, lead to an efficient dust fragmentation. Moreover, we extend the conclusions derived in Paper I, and investigate if and how fragmentation can change the size, the chemical distribution and the aerodynamic sorting of dust grains.
The structure of the paper is as follows: in Section 2 we describe the code we use for our simulations, introduce the disc model, the chemical characterization of the dust and its growth and fragmentation properties. In Section 3 we present the results produced by our simulations comparing pure growth and fragmentation, and in Section 4 we detail the resulting changes in the chemical disc composition, and the properties of the dust grains and aggregates. We draw our conclusion in Section 5.
2 Methods
We compute the vertical settling, radial drift, growth and fragmentation of a multi-phase dust using our 3D two-phase (gas + dust) Smoothed Particle Hydrodynamic (SPH) code. The code with all the cited implementations has been described, tested and discussed in detail in Barrière-Fouchet et al. (2005) where the two-phase (gas and dust, including the dust back-reaction on the gas) code was first presented, Laibe et al. (2008) where dust growth was included, Gonzalez et al. (2015a), where fragmentation was implemented, Paper I where a chemical characterisation of grains was added, and Gonzalez et al. (2017a) where further studies of dust growth and fragmentation were performed. Arena & Gonzalez (2013) have shown that the SPH formalism naturally reproduces the expected properties of Prandtl-like turbulence. The code uses the standard SPH artificial viscosity (Monaghan, 1989), and in this paper we set and , emulating a uniform Shakura & Sunyaev (1973) turbulence parameter (see Fouchet et al., 2007, for a discussion). No further modifications on the code are made in this paper.
2.1 Disc Model
We take into consideration an inner slice () of a typical T-Tauri disc with and a radial extension of , orbiting a star of mass , for which we recalculate, using power-law parametrizations (Barrière-Fouchet et al., 2005), all the necessary quantities for the selected region. Our reference radius is au, where the temperature is set at K (D’Alessio et al., 1998, 1999). The parametrization for the temperature and surface density follows the same power laws as Paper I (, ), the disc is vertically isothermal, the vertical scale height is (Barrière-Fouchet et al., 2005; Laibe et al., 2008, Paper I). At the reference radius, kg with a disc total mass of within the 0.5-50 au radial range. The disc is composed of 99 gas and 1 dust by mass. The disc is flared and at . The choice of au as the inner limit is made because this is the location of the water snowline where K and pascal (Lewis, 1974). This will allow us to ignore the effects of the evaporation of ice on the disc and on the dust chemistry.
2.2 Grain species, growth and fragmentation
We report in Table 1 our fiducial dust compositions with the relative intrinsic densities, . Abundances are adapted from Lodders (2003).
| Symbol | Dust species | Nominal Abundance | Real abundances | |||
| () | () | (particles number) | ||||
| Fe | wustite | 5.74 | 35 | 6.25 | 7365 | |
| sulfides | 4.55 | 42 | 6.25 | 7593 | ||
| Si | silicates | 3.2 | 36 | 20.4 | 24971 | |
| ice | ice | 1 | 56 | 67.1 | 85071 | |
| npdust | 125000 | |||||
| Fe/Si | 0.61 | 0.599 | ||||
| rock/ | 0.49 | 0.469 |
Grain growth has been implemented in our SPH code in Laibe et al. (2008) where they followed the prescription derived by Stepinski & Valageas (1997). The resulting growth profiles has been extensively discussed in previous work (Stepinski & Valageas, 1997; Laibe et al., 2008; Gonzalez et al., 2015a; Gonzalez et al., 2017a, Paper I). To summarize, grain dynamics is regulated by the dust stopping time, ,
| (1) |
where is the sound speed, is the gas density, and are respectively the intrinsic density and size of the dust particle, and is the aerodynamic parameter. Moreover, growth is also a function of the relative velocities between particles, , and of the dust total density (Stepinski & Valageas, 1997; Laibe et al., 2008; Gonzalez et al., 2017a). Fragmentation has been implemented in our code and discussed in Gonzalez et al. (2015a); Gonzalez et al. (2017a). They defined a threshold velocity, , which is compared to . If grains grow, while if , grains fragment with fragmentation modelled as a negative growth. depends on the Stokes number
| (2) |
where is the Keplerian frequency, as
| (3) |
(see Gonzalez et al., 2017a). It is thus possible to study the evolution of as a function of the particle size, as the Stokes number is proportional to and thus (when is fixed) to the particle size.
As pointed out in Section 1, to date, there is no theoretical derivation which can summarize all the aspects involved in dust fragmentation. As such, in order to find characteristic values for for the chosen species, we follow the approach of Yamamoto et al. (2014). For the sake of simplicity we assume compact spherical grains for which the fragmentation velocity is a function only of the chemical composition and it does not depend on the grain size and shape. This approach has already been discussed and justified in Gonzalez et al. (2015a) and Paper I. Yamamoto et al. (2014) define using the following expression:
| (4) |
where is a numerical factor set at 15 for collision between particles with the same mass and size. This is our case, since in our SPH code, collisions occur between particles with the same physical properties. is the energy which is needed to separate two grains which are in contact at equilibrium, and is the mass of the grain. is defined as
| (5) |
where is the size of the grain, the Young modulus, is the Poisson’s ratio, and the surface energy which is defined as
| (6) |
where is the melting temperature. In case the value of the Young modulus for a given species is unknown, the value of can be determined by
| (7) |
where is the bulk modulus and the shear modulus (Yamamoto et al., 2014).
For silicates and ice we take the velocity of fragmentation derived by Yamamoto et al. (2014), respectively 36 and 56 . For FeO (wustite) we take the values of the Young modulus ( GPa) and Poisson ratio () from Krzyzanowski et al. (2010), while the melting temperature ( K) is taken from Patnaik (2003). These values return a of 35 . To represent sulfides we choose pyrrhotite (Fe(1-x)S), with ) for which values of the bulk modulus ( GPa), shear modulus ( GPa) and Poisson ratio () are available in Mavko et al. (2009). The melting temperature ( K) is taken from Rolls & De Bruin (1972). These values allow to calculate the Young modulus and then which equals 42 . A summary of the values is reported in Table 1. In Section 4.6 we will discuss the limitations of these determinations.
2.3 Simulations
We run two simulations each with 250,000 SPH particles, for a total time of yr. The first simulation is characterized by pure-growth (G), while in the second simulation we allow grains to grow and fragment (GF). The gas disc (125,000 SPH particles) is relaxed for yr, that is times the keplerian timescales at the reference radius, 1 au. Similarly to Paper I the dust particles are then injected on top of the gas particles (Barrière-Fouchet et al., 2005). Particle intrinsic density is assigned following the abundances reported in Table 1 which also shows the effective particle distribution between species.
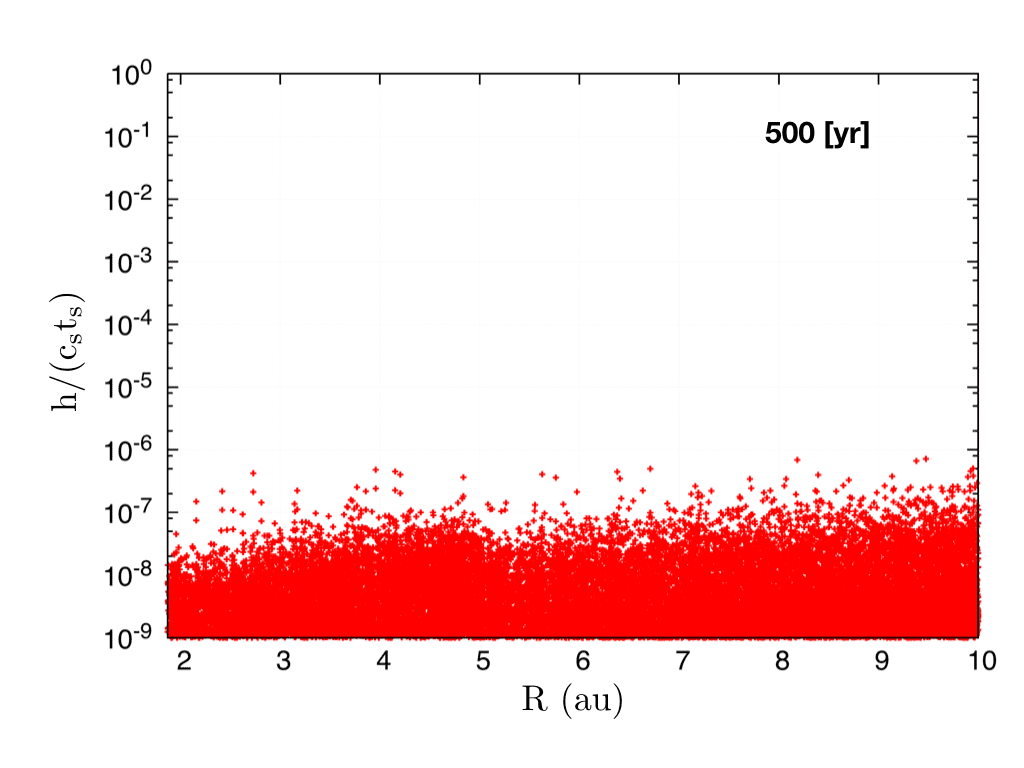
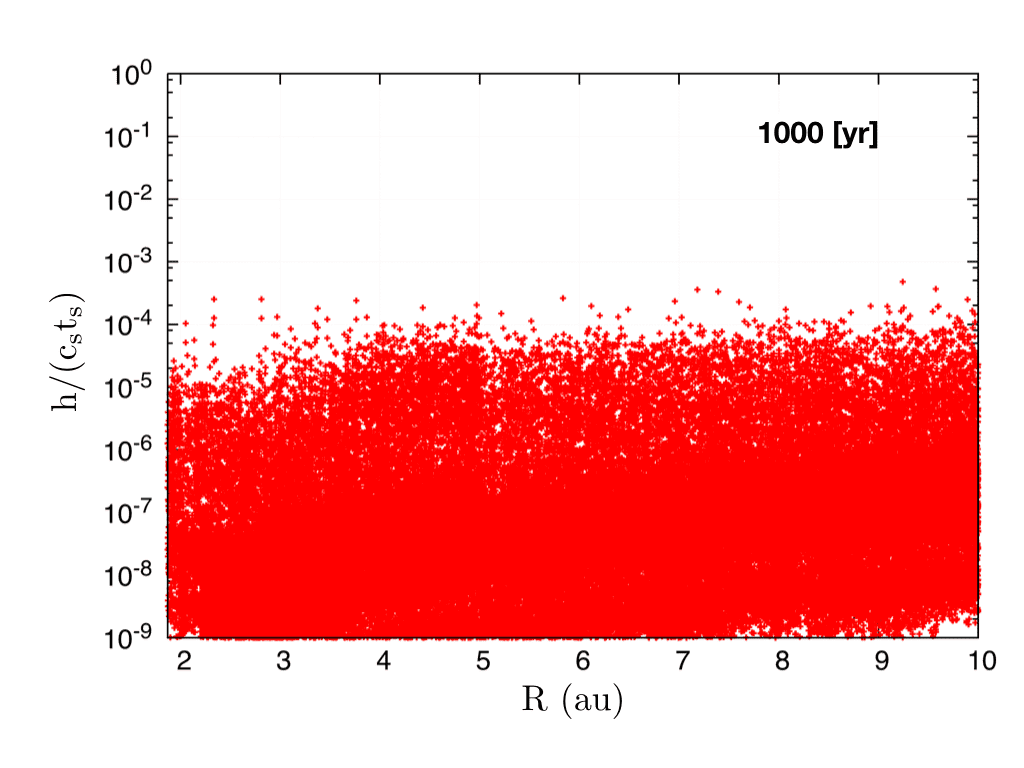
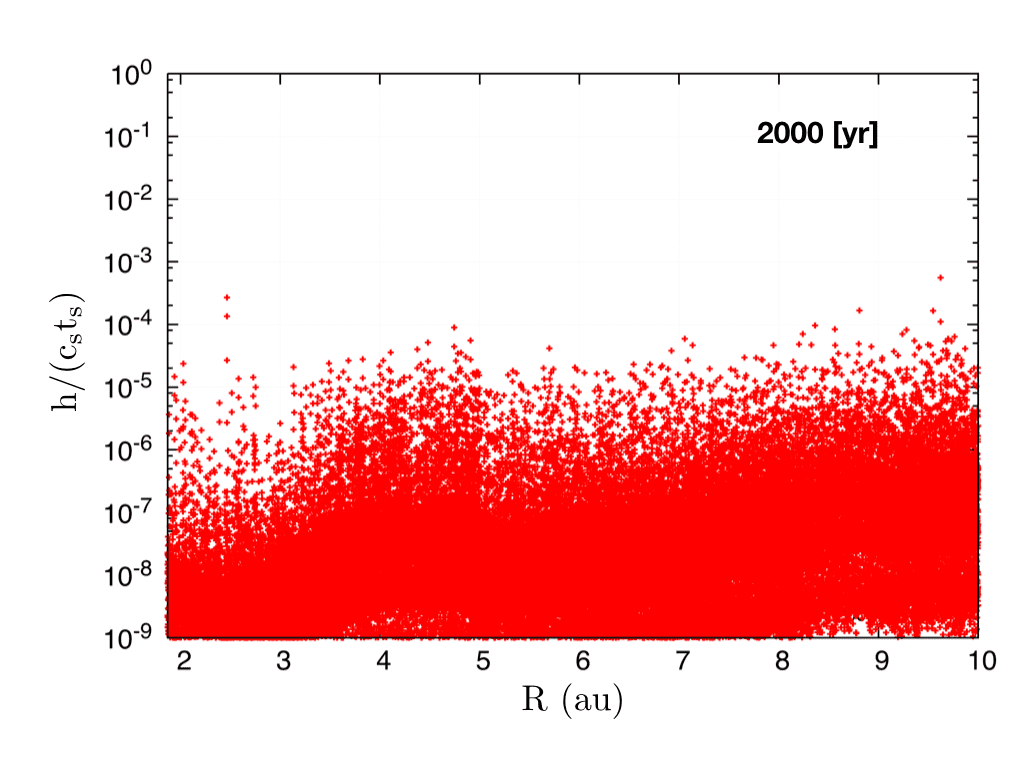
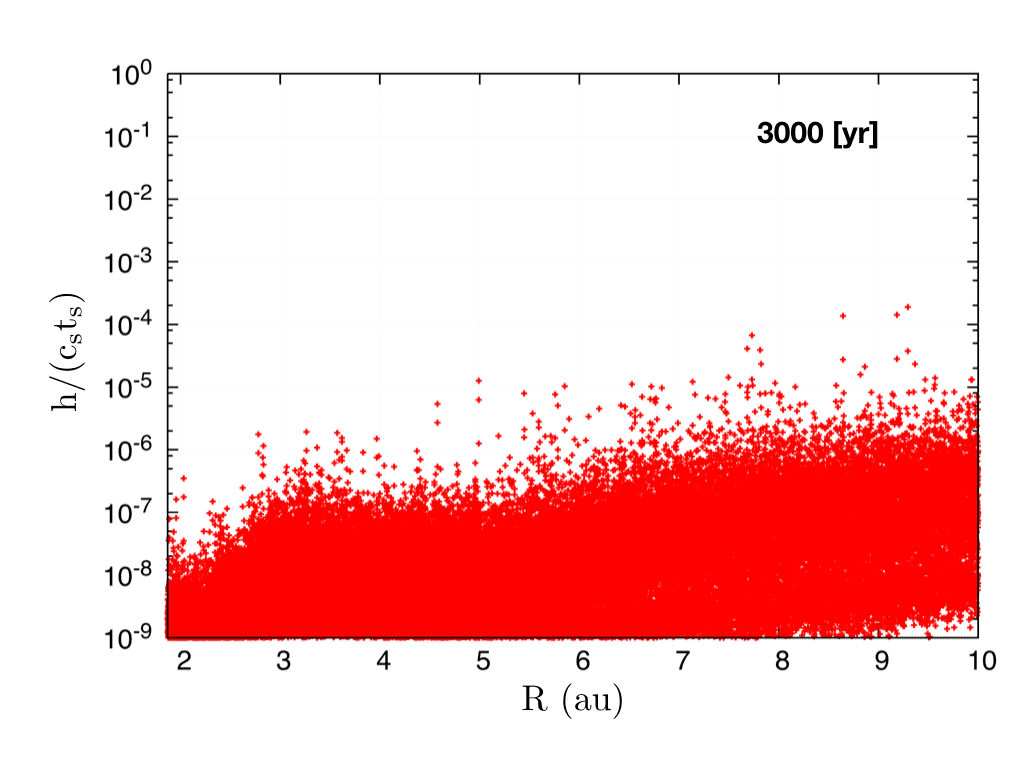
In Appendix A, we test our results against higher resolution (400,000 SPH particles) simulations and also verify the solution criterion , where is the smoothing length, proposed by Laibe & Price (2012). We demonstrate that resolution does not affect the results and that the resolution criterion is satisfied for 250,000 particles.
3 Results
3.1 Global evolution
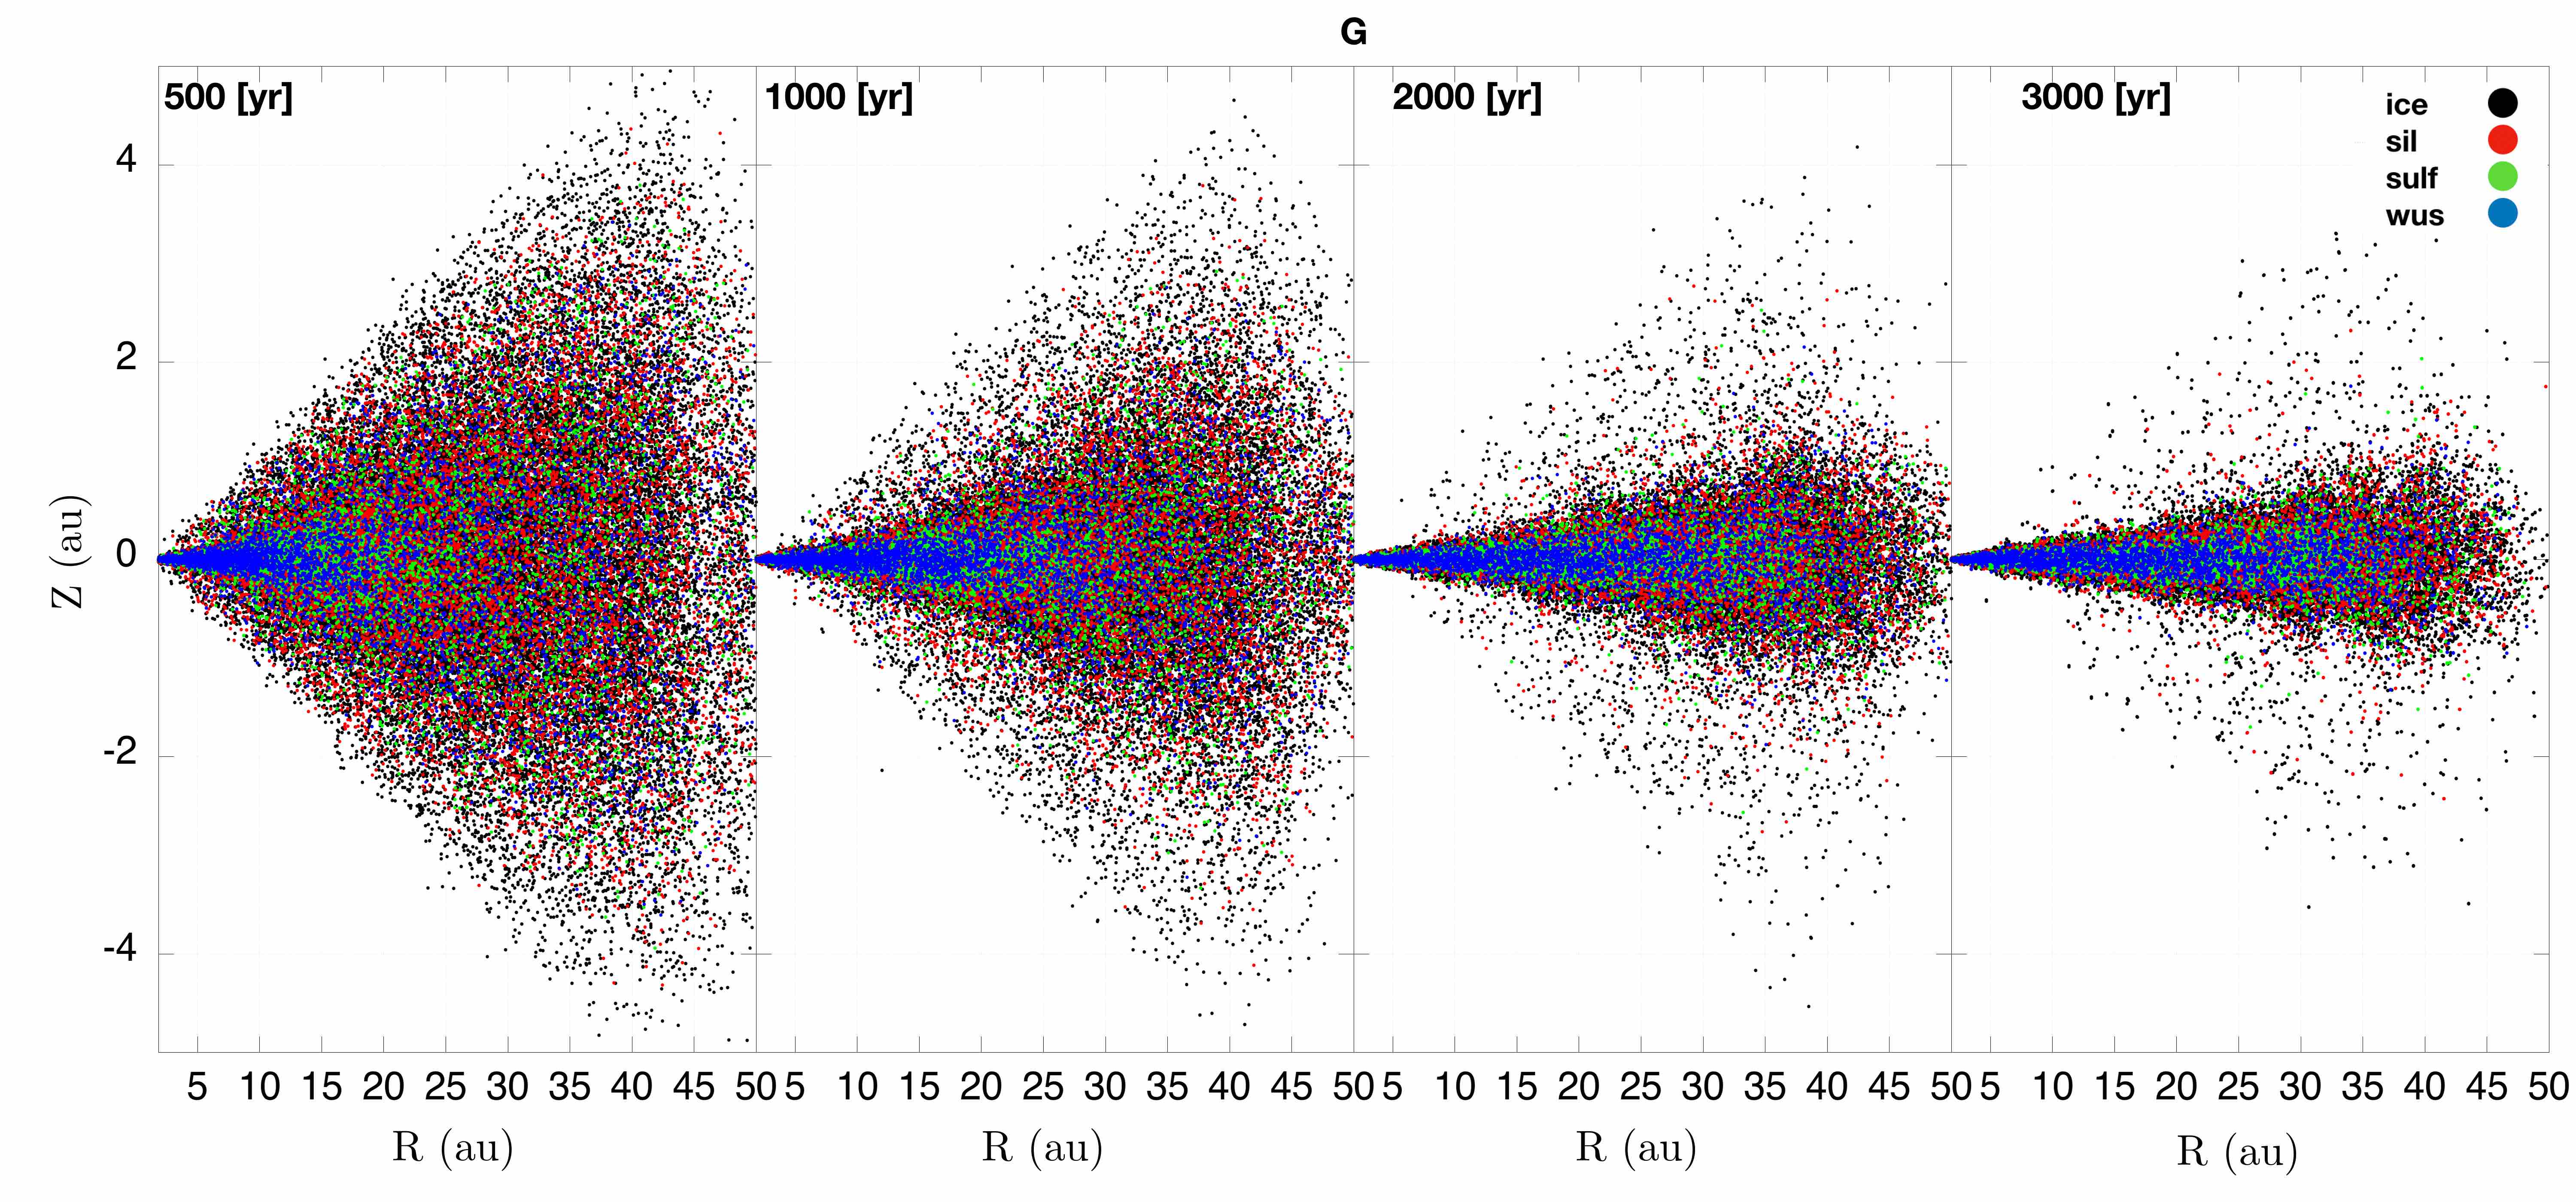
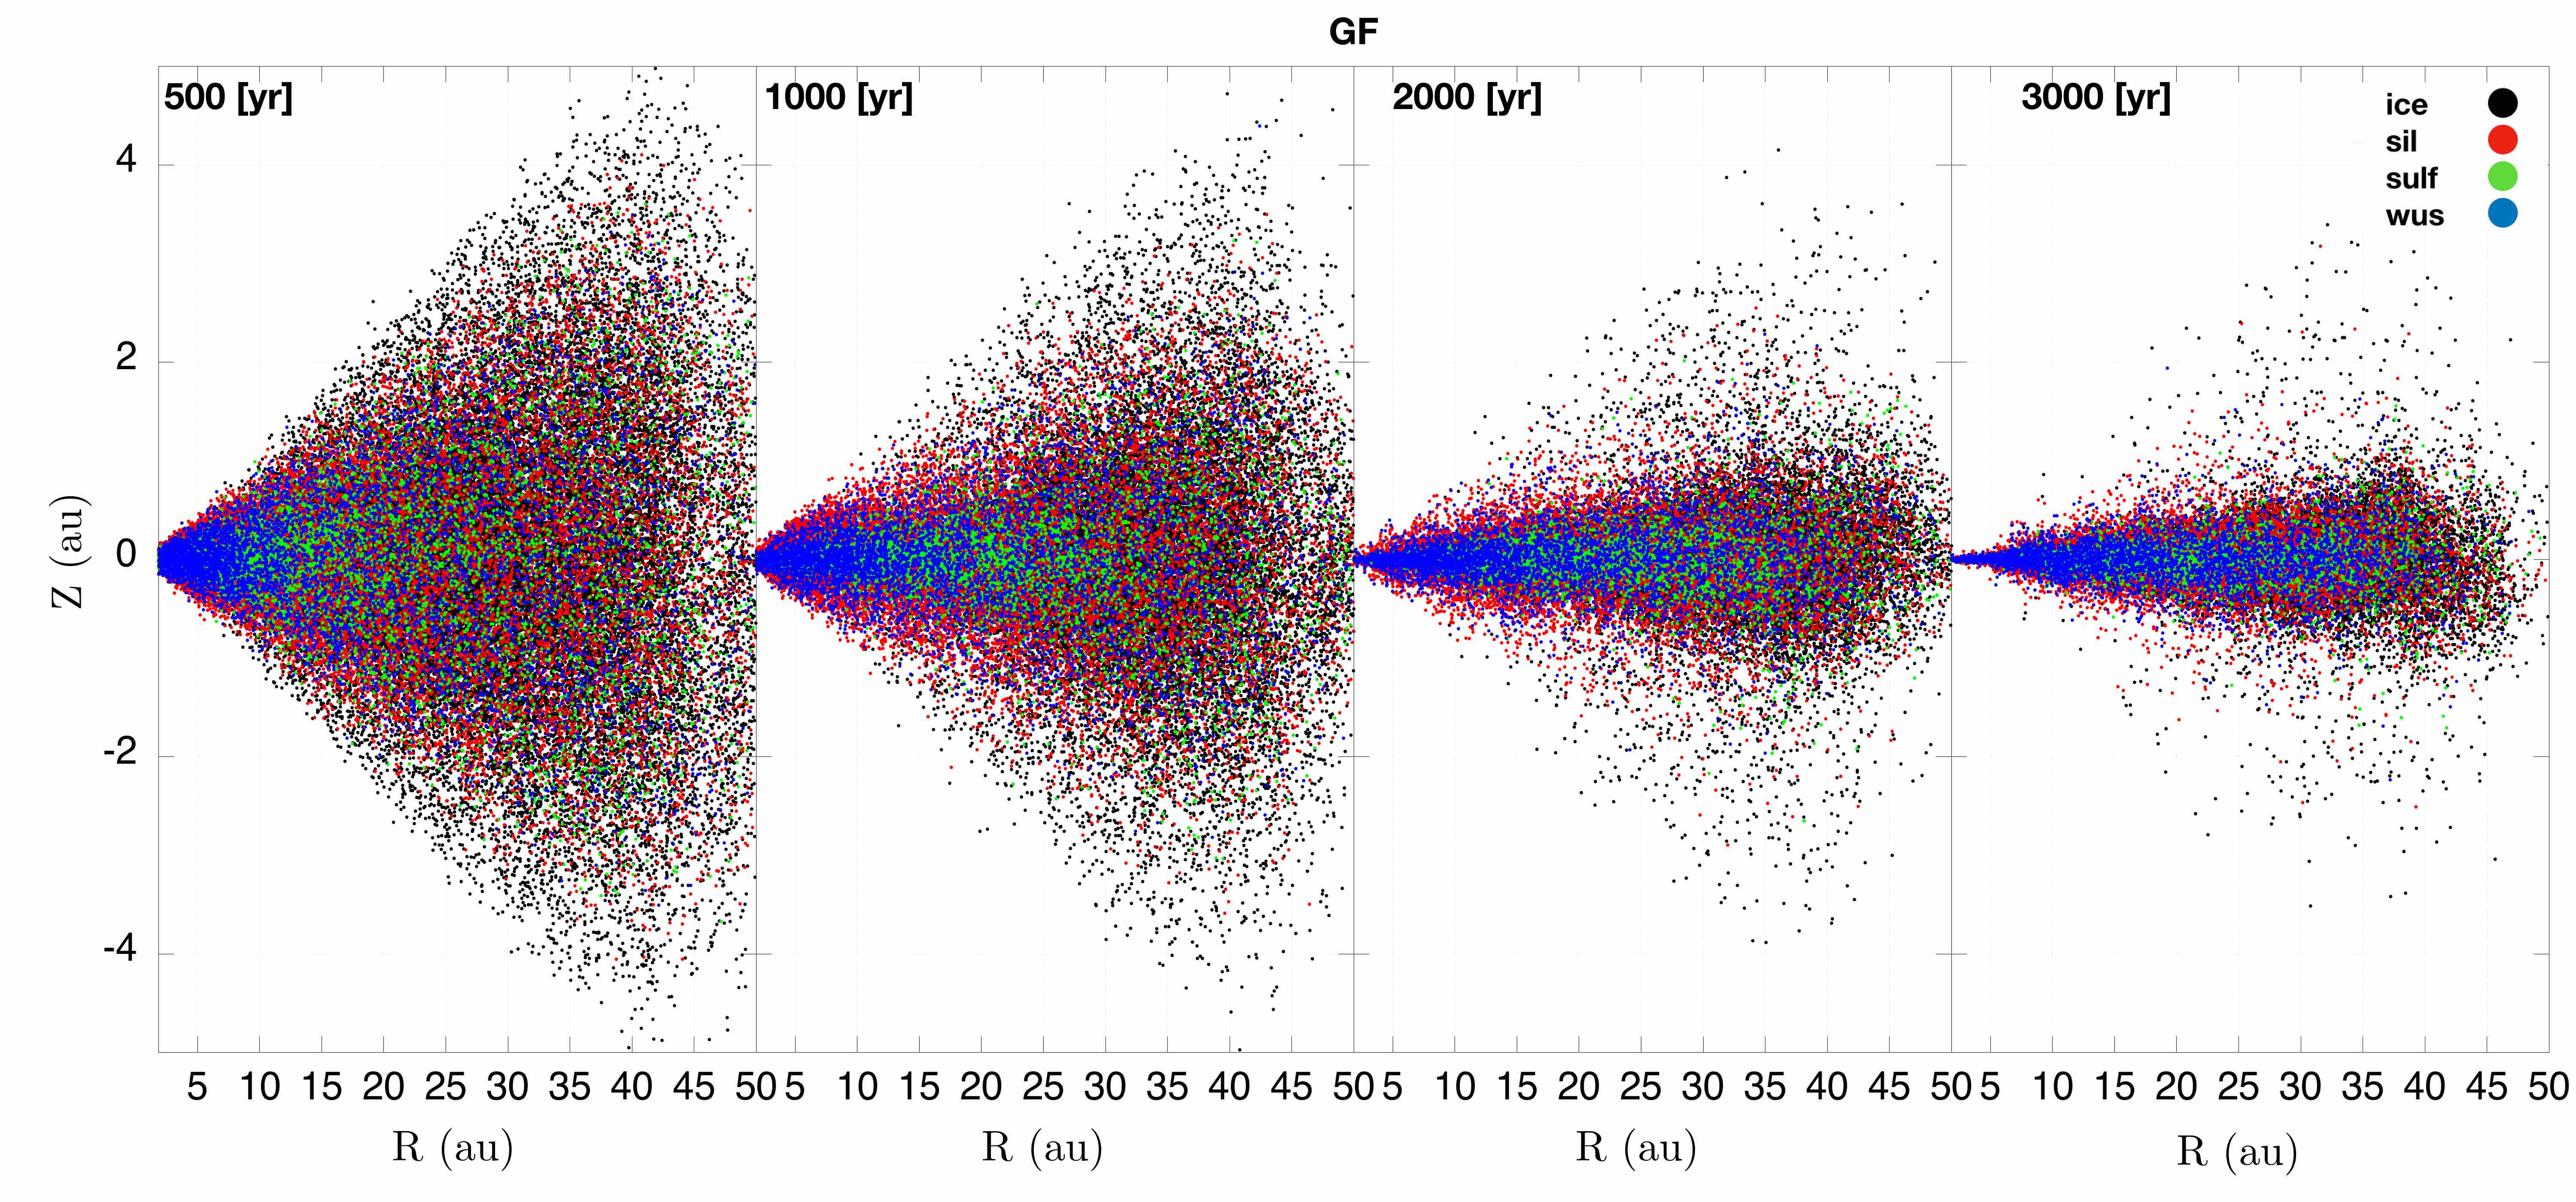
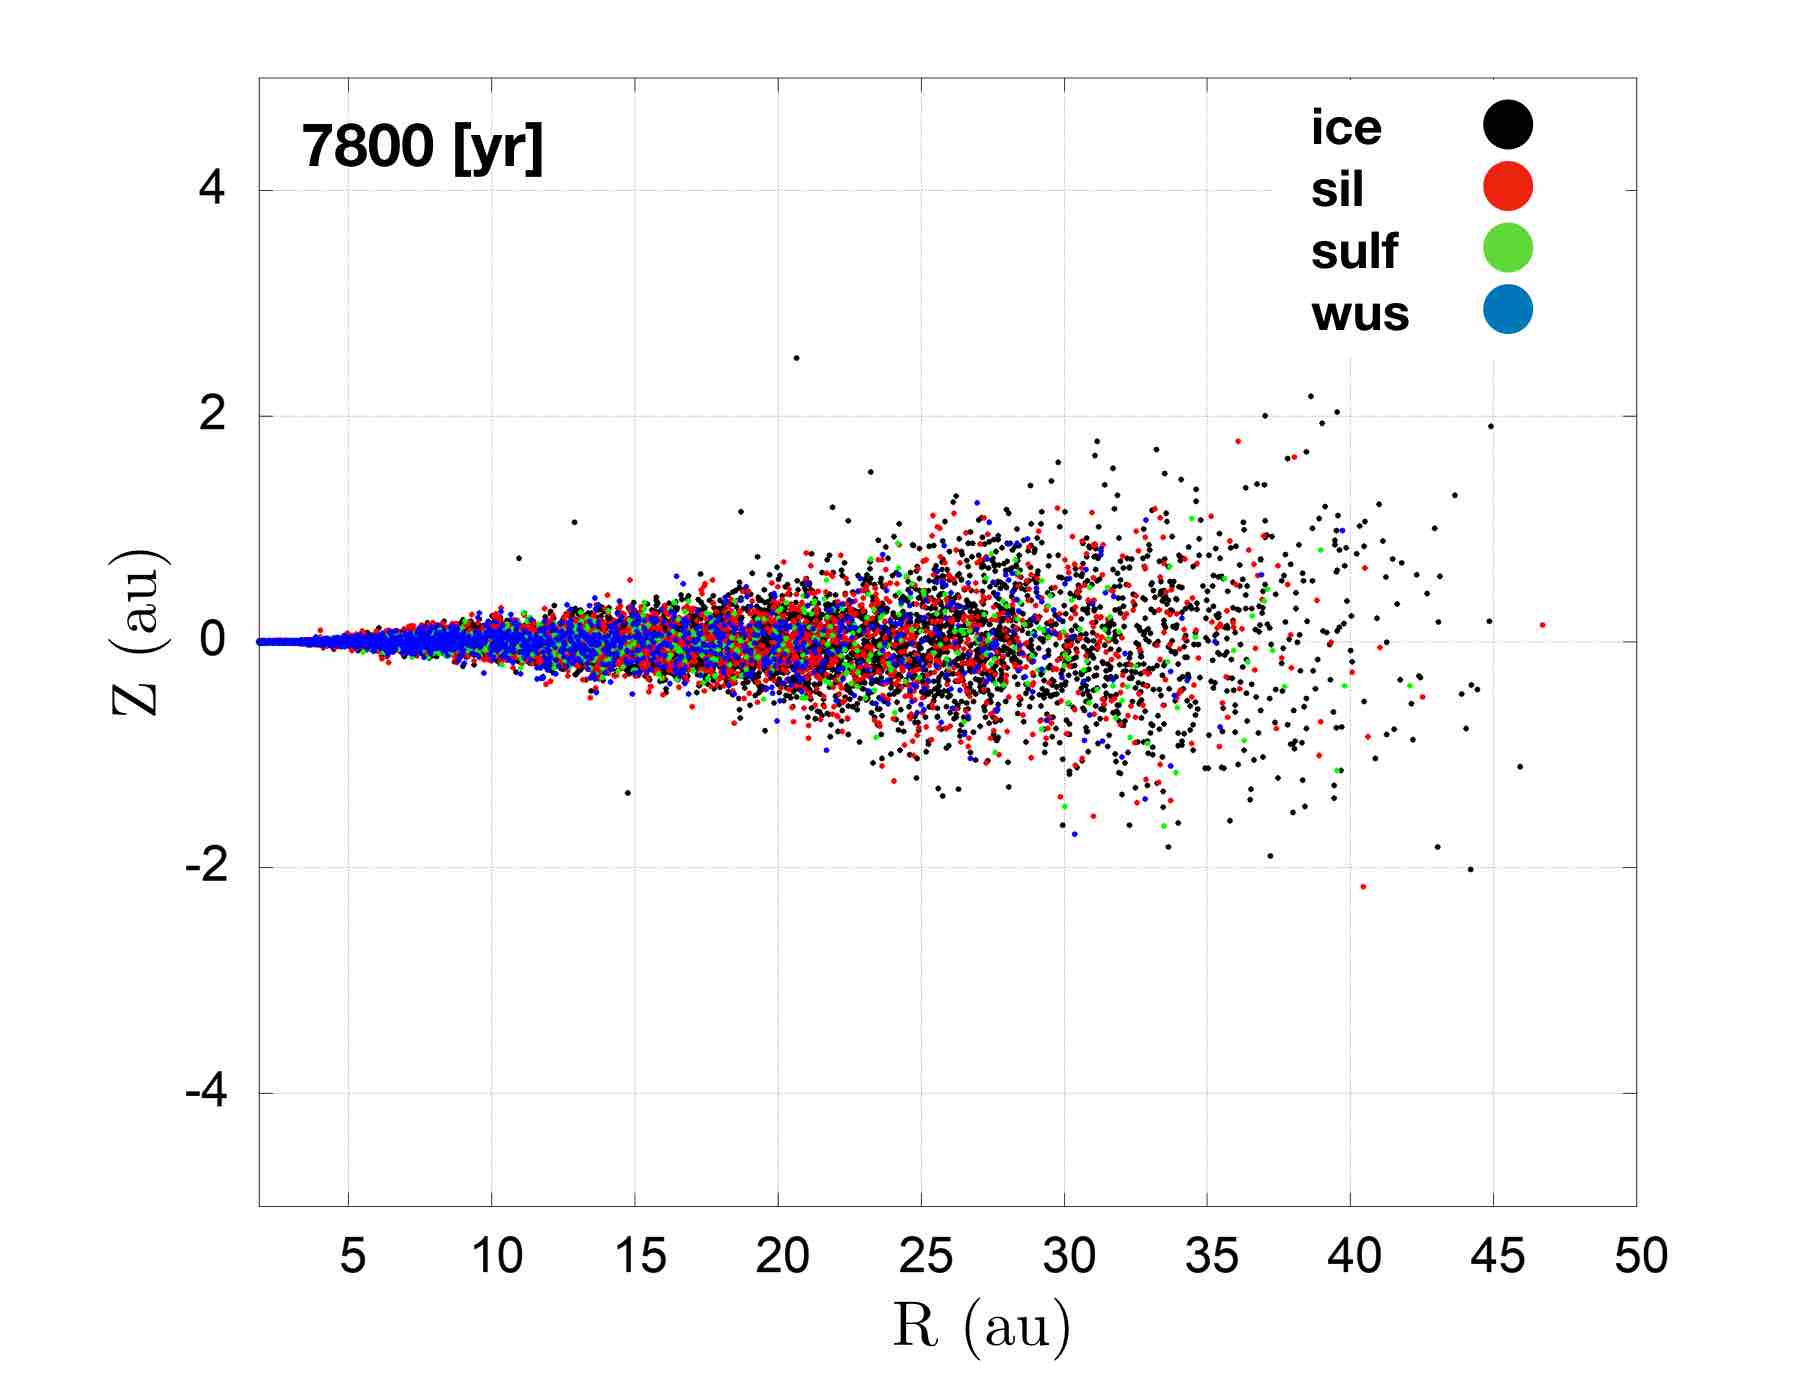
Figure 1 shows the dust distribution in the disc, in the plane, at four evolutionary times, 500, 1000, 2000, 3000 yr, for G (left box) and the GF (right box) simulations. Different colors represent different chemical species. Chemical species are superimposed (wustite on top of sulfides on top of silicates on top of ice) for ease of visualization. In the G case we find a behaviour similar to Paper I: (i) when grains are small, the rate at which particles vertically settle is regulated by their intrinsic densities with heavier grains experiencing a faster settling compared to the lighter grains; (ii) at later stages, the evolving size takes over in dictating the dust dynamics, but (iii) particles with different densities still have different radial drift timescales.
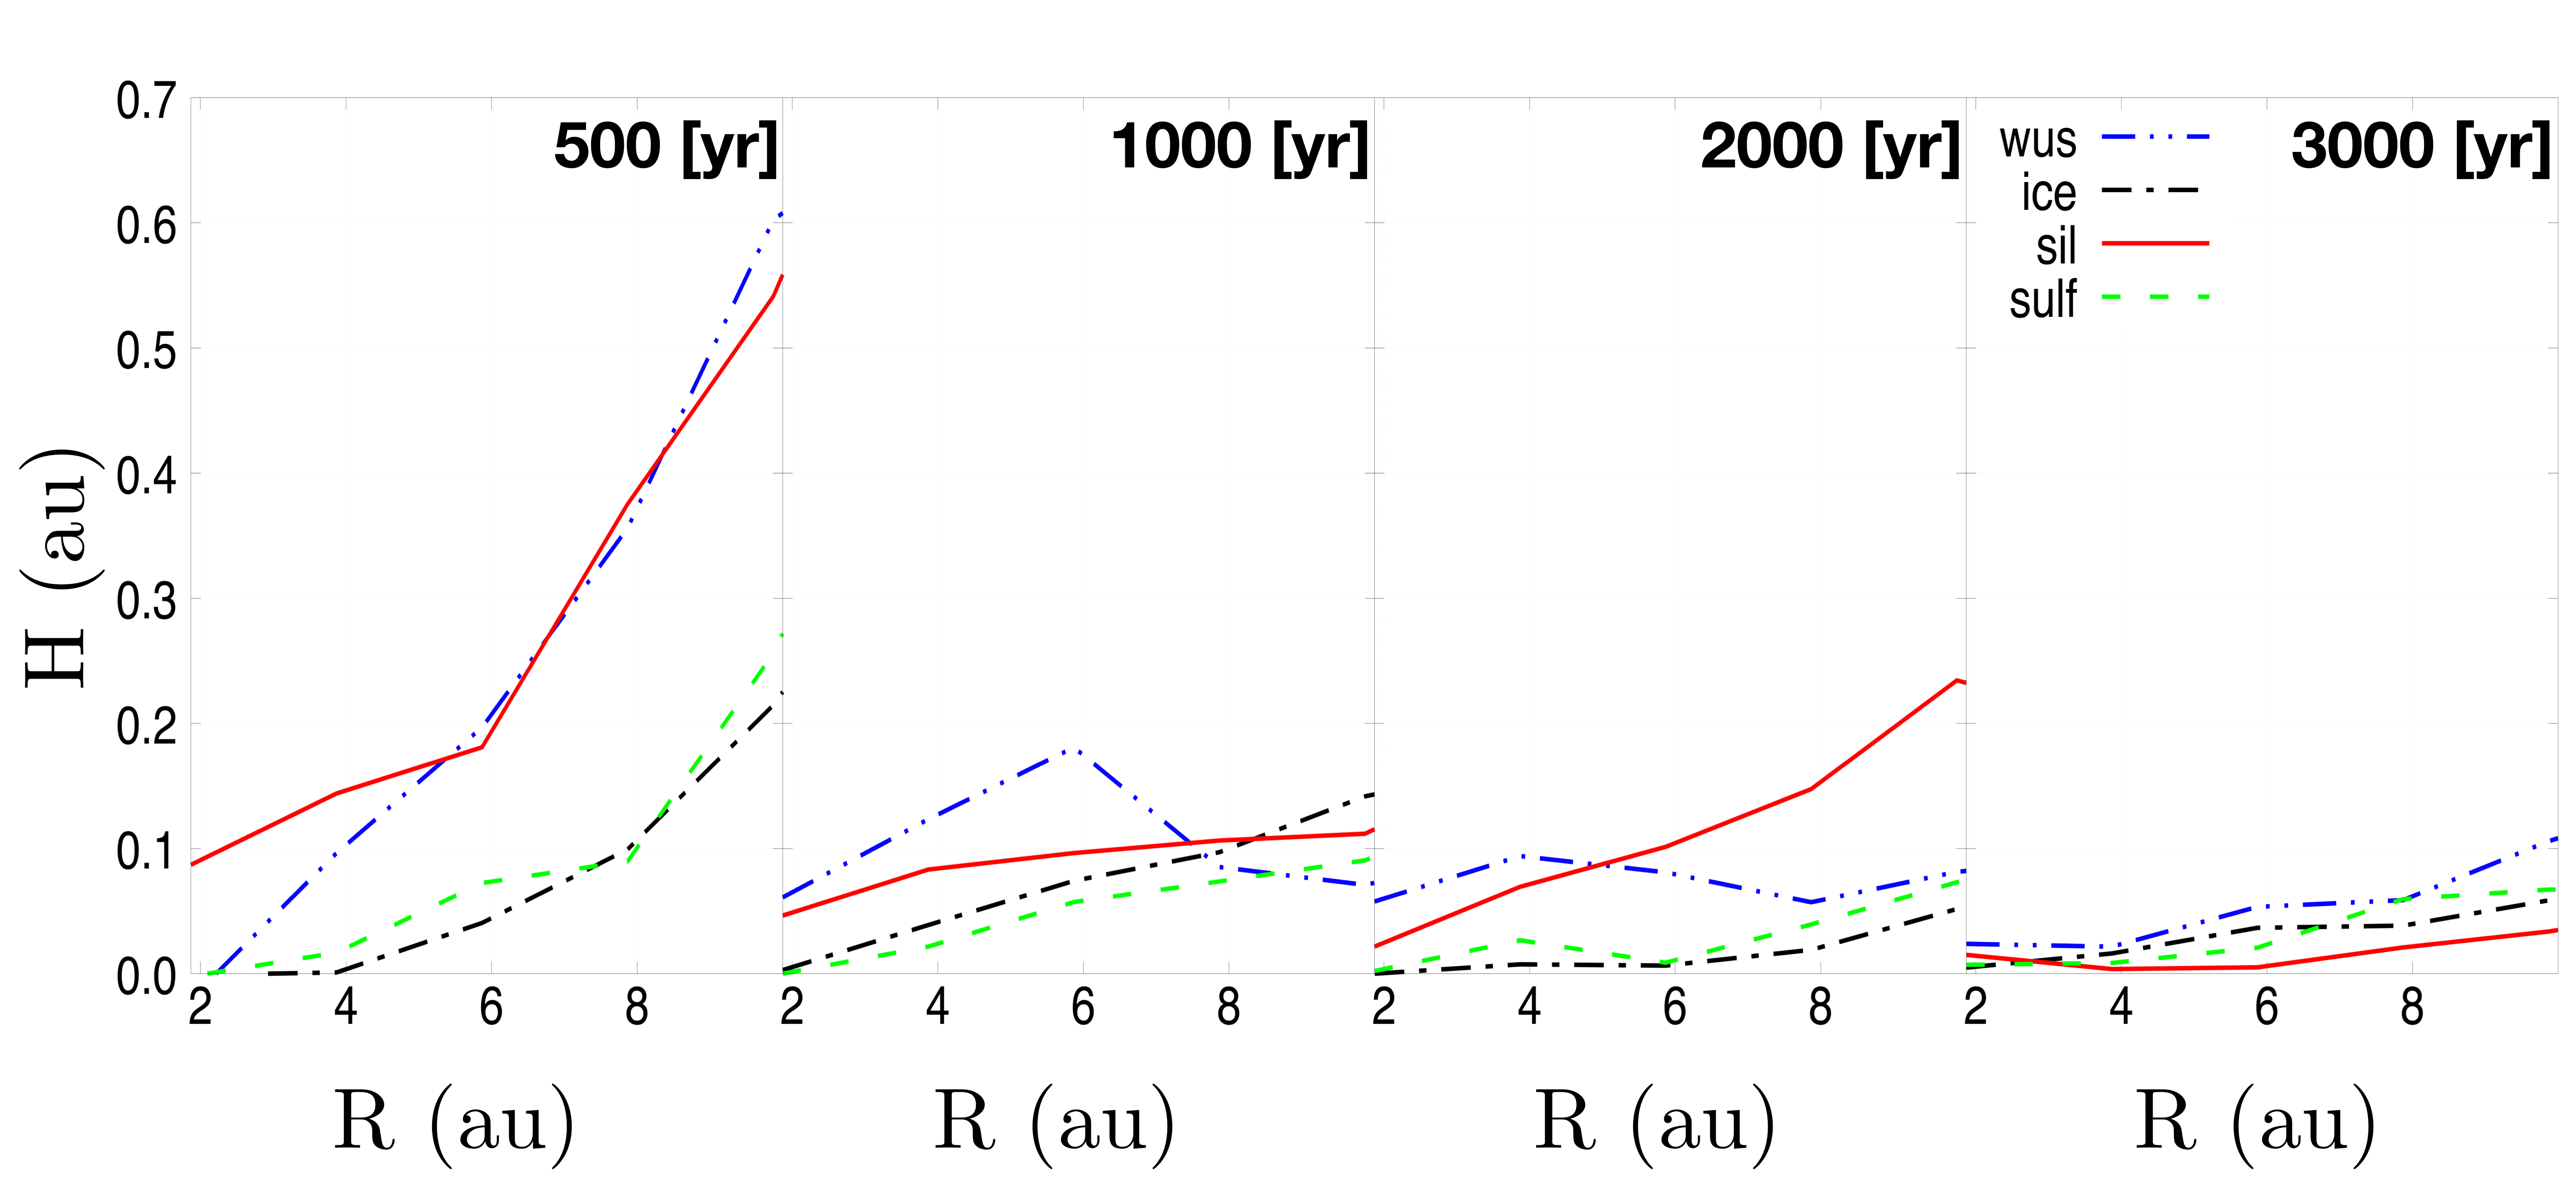
In the GF case the behaviour is different. In the inner part of the disc where , ice particles settle quicker than other heavier particles. For ease of viewing, we show in Fig. 2 the scale height of the different species in the inner 10 au. The disc surface becomes ice-poor. This is the opposite of what we find in the G case, where the disc surface appears ice-enriched until later stages. This is due to the inefficient settling of wustite and silicates in the GF case because fragmentation keeps these grains from growing larger/settling faster. The outer part of the disc, au, shows a trend which is similar in both cases: a layered structure, already found in Paper I, with iron-enriched midplane and ice-enriched surface.

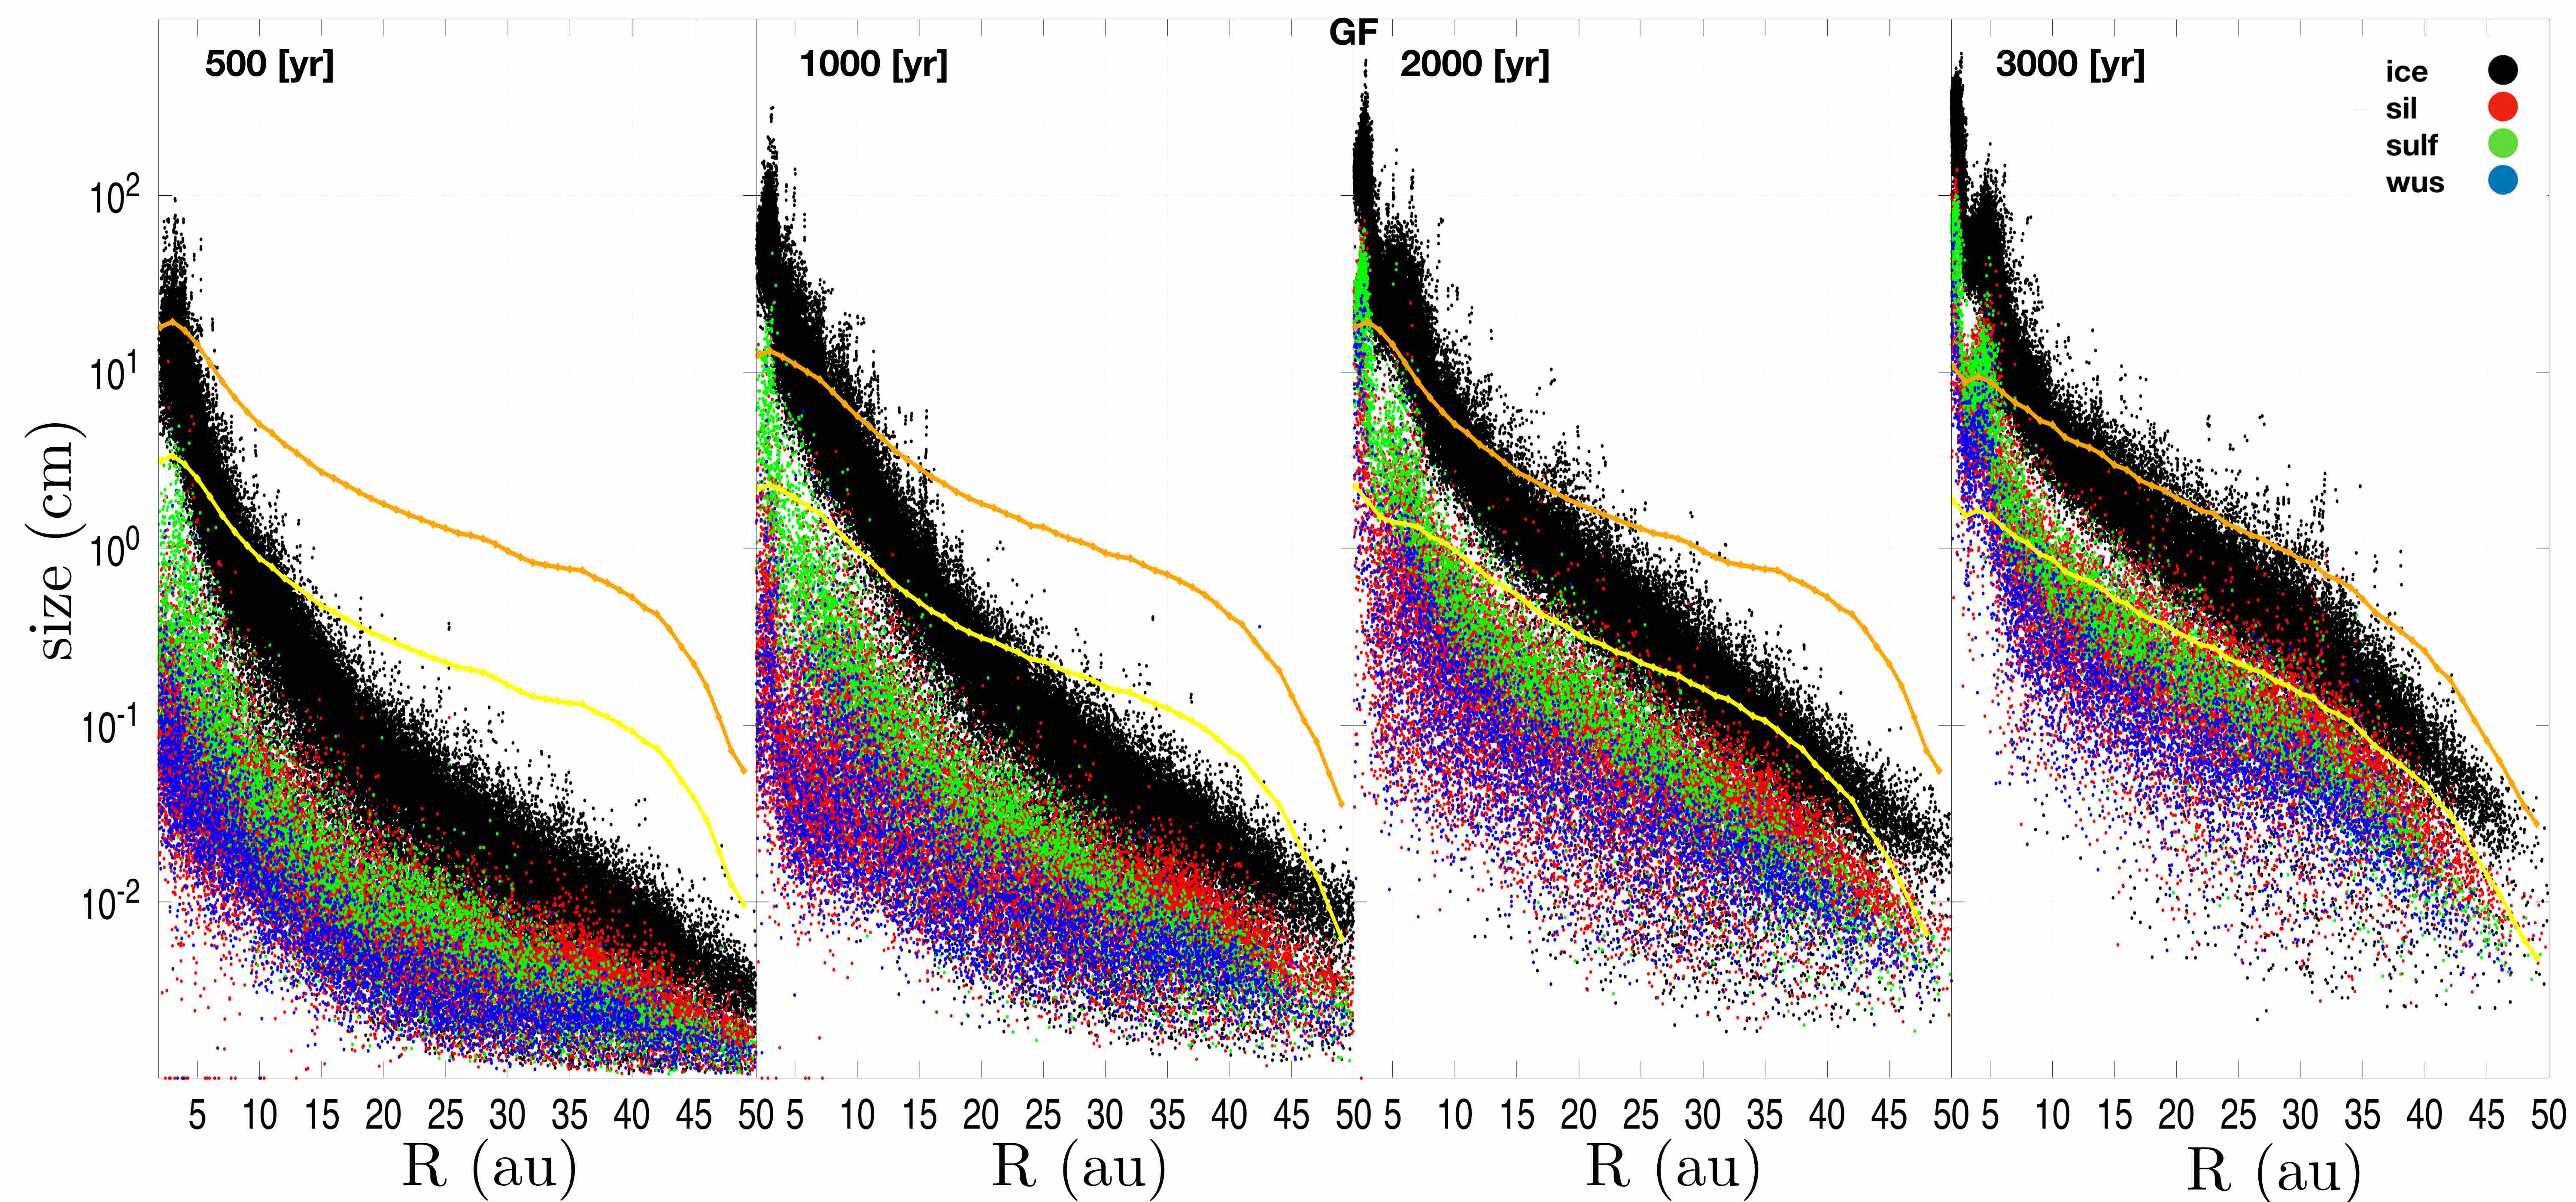
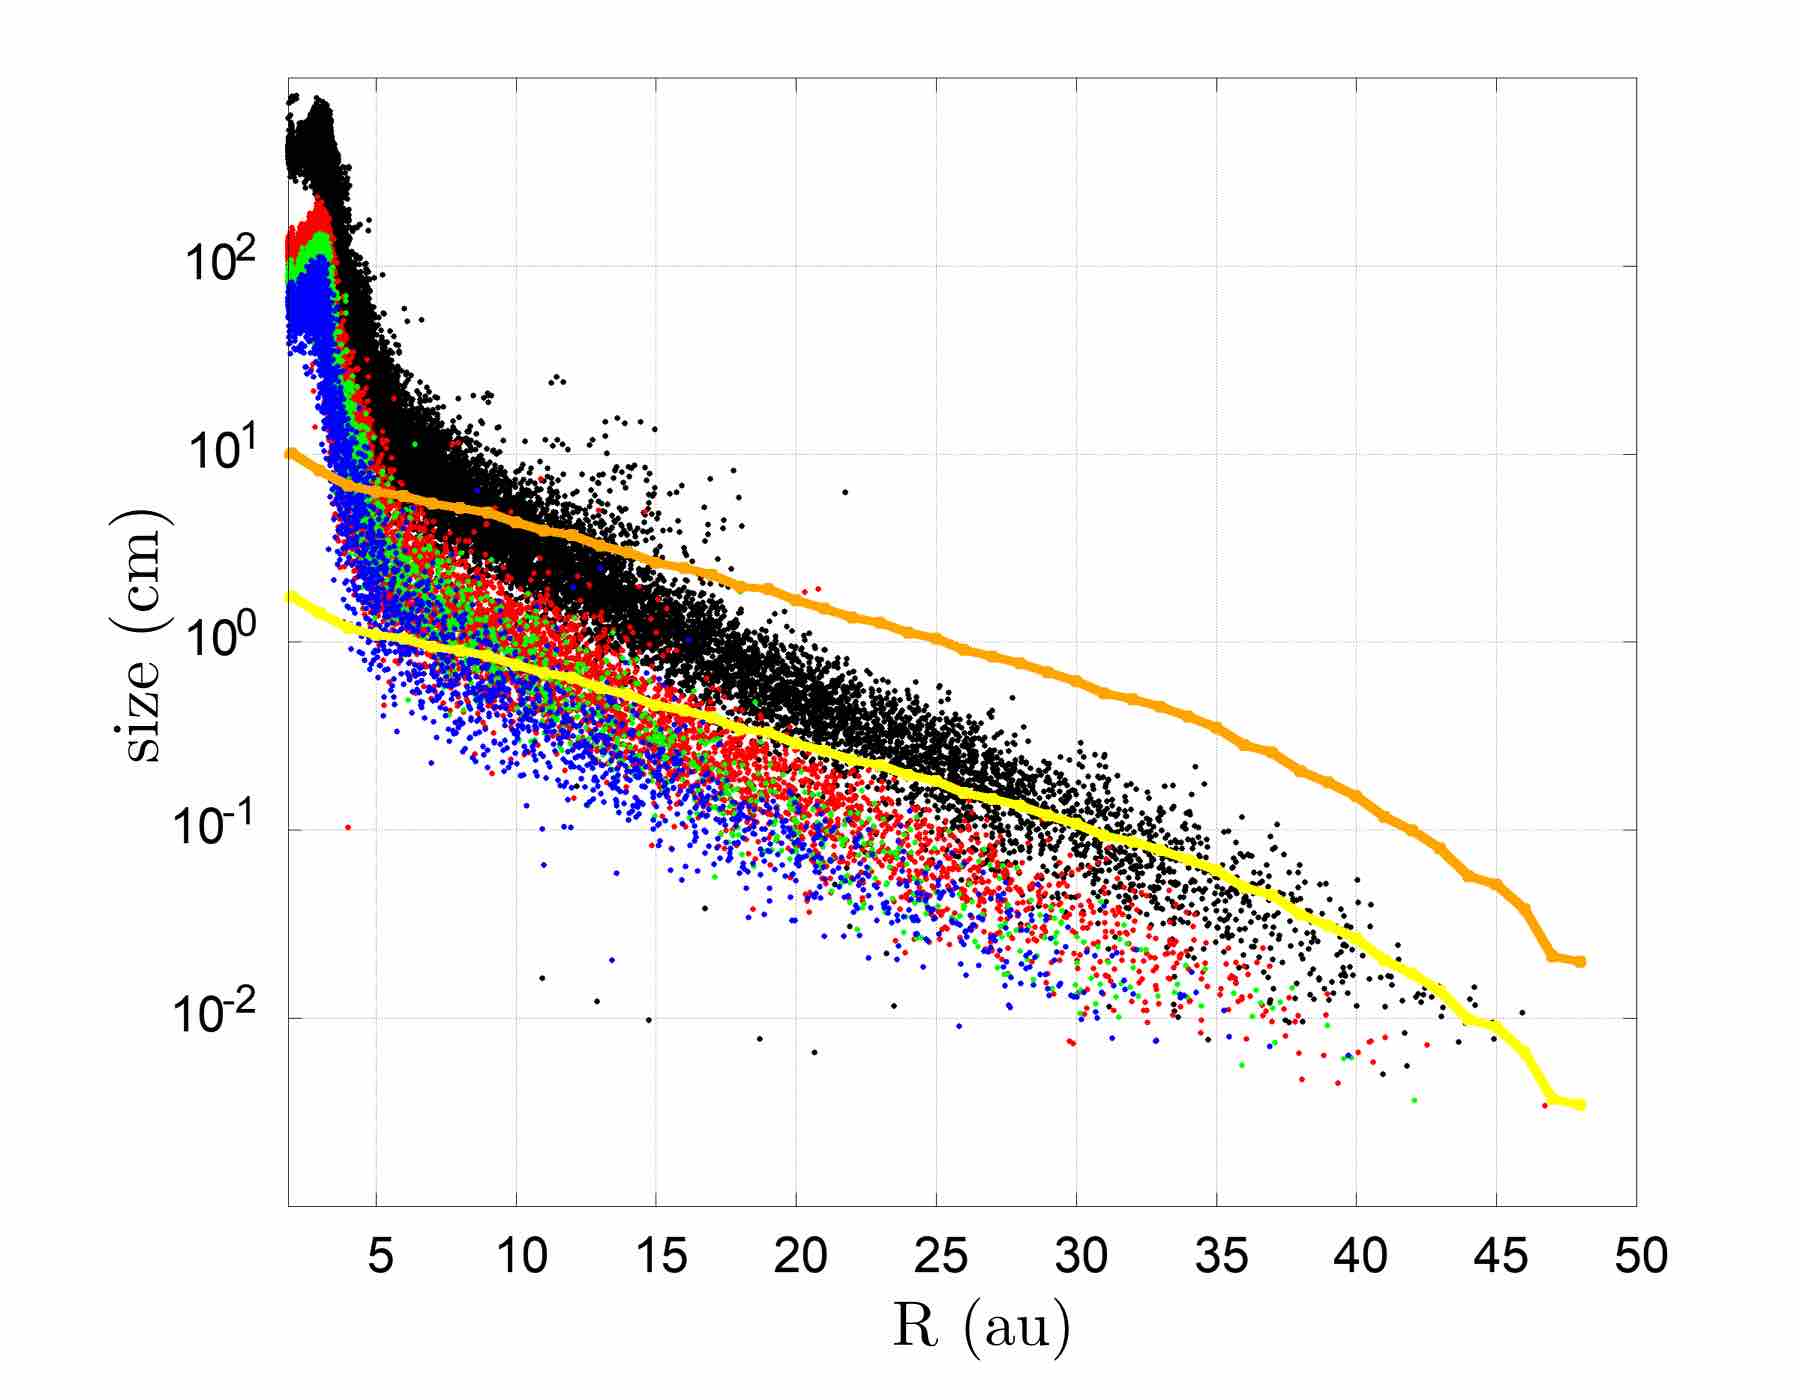
In Fig. 3 we plot the time evolution of the grain size for the same evolutionary stages reported in Fig. 1. The orange and yellow lines represent the optimal drift size (the particle size at which the drift is most efficient, i.e. for which ) in the midplane for ice, , and wustite, , respectively, calculated using the following equation:
| (8) |
(Fouchet et al., 2007; Laibe et al., 2008). for sulfides and for silicates lay in between as they are functions of the intrinsic density, .
The profile of the size distribution in the G case shows a trend which is similar to our previous results, as the resulting size distribution is a function of the different intrinsic densities of the dust species, with an average size decreasing from ice to silicates, sulfides and wustite. In the GF case we see that sulfides grow larger than silicates in the inner regions. Moreover, in the disc zone where , the size of the ice and sulfide particles is also larger when compared to the respective values which result from the pure-growth simulation. This behaviour, which at first glance can seem counter-intuitive, will be explained in detail in Section 4. In the outer part of the disc the resulting growth profile is not so different when both cases are compared.
Moreover, growth and fragmentation affect the radial drift in different ways. It can be seen that, in the G case, silicate and wustite particles reach their optimal drift size in yr in the inner disc and within 2000-3000 yr in the outer disc. In the GF case, these timescales increase.
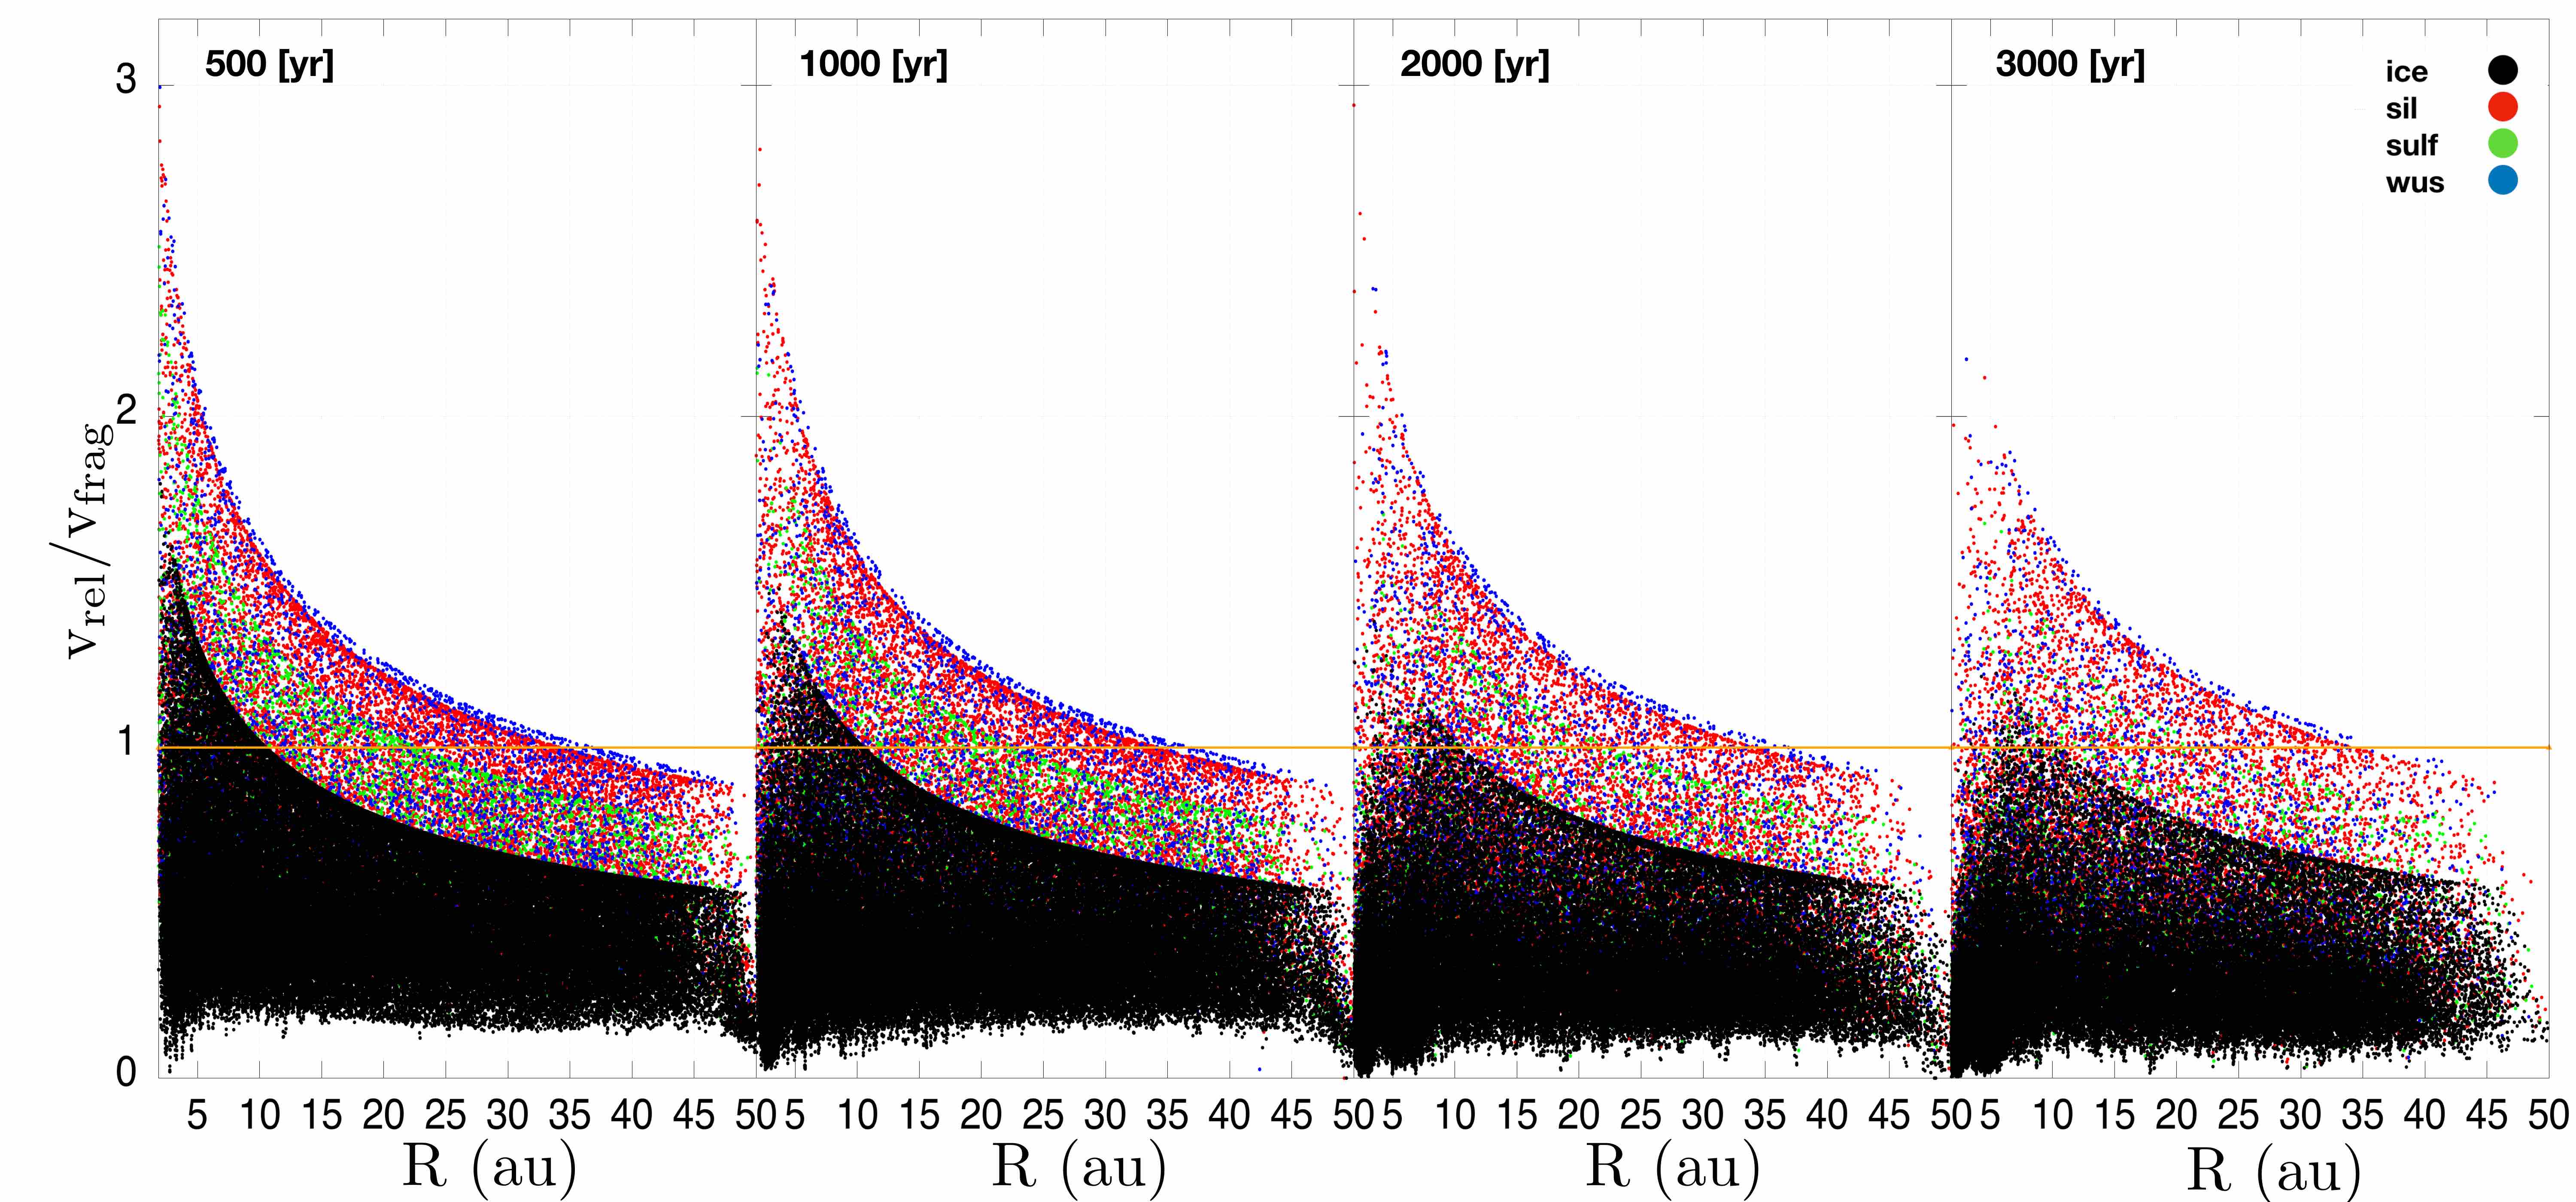
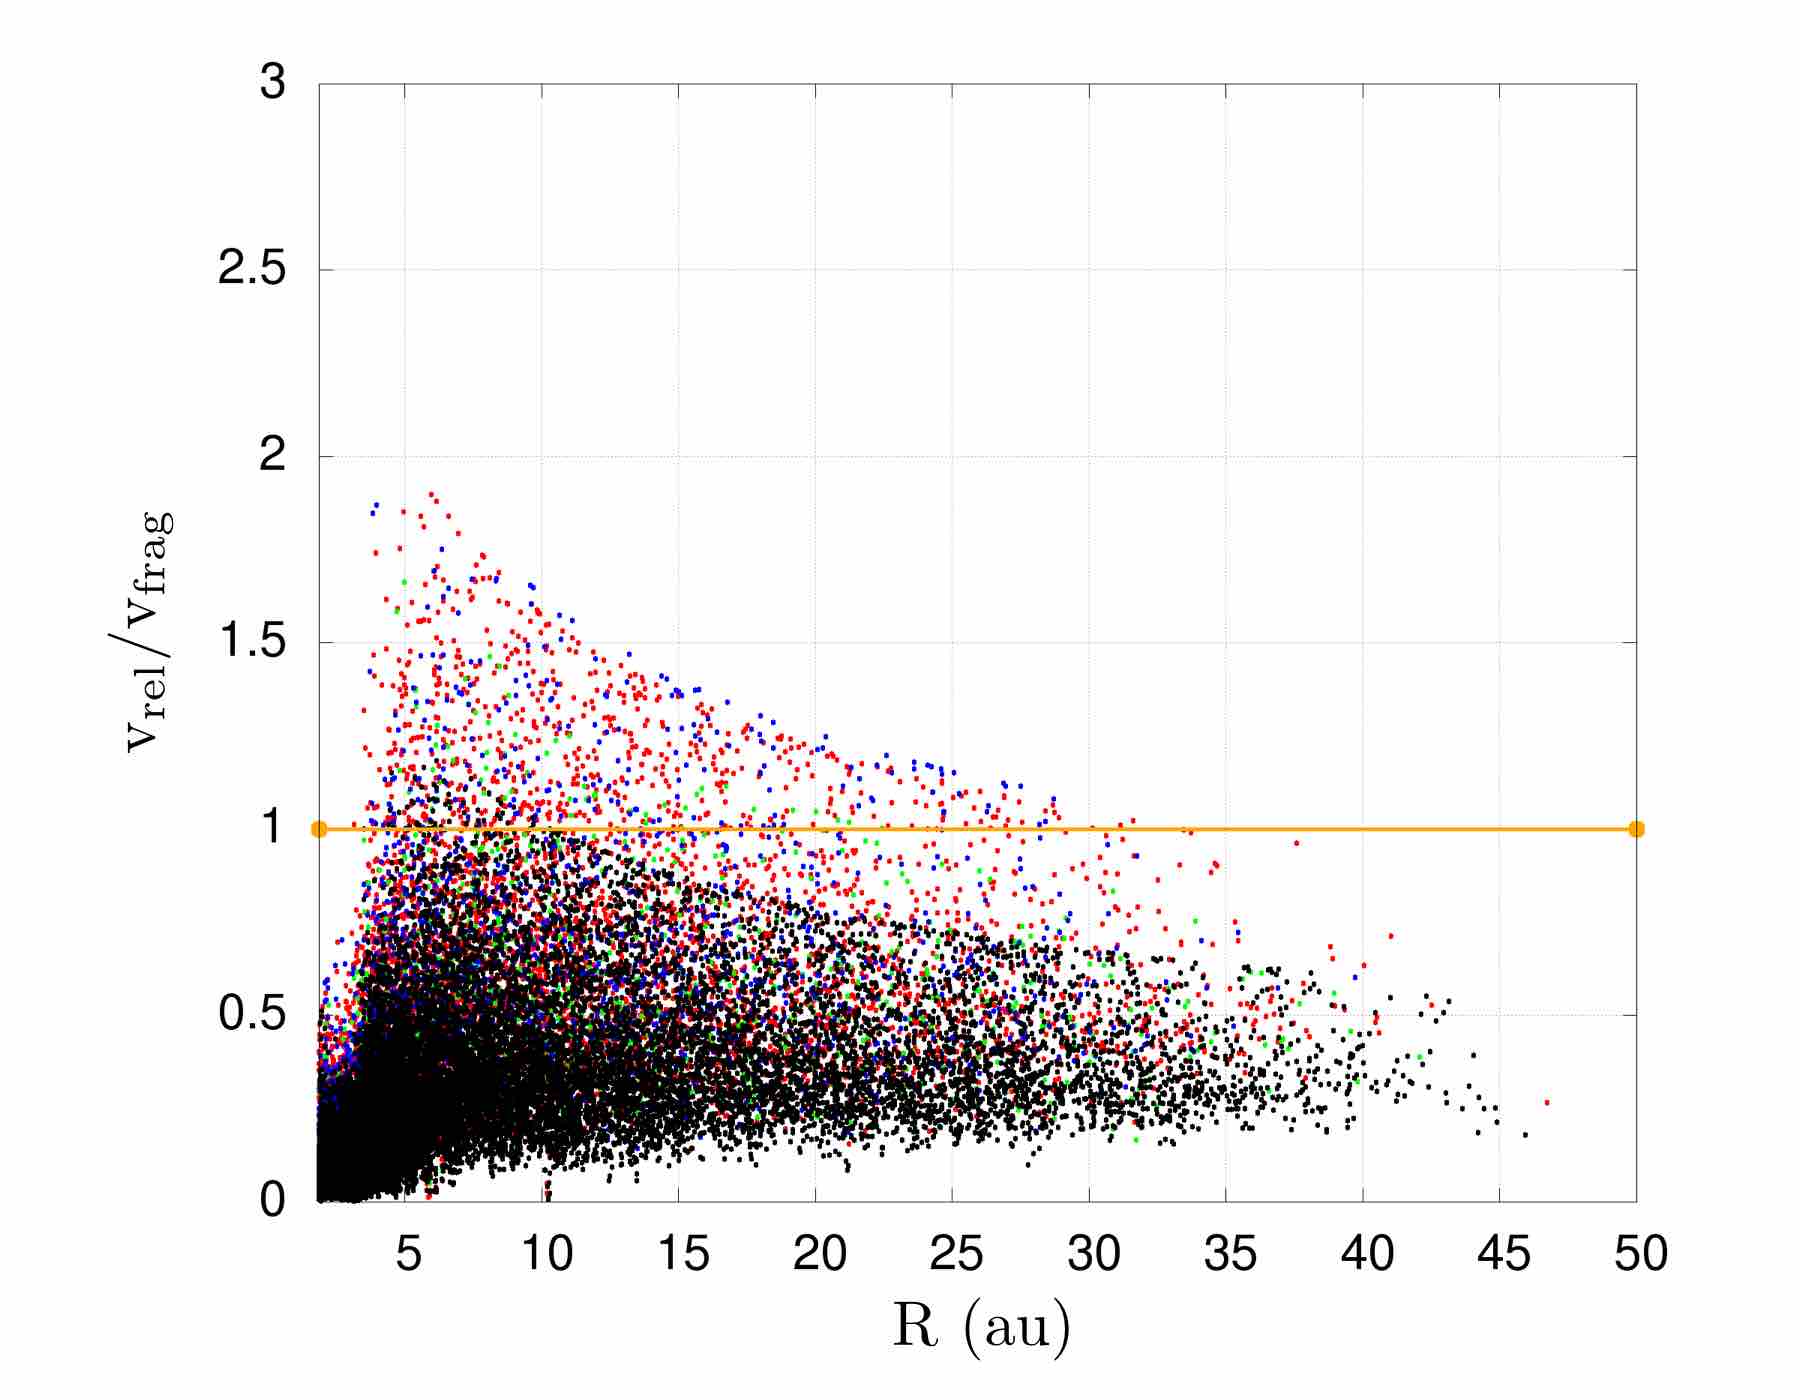
In Fig. 4 we plot the ratio between the relative velocity of particles, , and their respective fragmentation velocities, , (see Table 1). At early stages of the simulation, the fragmentation threshold is reached for all species up to large distances (up to au). In the inner disc we have values that can reach over twice the threshold. However, in the case of ice grains, fragmentation occurs within au and only for the first yr. After this time, ice can be considered in the regime of pure growth while other species keep experiencing fragmentation. Beyond au, the disc is basically in a pure-growth regime as all the are under their respective fragmentation velocities. This can explain the similarity of the results between the G and GF simulations in the outer disc.
In the following, we will mainly focus on the inner 10 au of the disc where the differences between the G and GF simulations are more evident. Hereafter, similarly to Paper I, we define the surface of the disc as the location for which and the midplane the location where . The choice of a flat boundary between the midplane and the surface and that of the (although arbitrary) midplane’s thickness is suggested by theoretical and observational evidence. Laibe et al. (2008, 2014b), Paper I (and references therein) showed that the distribution of large grains ( mm) follows an approximately flat radial distribution. Flat mm-dust distributions are also observed in protoplanetary discs (e.g. Pinte et al., 2016). In Paper I we considered a midplane thickness of au with a disc size in the order of au, thus with a ratio of 0.01. This value is consistent with the millimeter dust scale height of 1 au at 100 au for HL-Tau (Pinte et al., 2016) evidencing a flat mm-dust profile. This ratio is preserved, for consistency, in this work. Note that the chosen thickness can encompass the total dust scale-height in the innermost region of the disc where au. This does not affect the results as the settling is very efficient (Paper I and Laibe et al. (2008)) and as we are interested in exploring the differences between the G and GF cases for which we fix a common set of parameters.
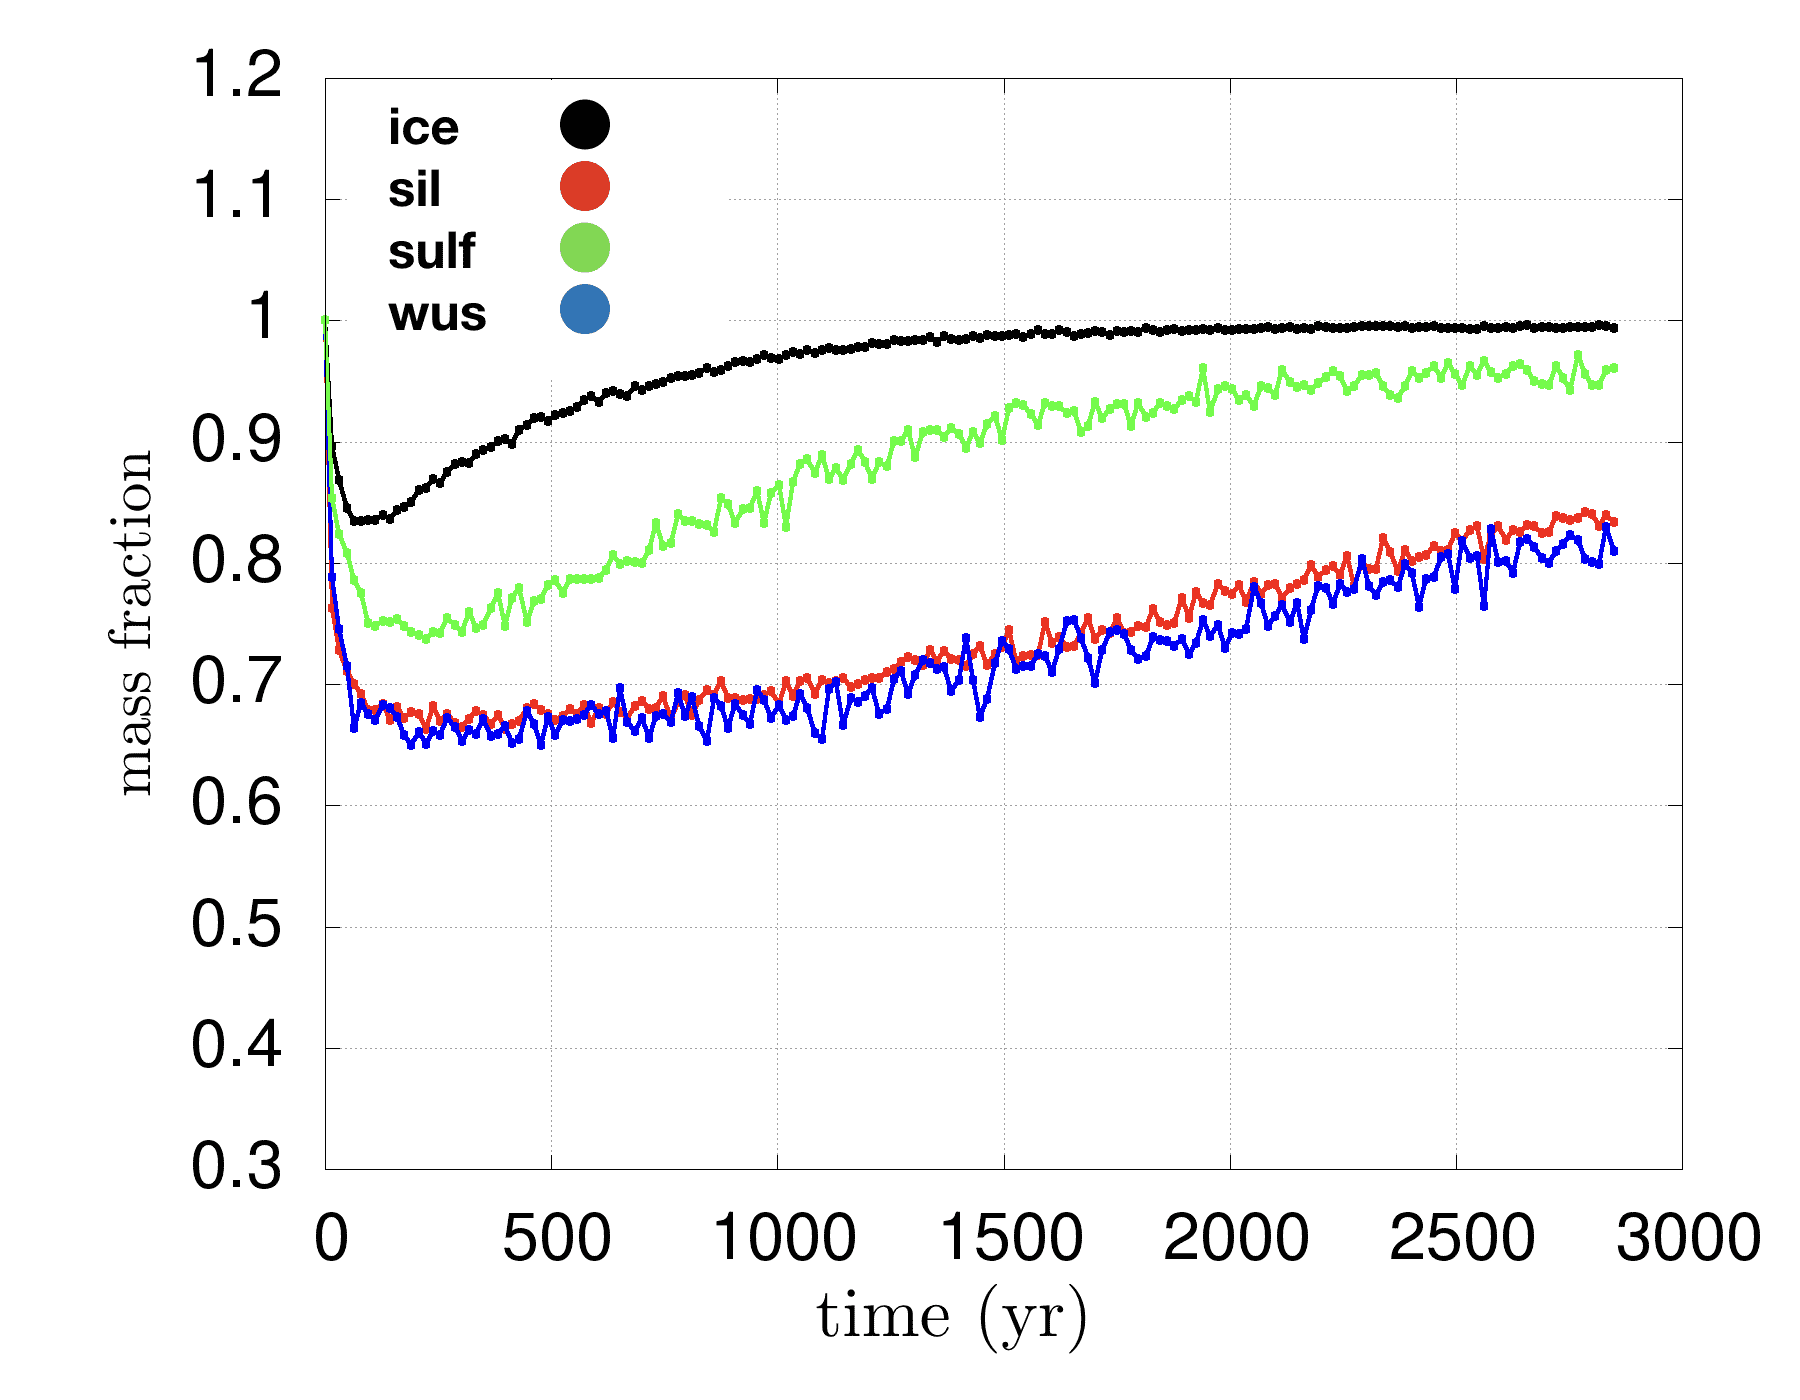
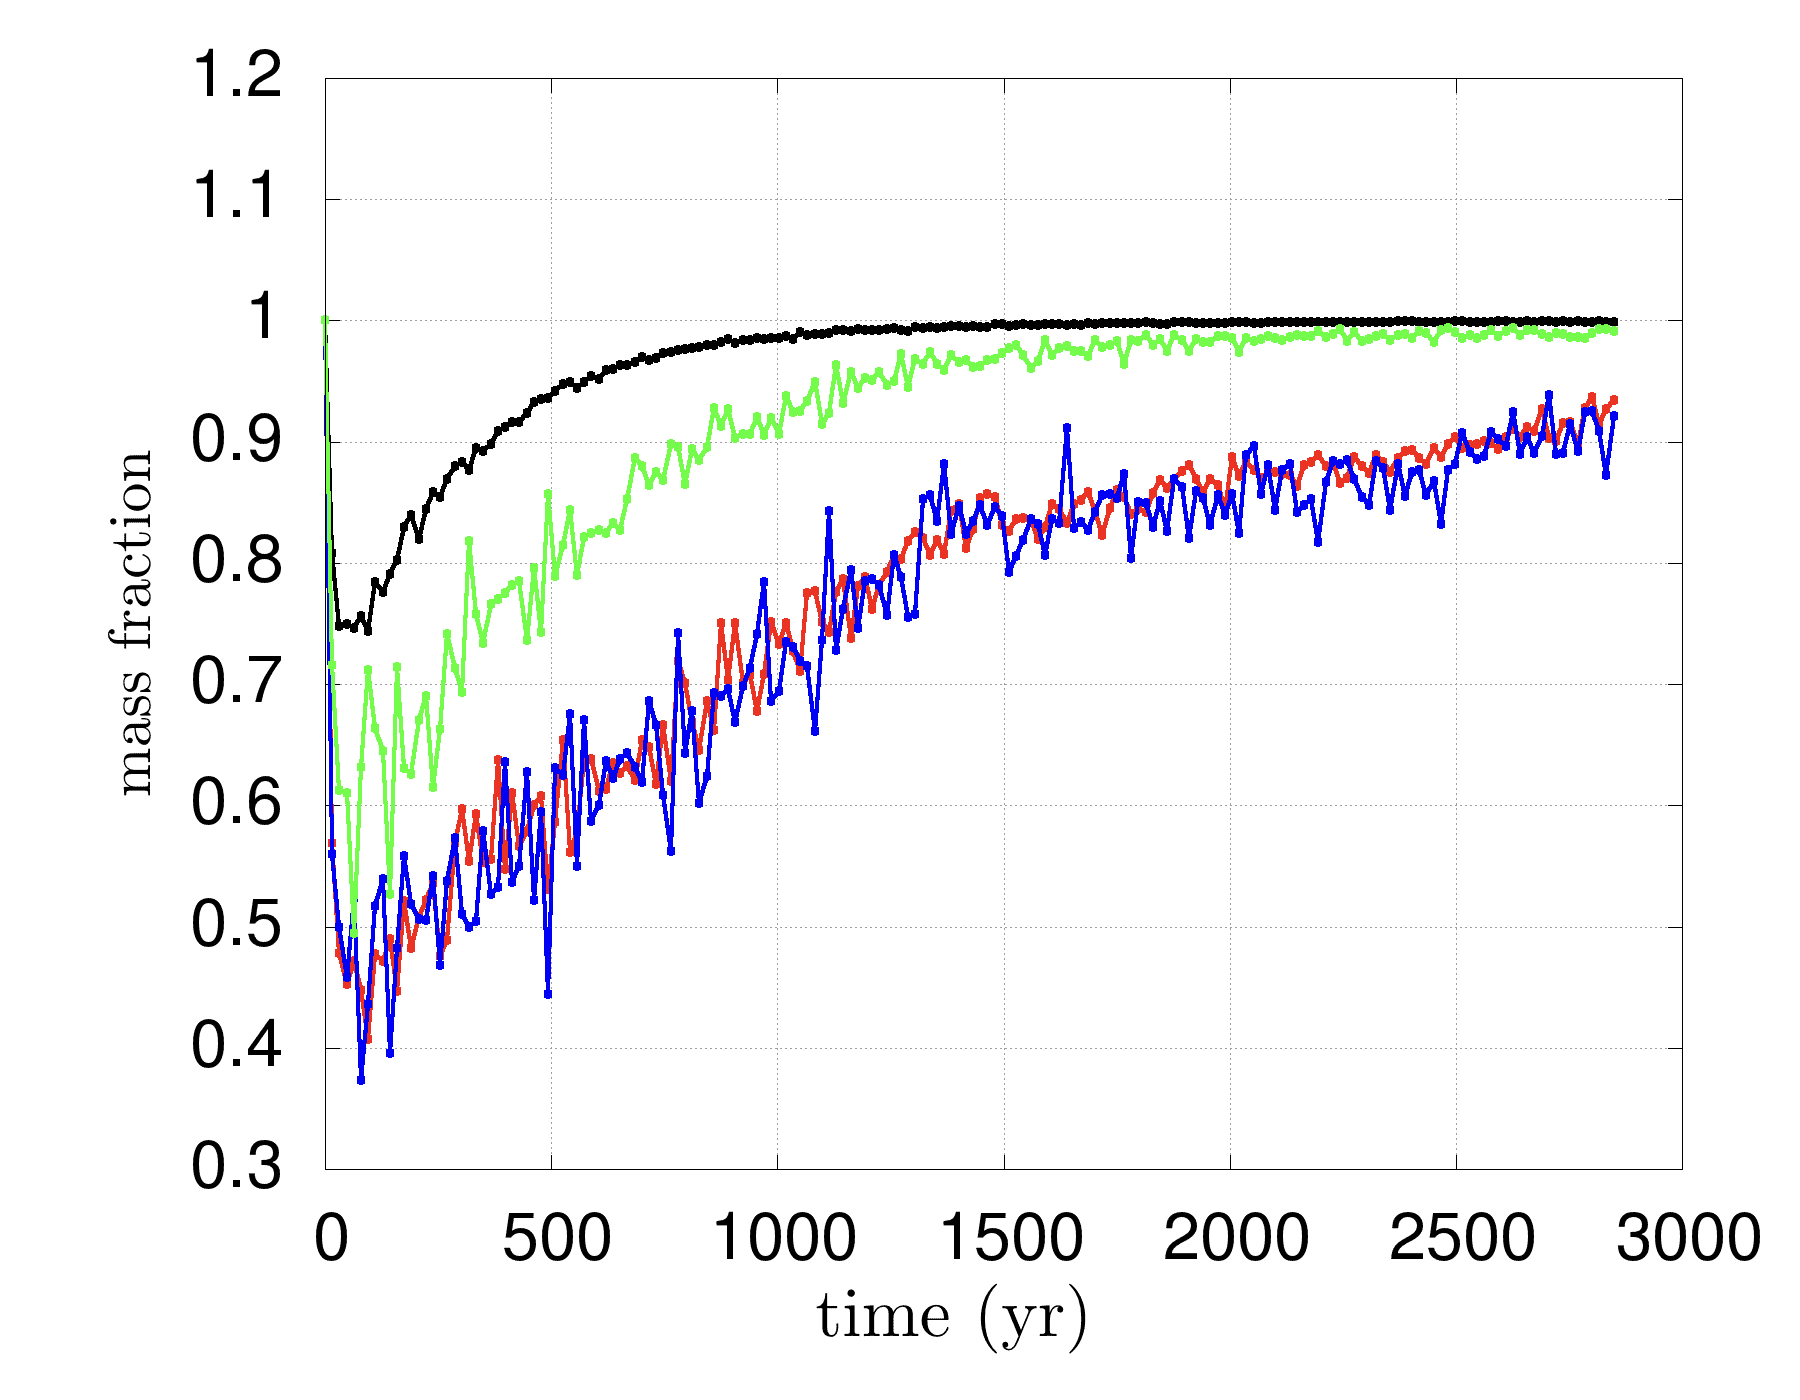
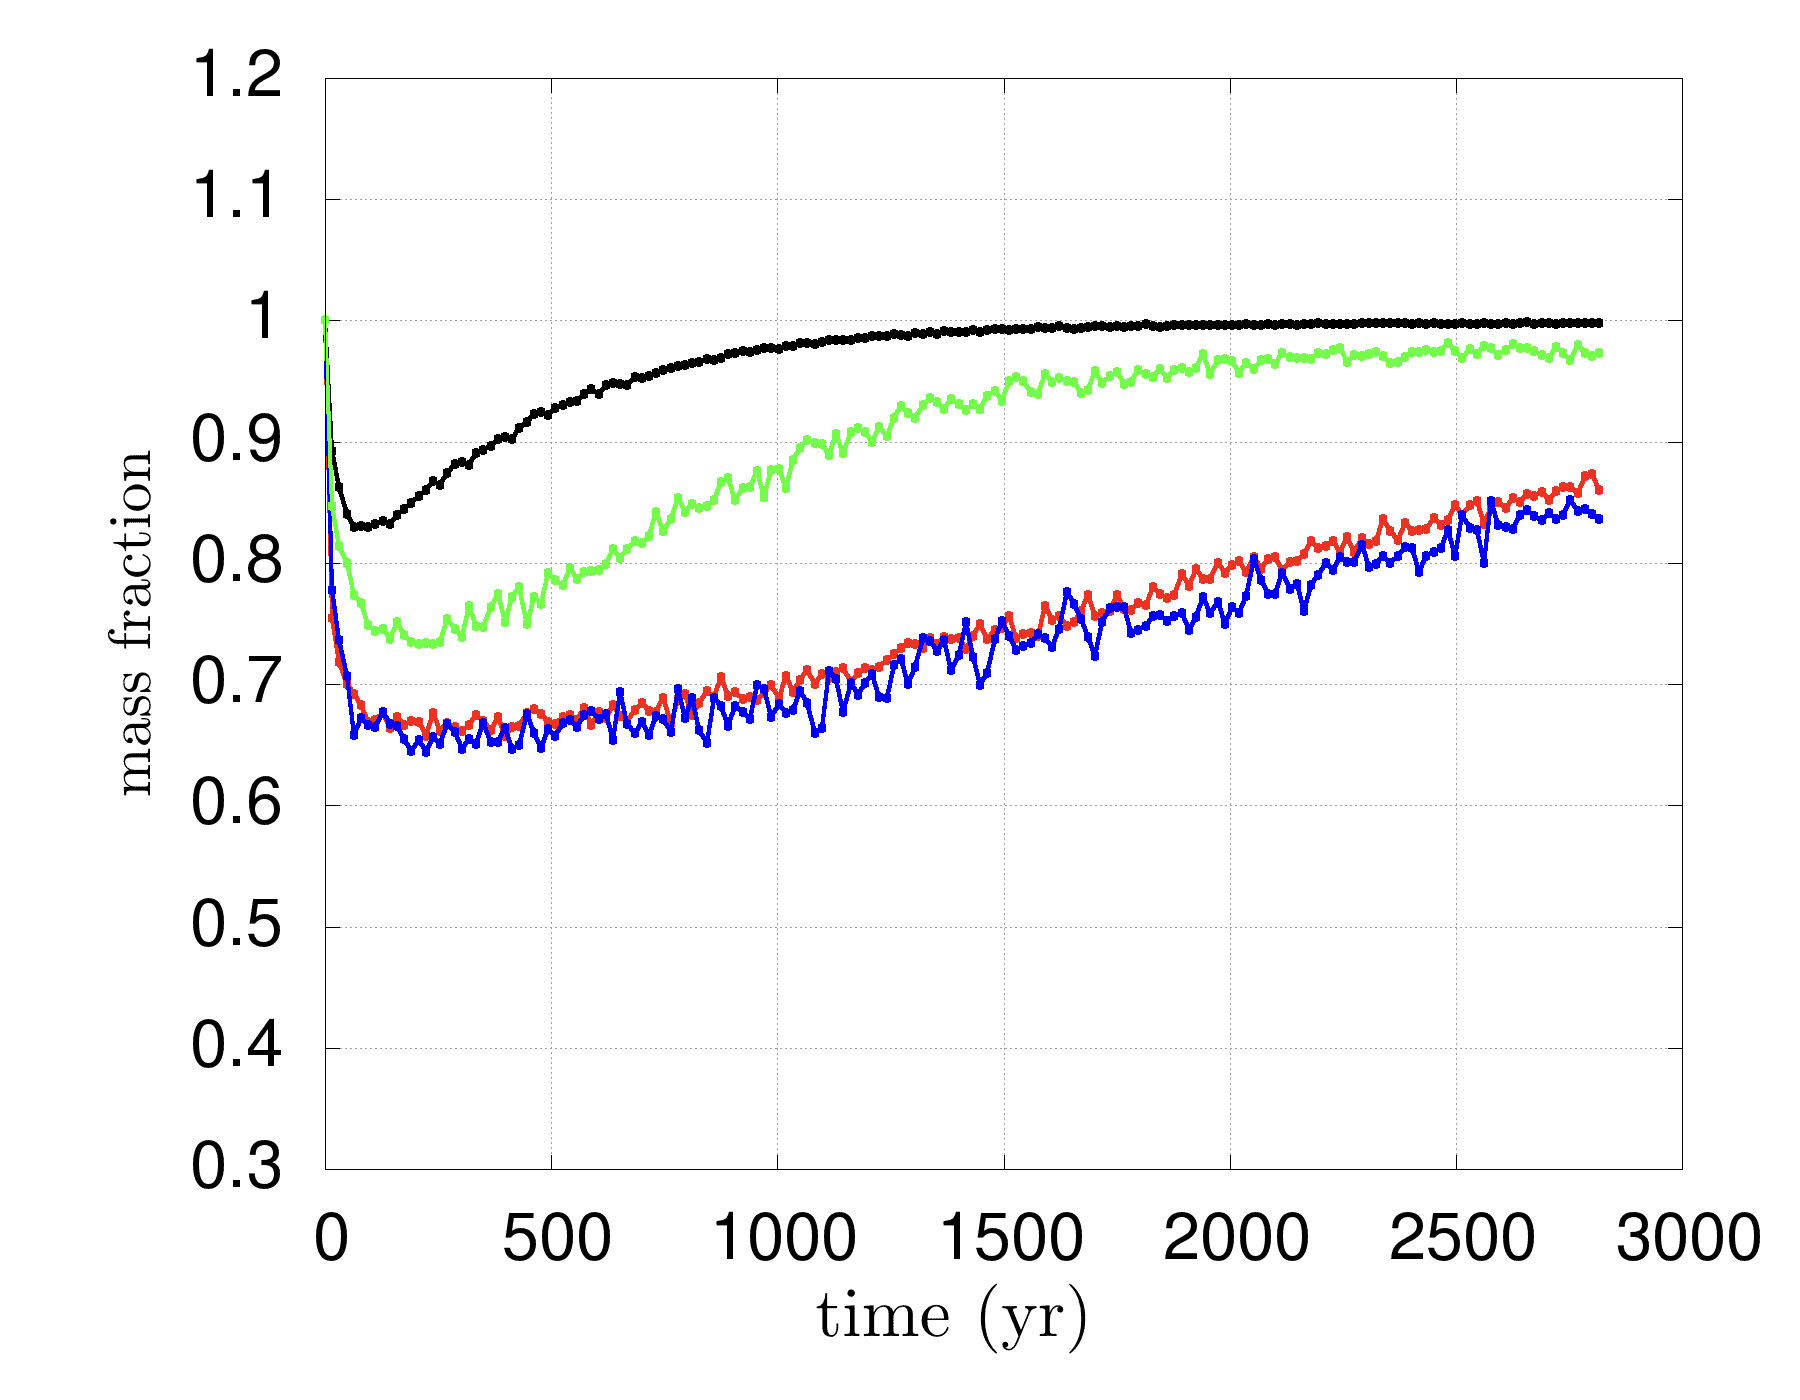
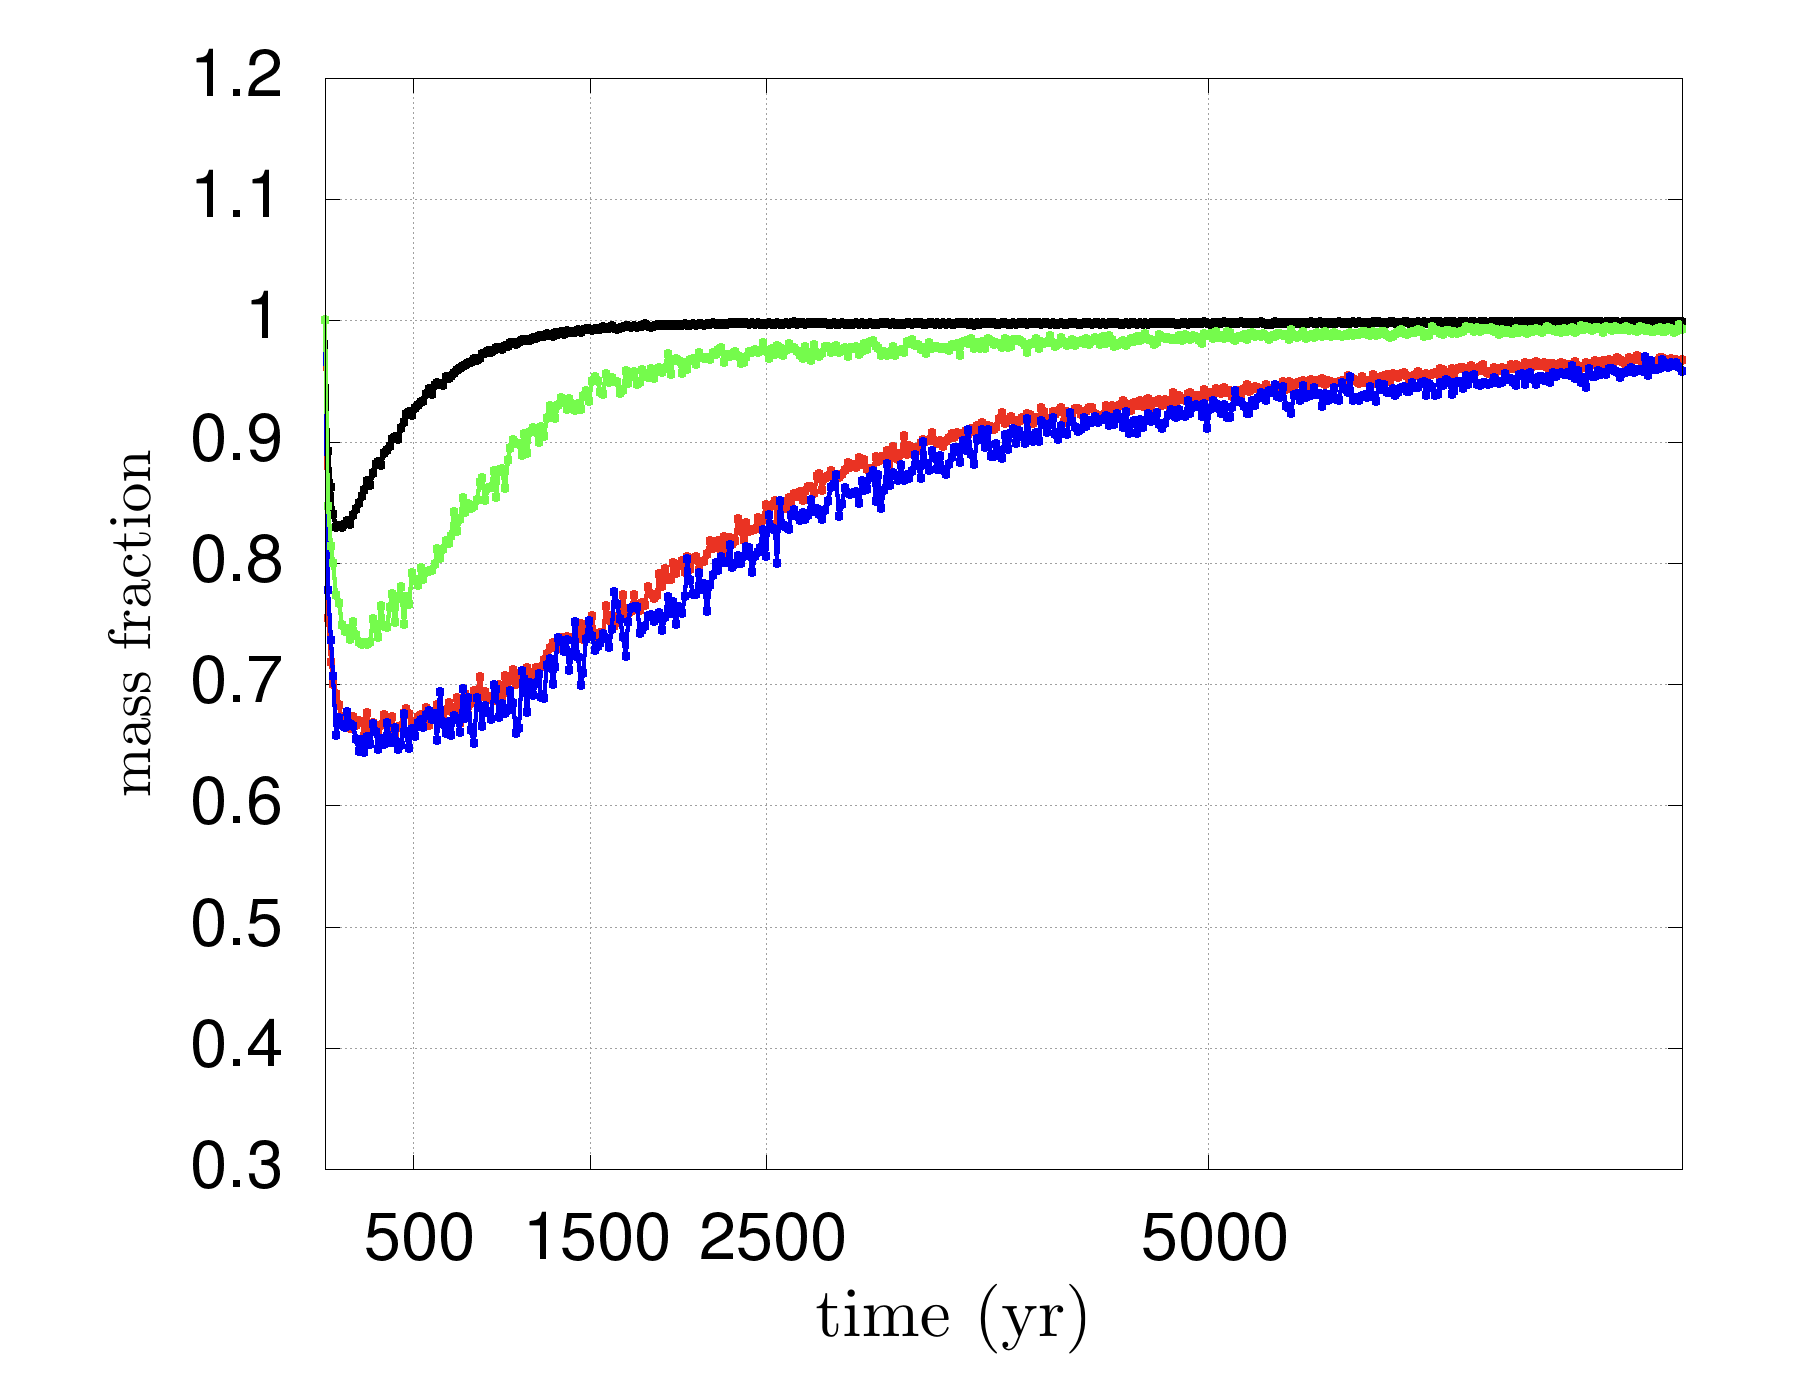
In Fig. 5 we report, for different species and for the first 10 au, the evolution with time of the mass fraction of each species which is under the fragmentation threshold. From top to bottom, we report values for the disc surface, midplane and the whole disc (surface and midplane). Figure 5 shows that the mass fraction of ice material which is under the fragmentation threshold reaches 0.9 after just 500 yr and almost 1 after 1500 yr. Sulfides reaches 0.9 at 1000 yr and approach 1 at 2500 yr. When the whole disc is considered, silicates and wustite particles do not reach 0.9 within the considered evolutionary time. We will demonstrate that this distinct behaviour has important implications in determining the dust content and the aerodynamic sorting of the dust within the inner disc region.
3.2 Disc surface and settling


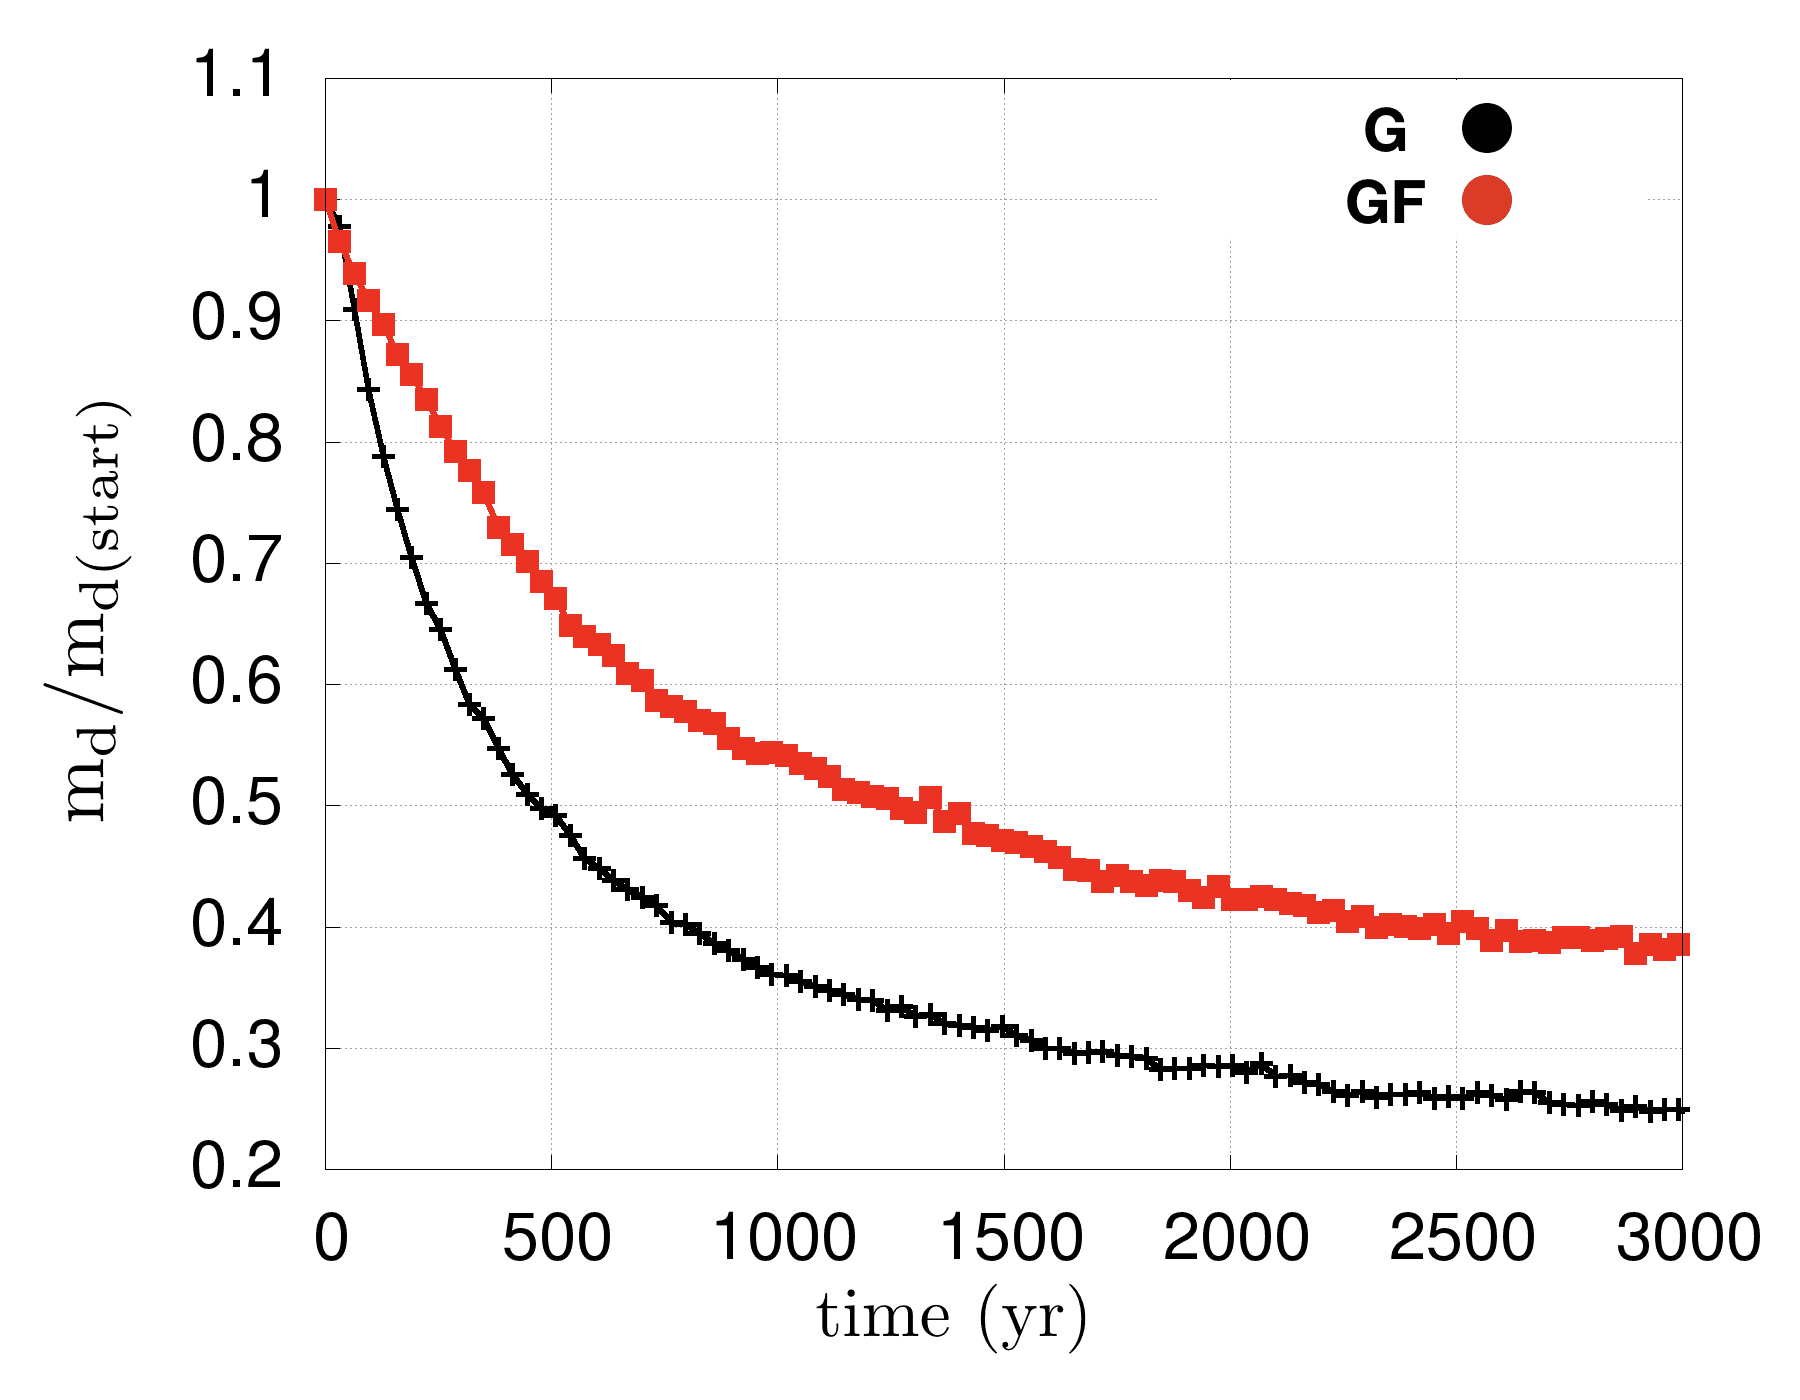
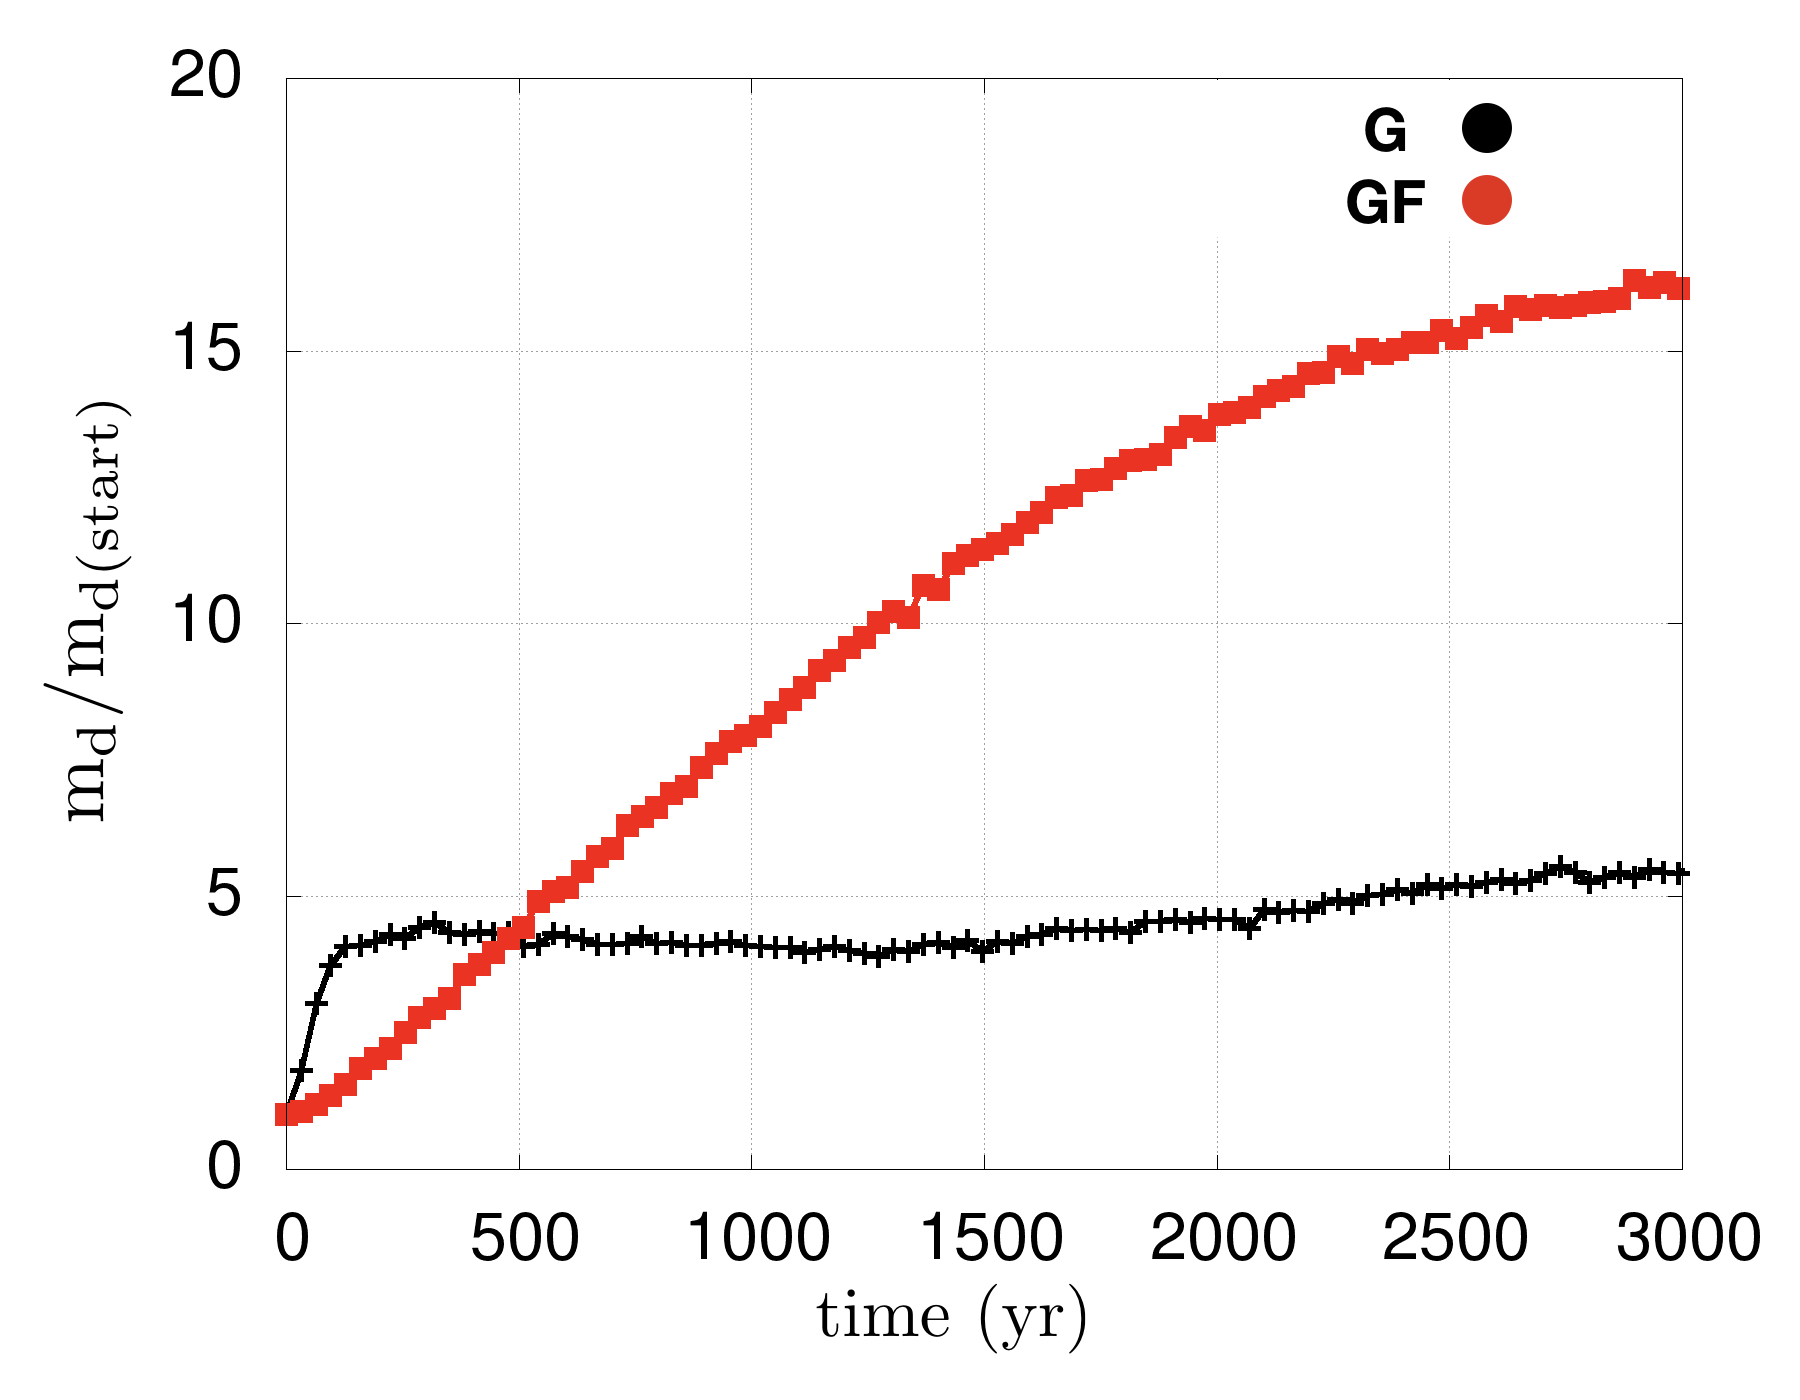
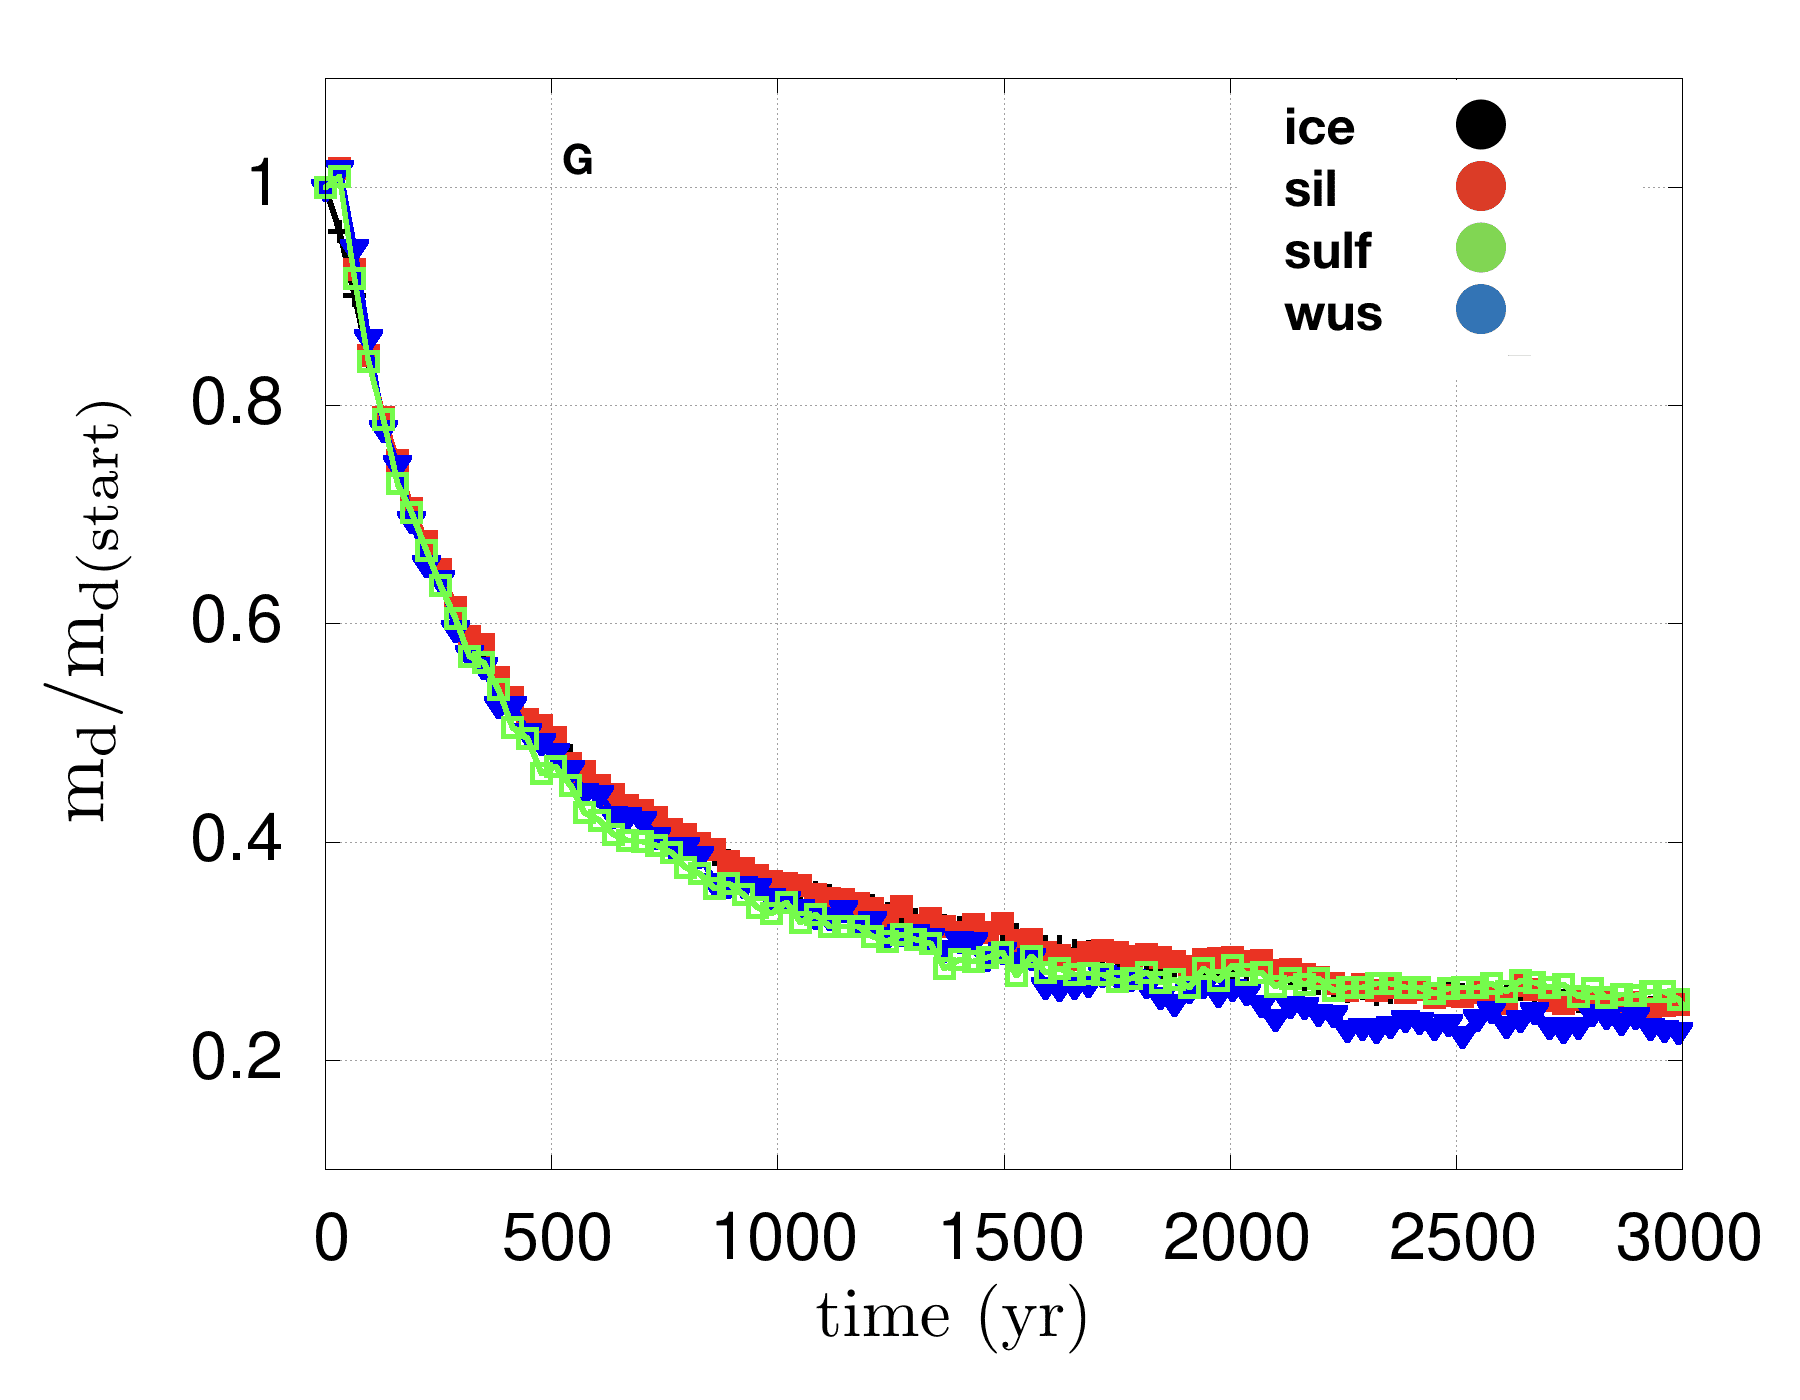
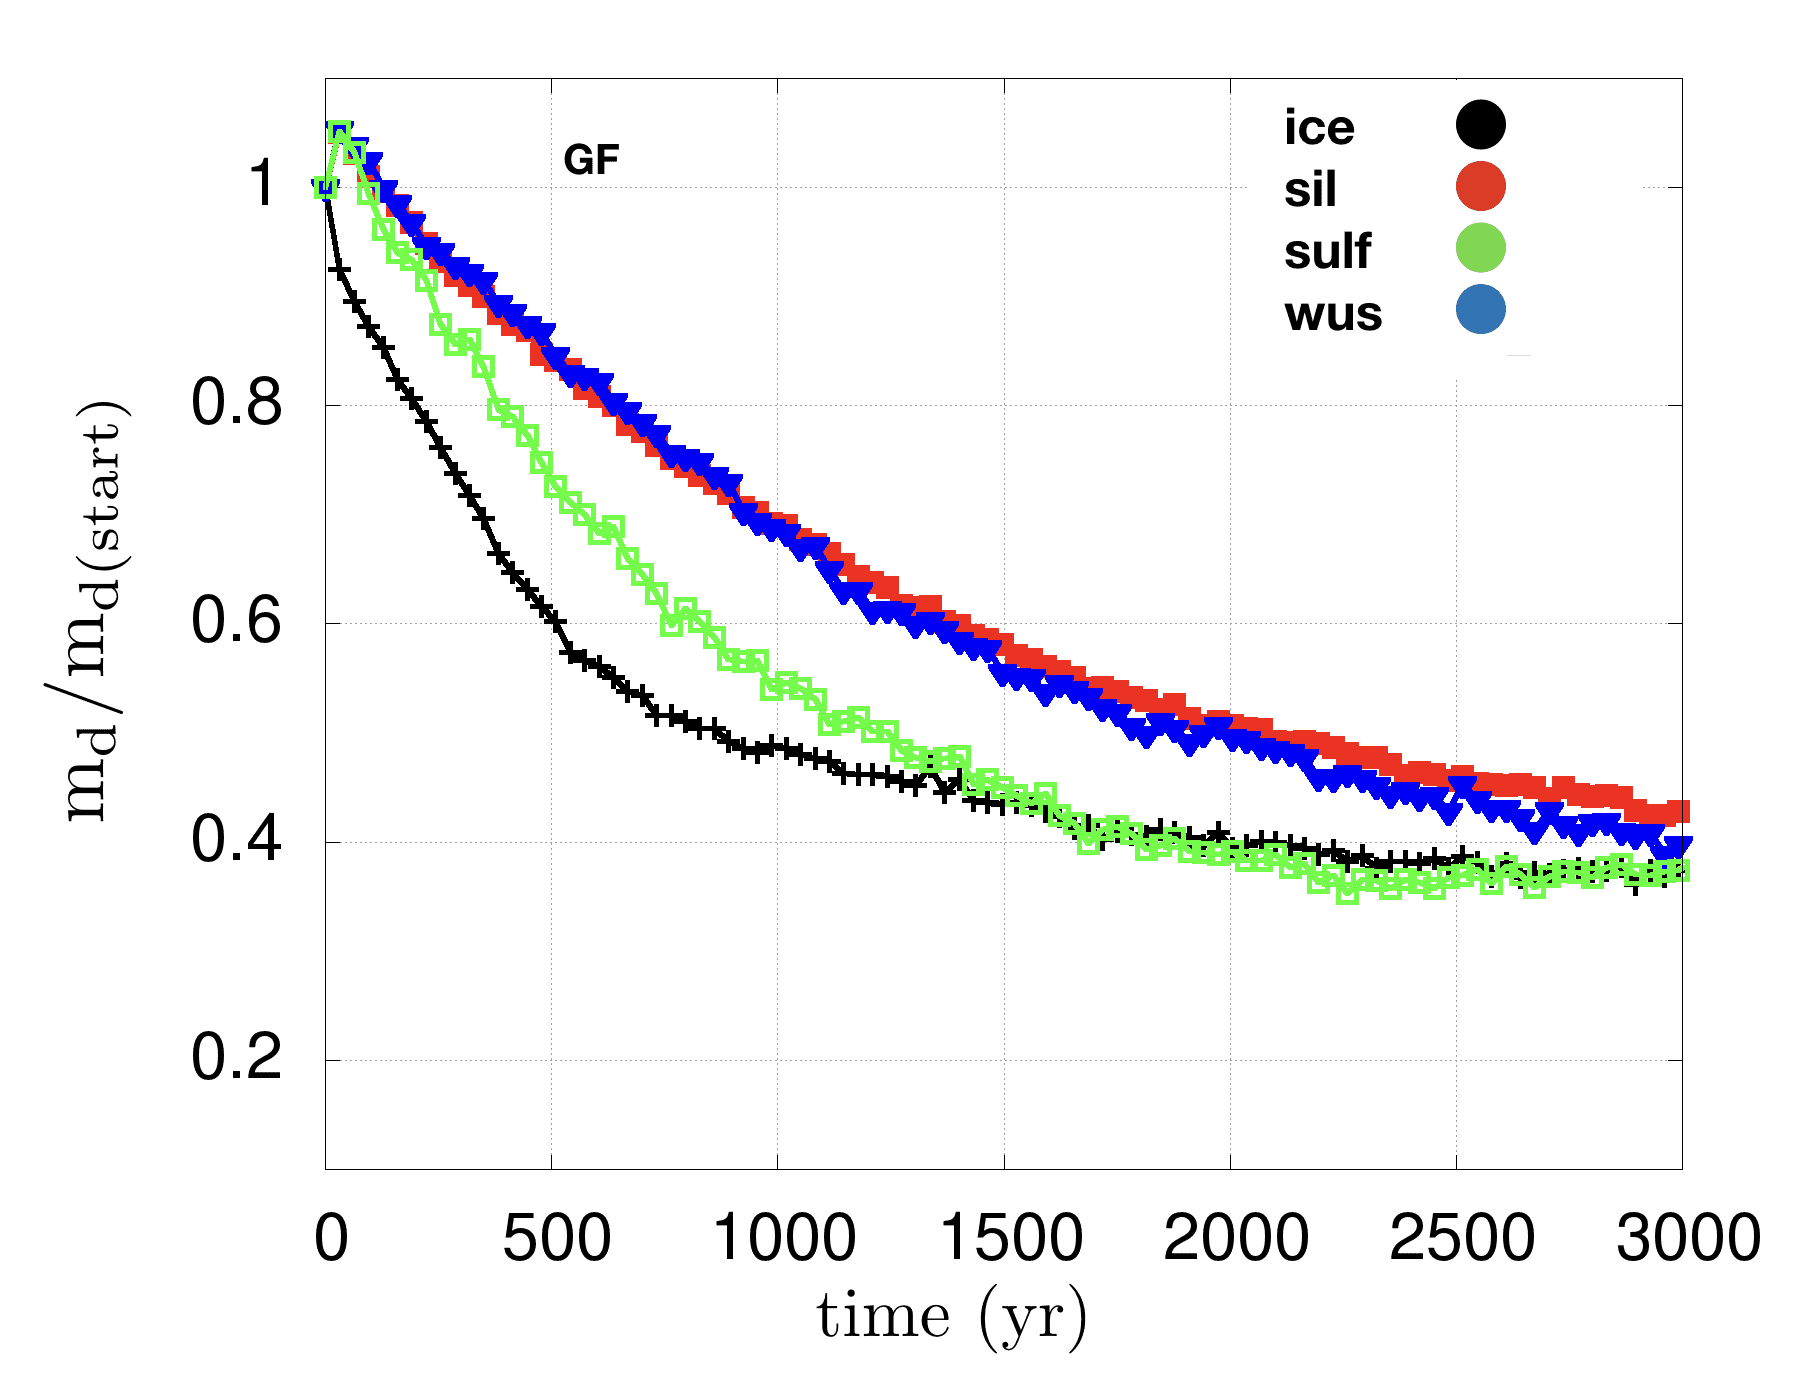
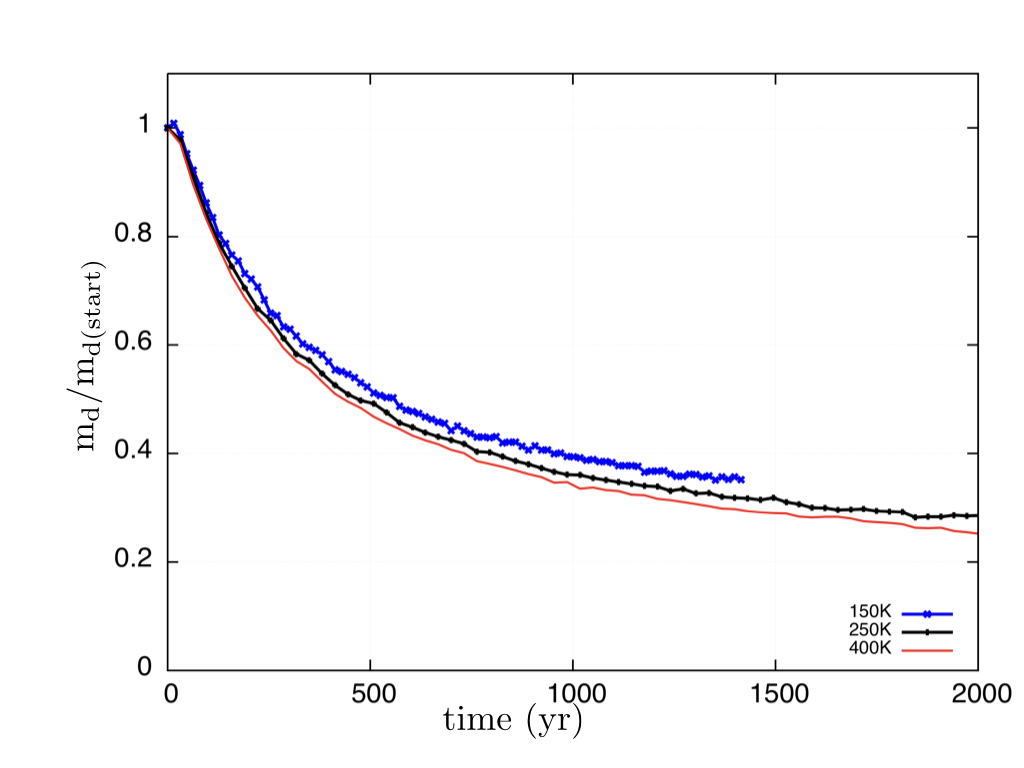
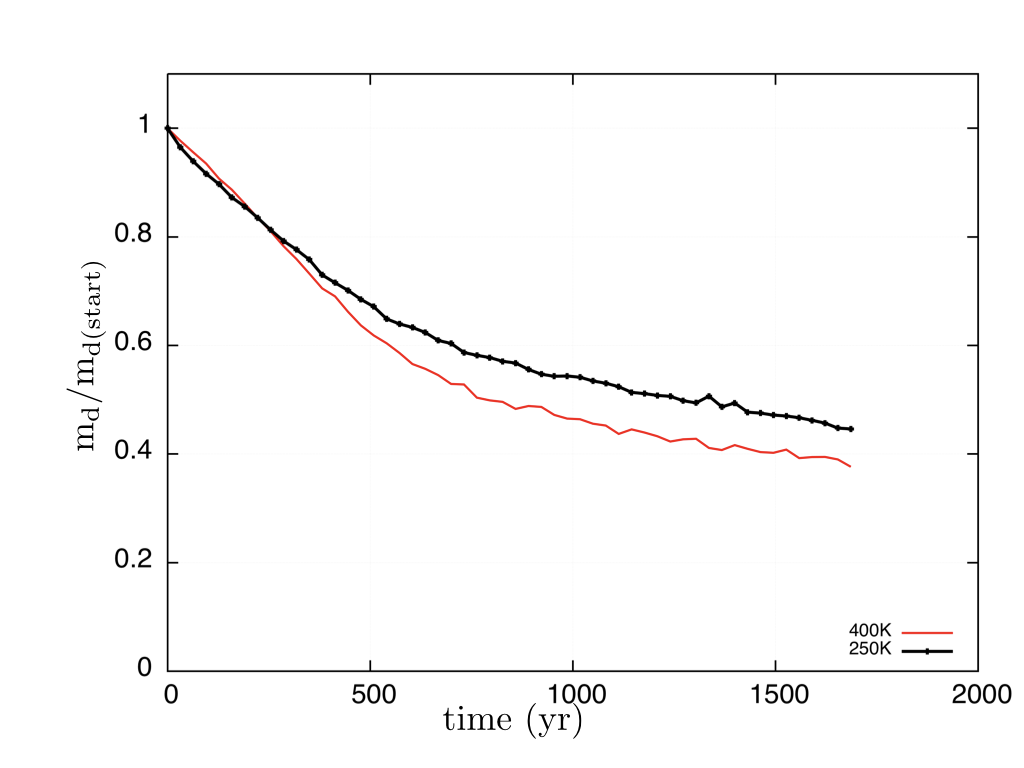
In Fig. 6, left column, we report the time evolution of the total dust mass content compared to the initial mass present in the disc surface where and : globally in the G and GF cases (top), and for single species in the G (middle) and GF (bottom) cases. In G dust settles toward the midplane at a higher rate. The rate of settling for each single species in G is similar, with differences driven by their intrinsic densities as explained in Paper I. In GF, ice and sulfides settle with higher rates than wustite and silicates.
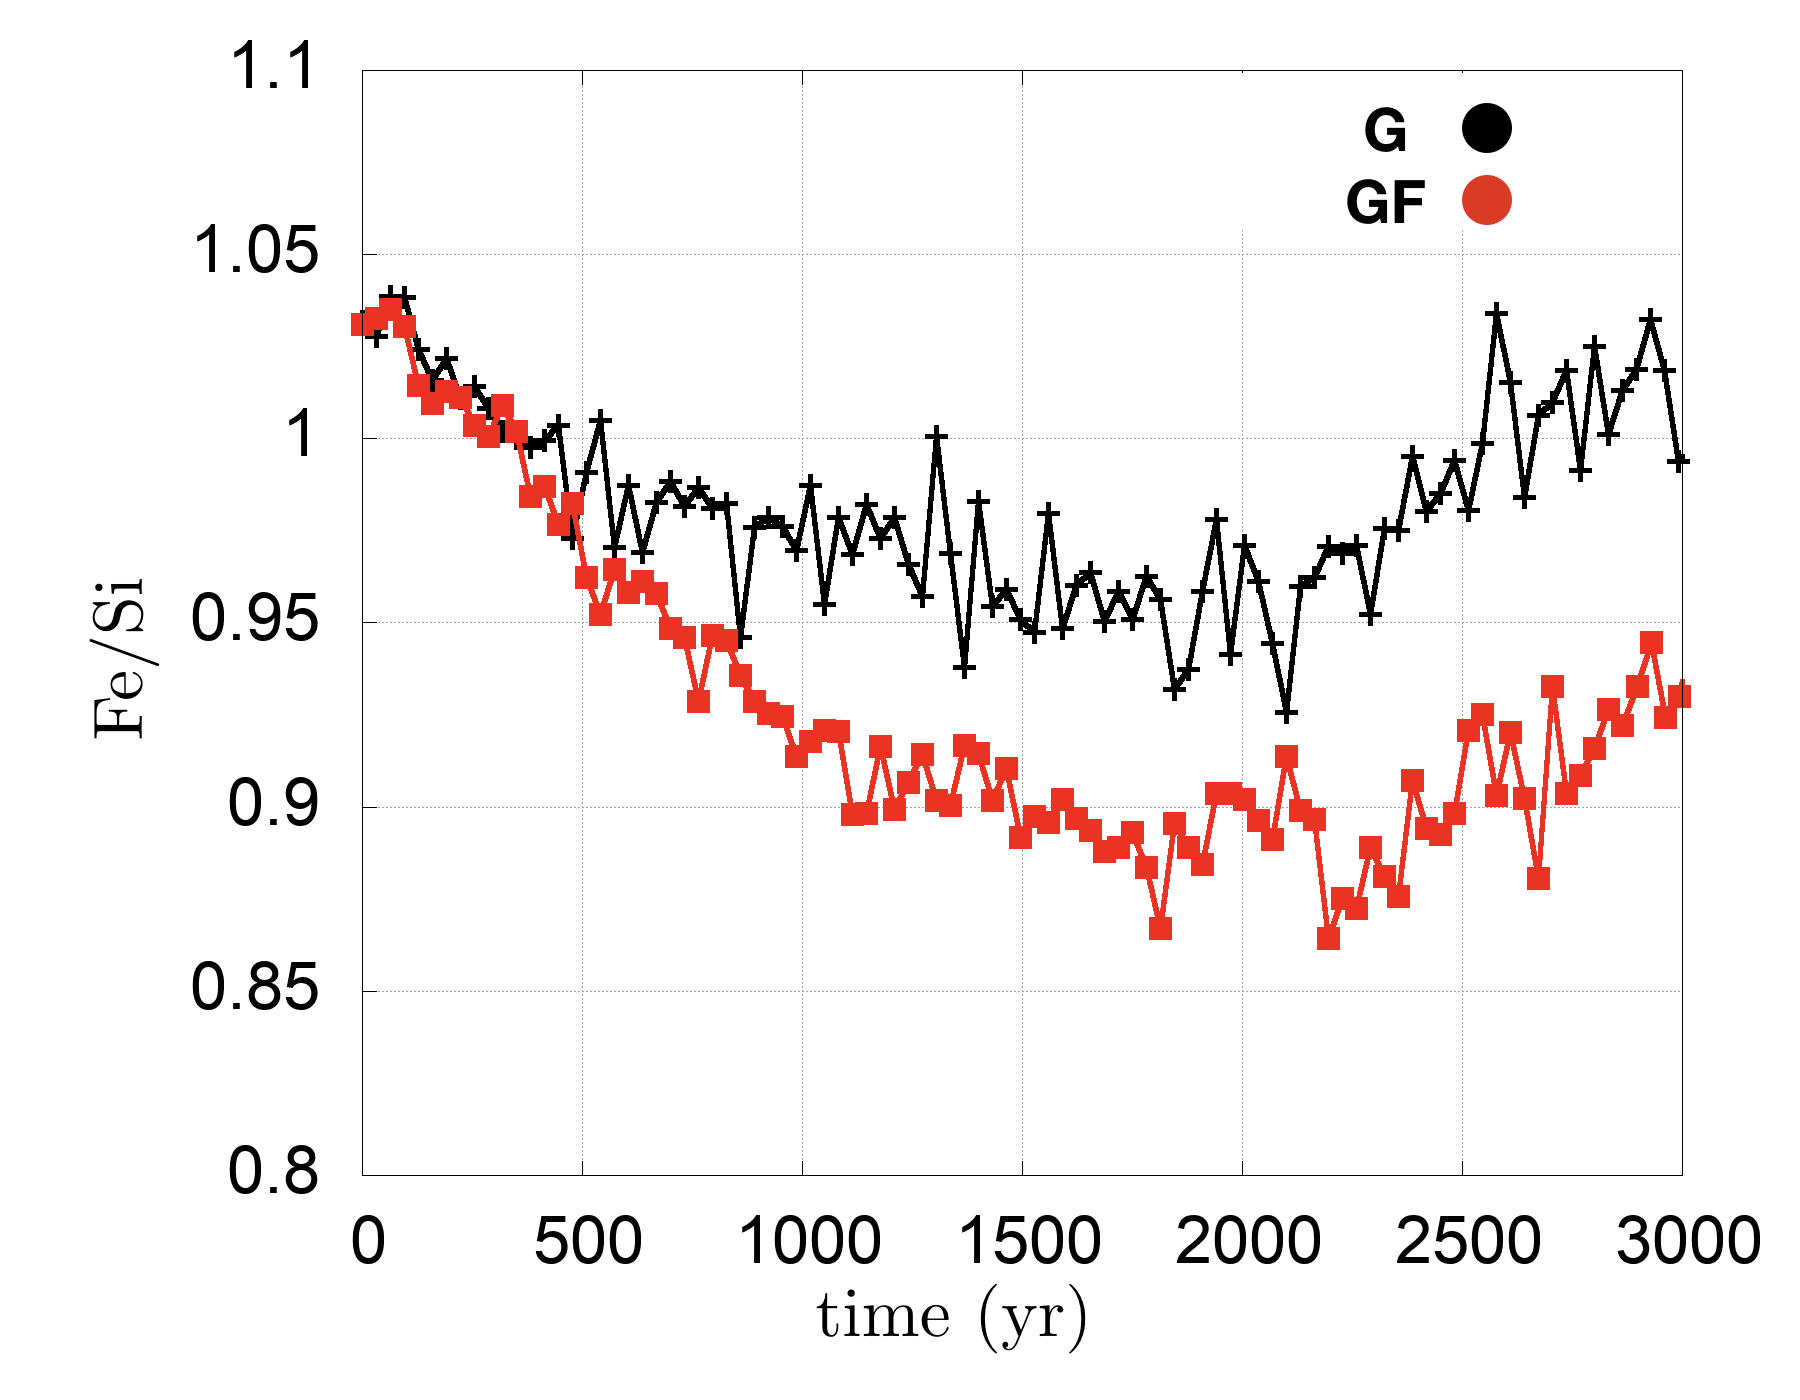
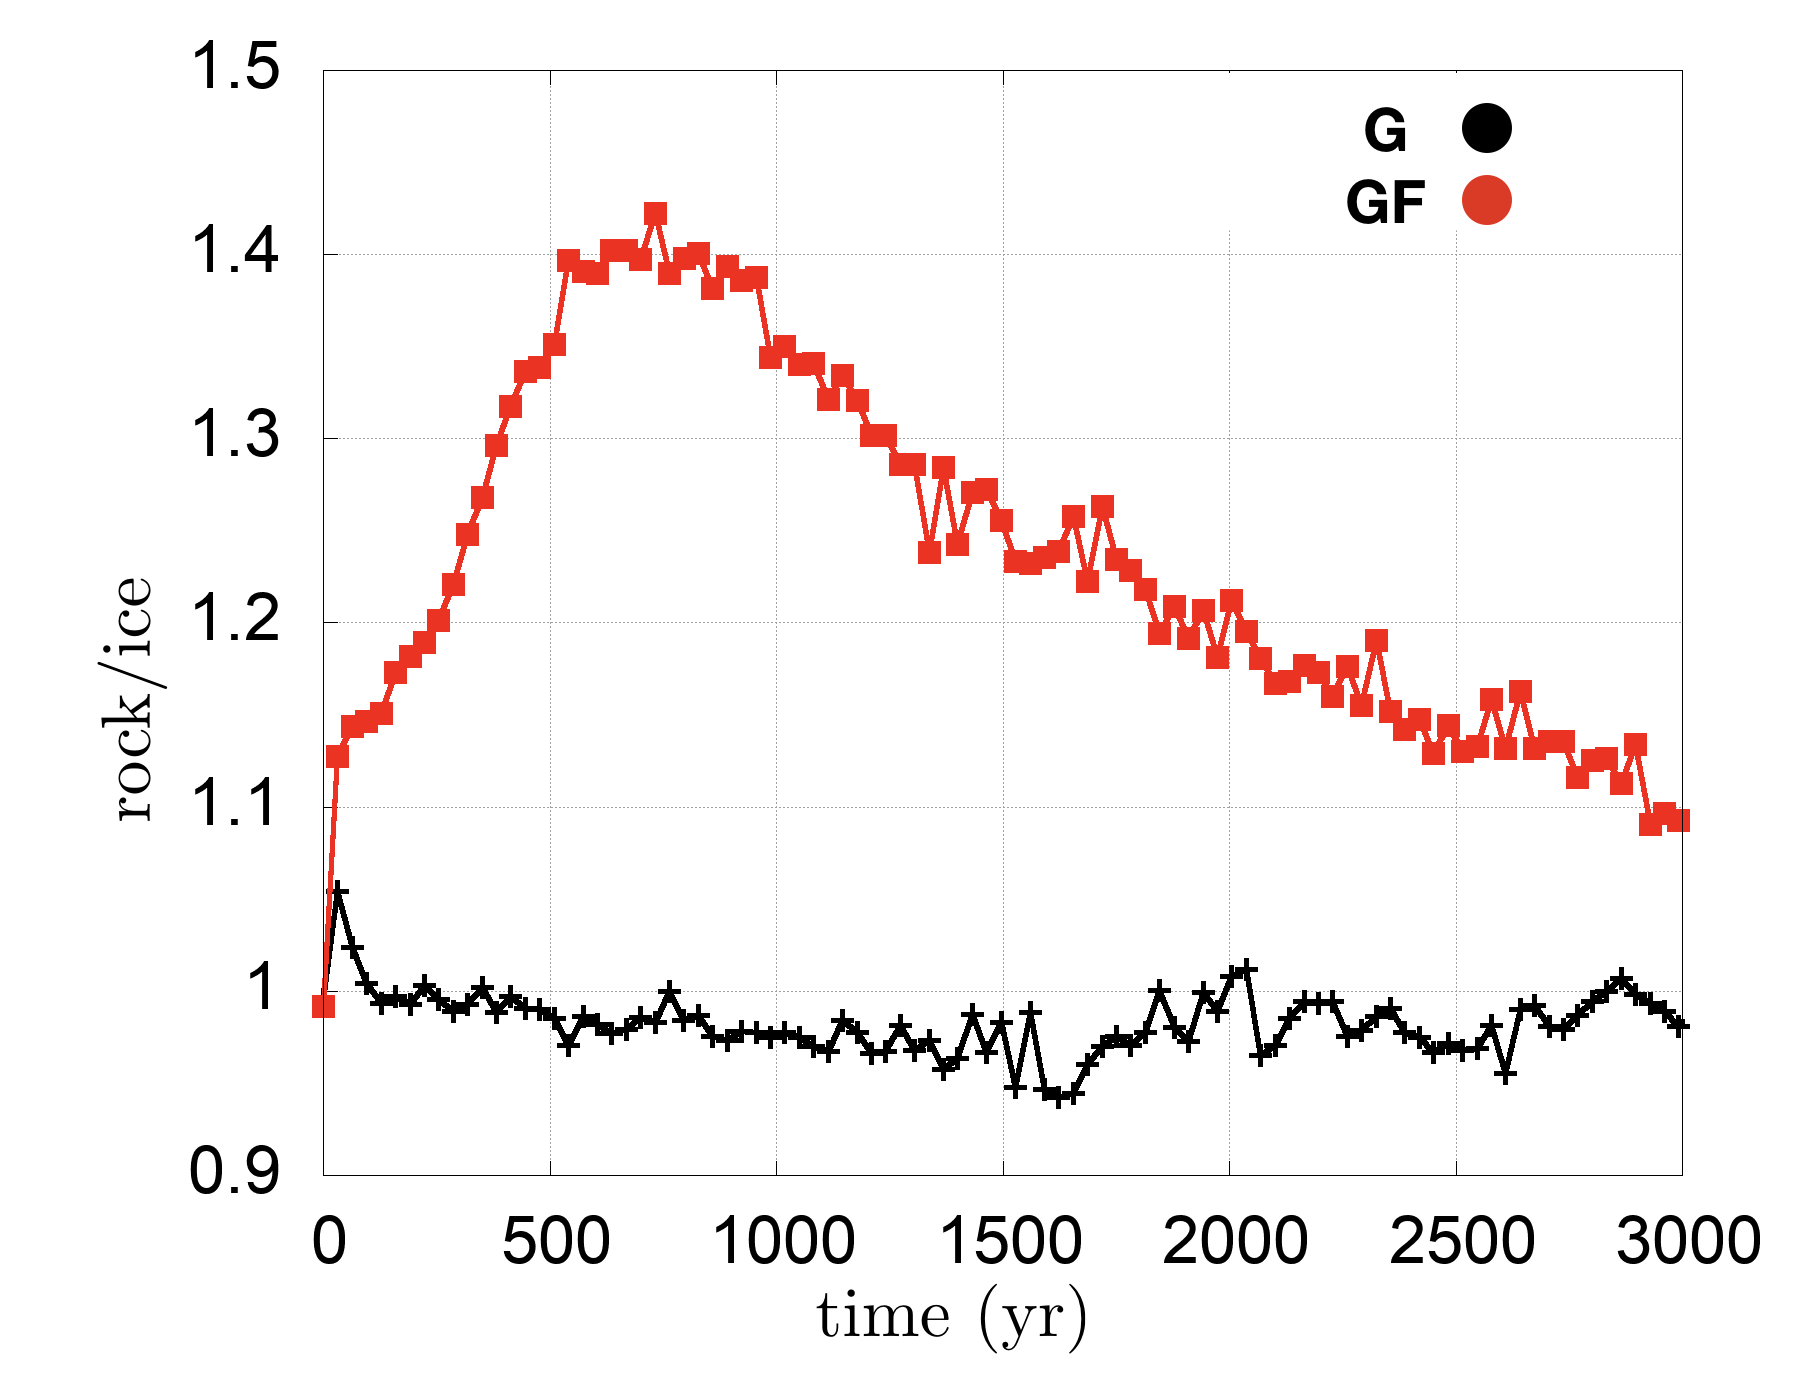
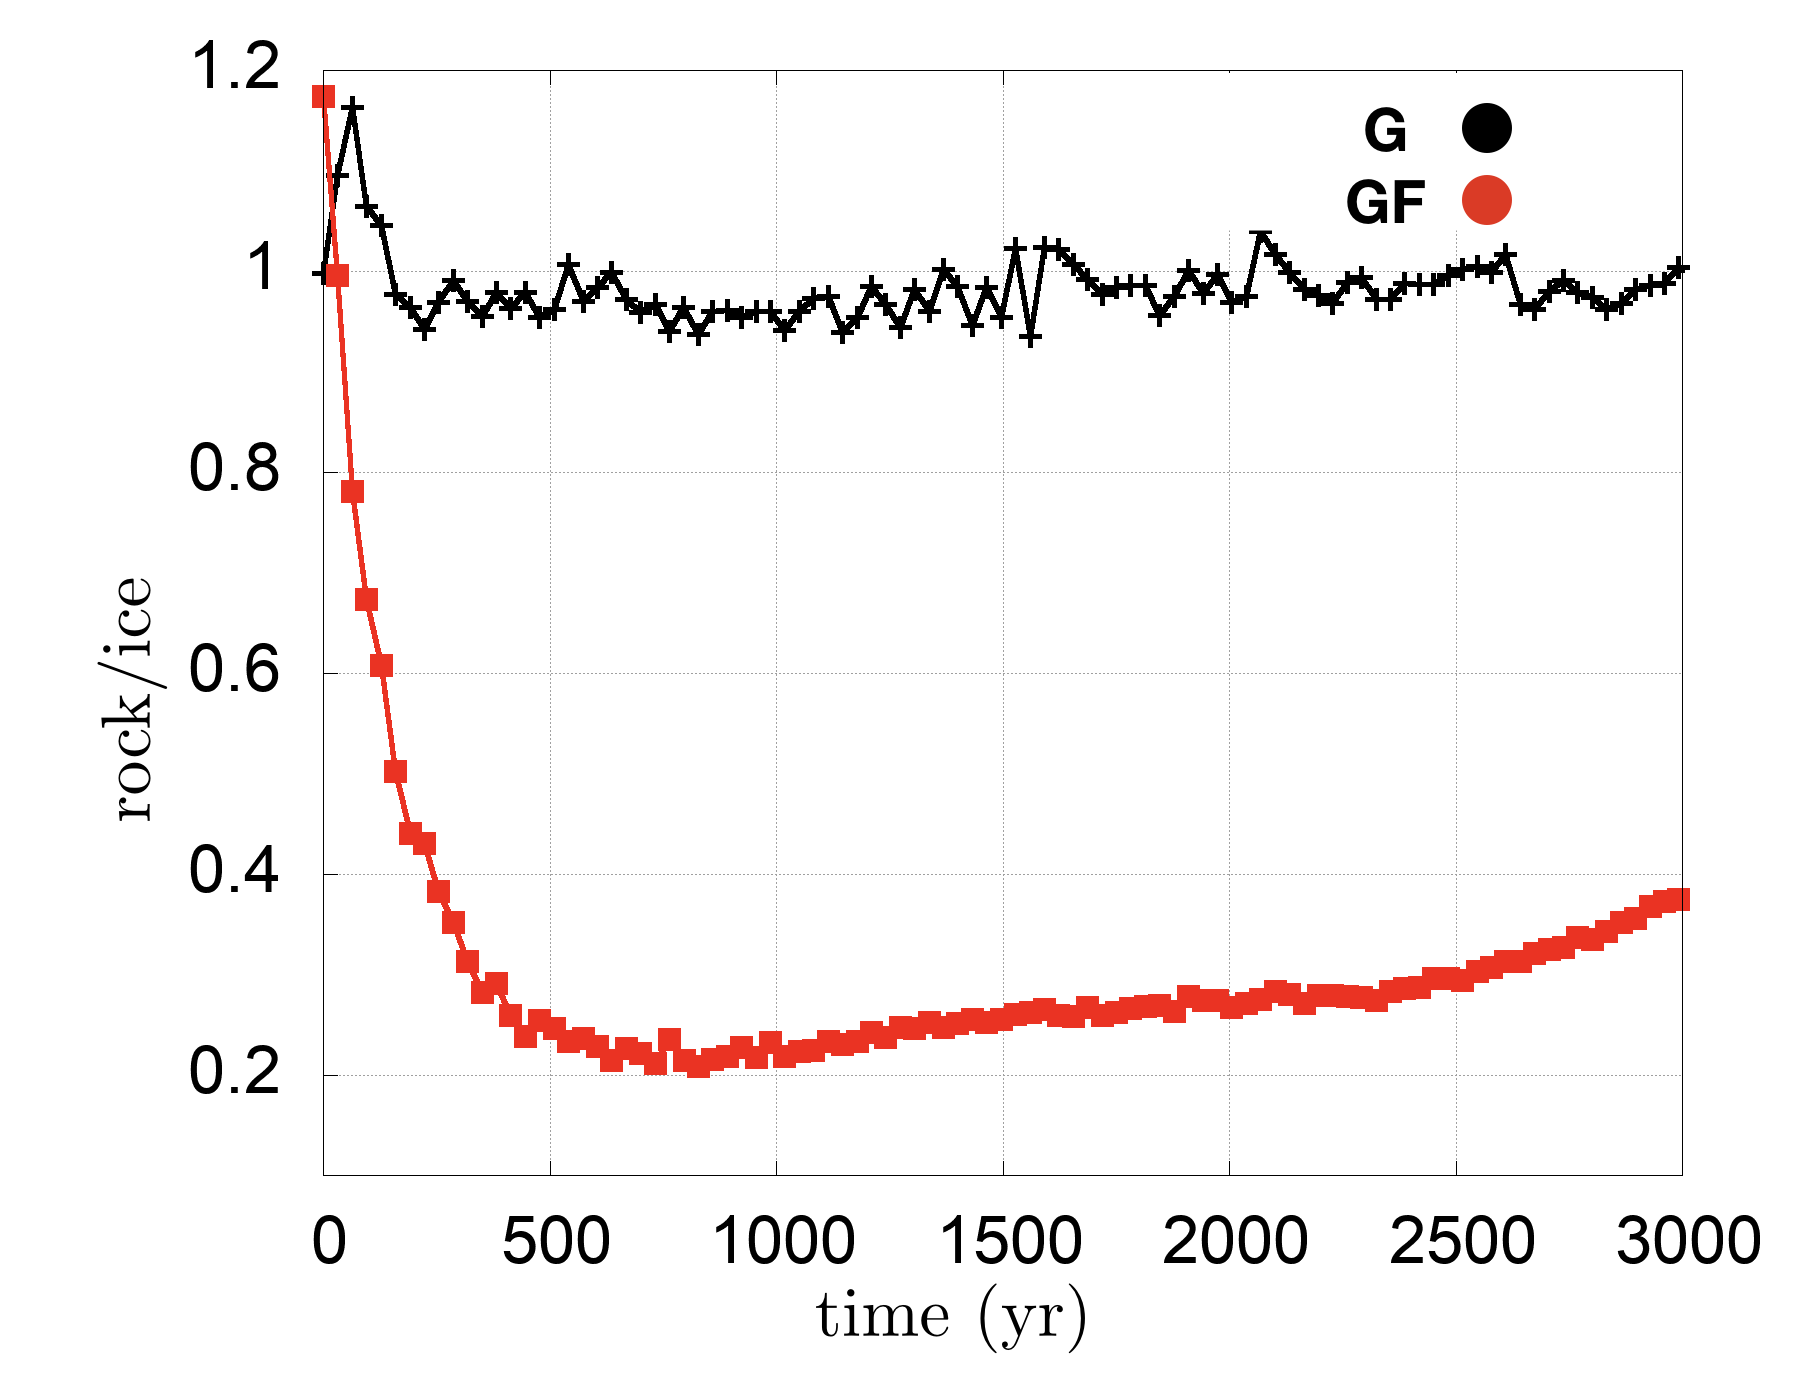
In Fig.7, left column, we report the Fe/Si (top) and rock/ice (bottom) ratios for the inner disc surface () and ). Similarly to Paper I, these ratios are the ratios between the number of particles of a given species (Fe, Si, rock=(Fe+Si), ) which are populating a given region at a given time. For example, the Fe/Si ratio is . All values are then normalized to the initial values at the time of injection, called from here on “solar”, and reported in Table 1. Similarly to the case of pure growth, GF fractionates the disc surface in its iron content, with respect to the initial solar value. It is interesting to note that in the GF case, the slope of the Fe/Si ratio is steeper. On the other hand, the rock/ice ratio shows an opposite behaviour when G and GF are compared. While for G it goes from “solar” to “sub-solar” values, showing faster depletion of rocky particles, in GF we see an abrupt decrease of ice particles with the rock/ice ratio reaching 1.4 times the “solar” value before decreasing smoothly after yr.
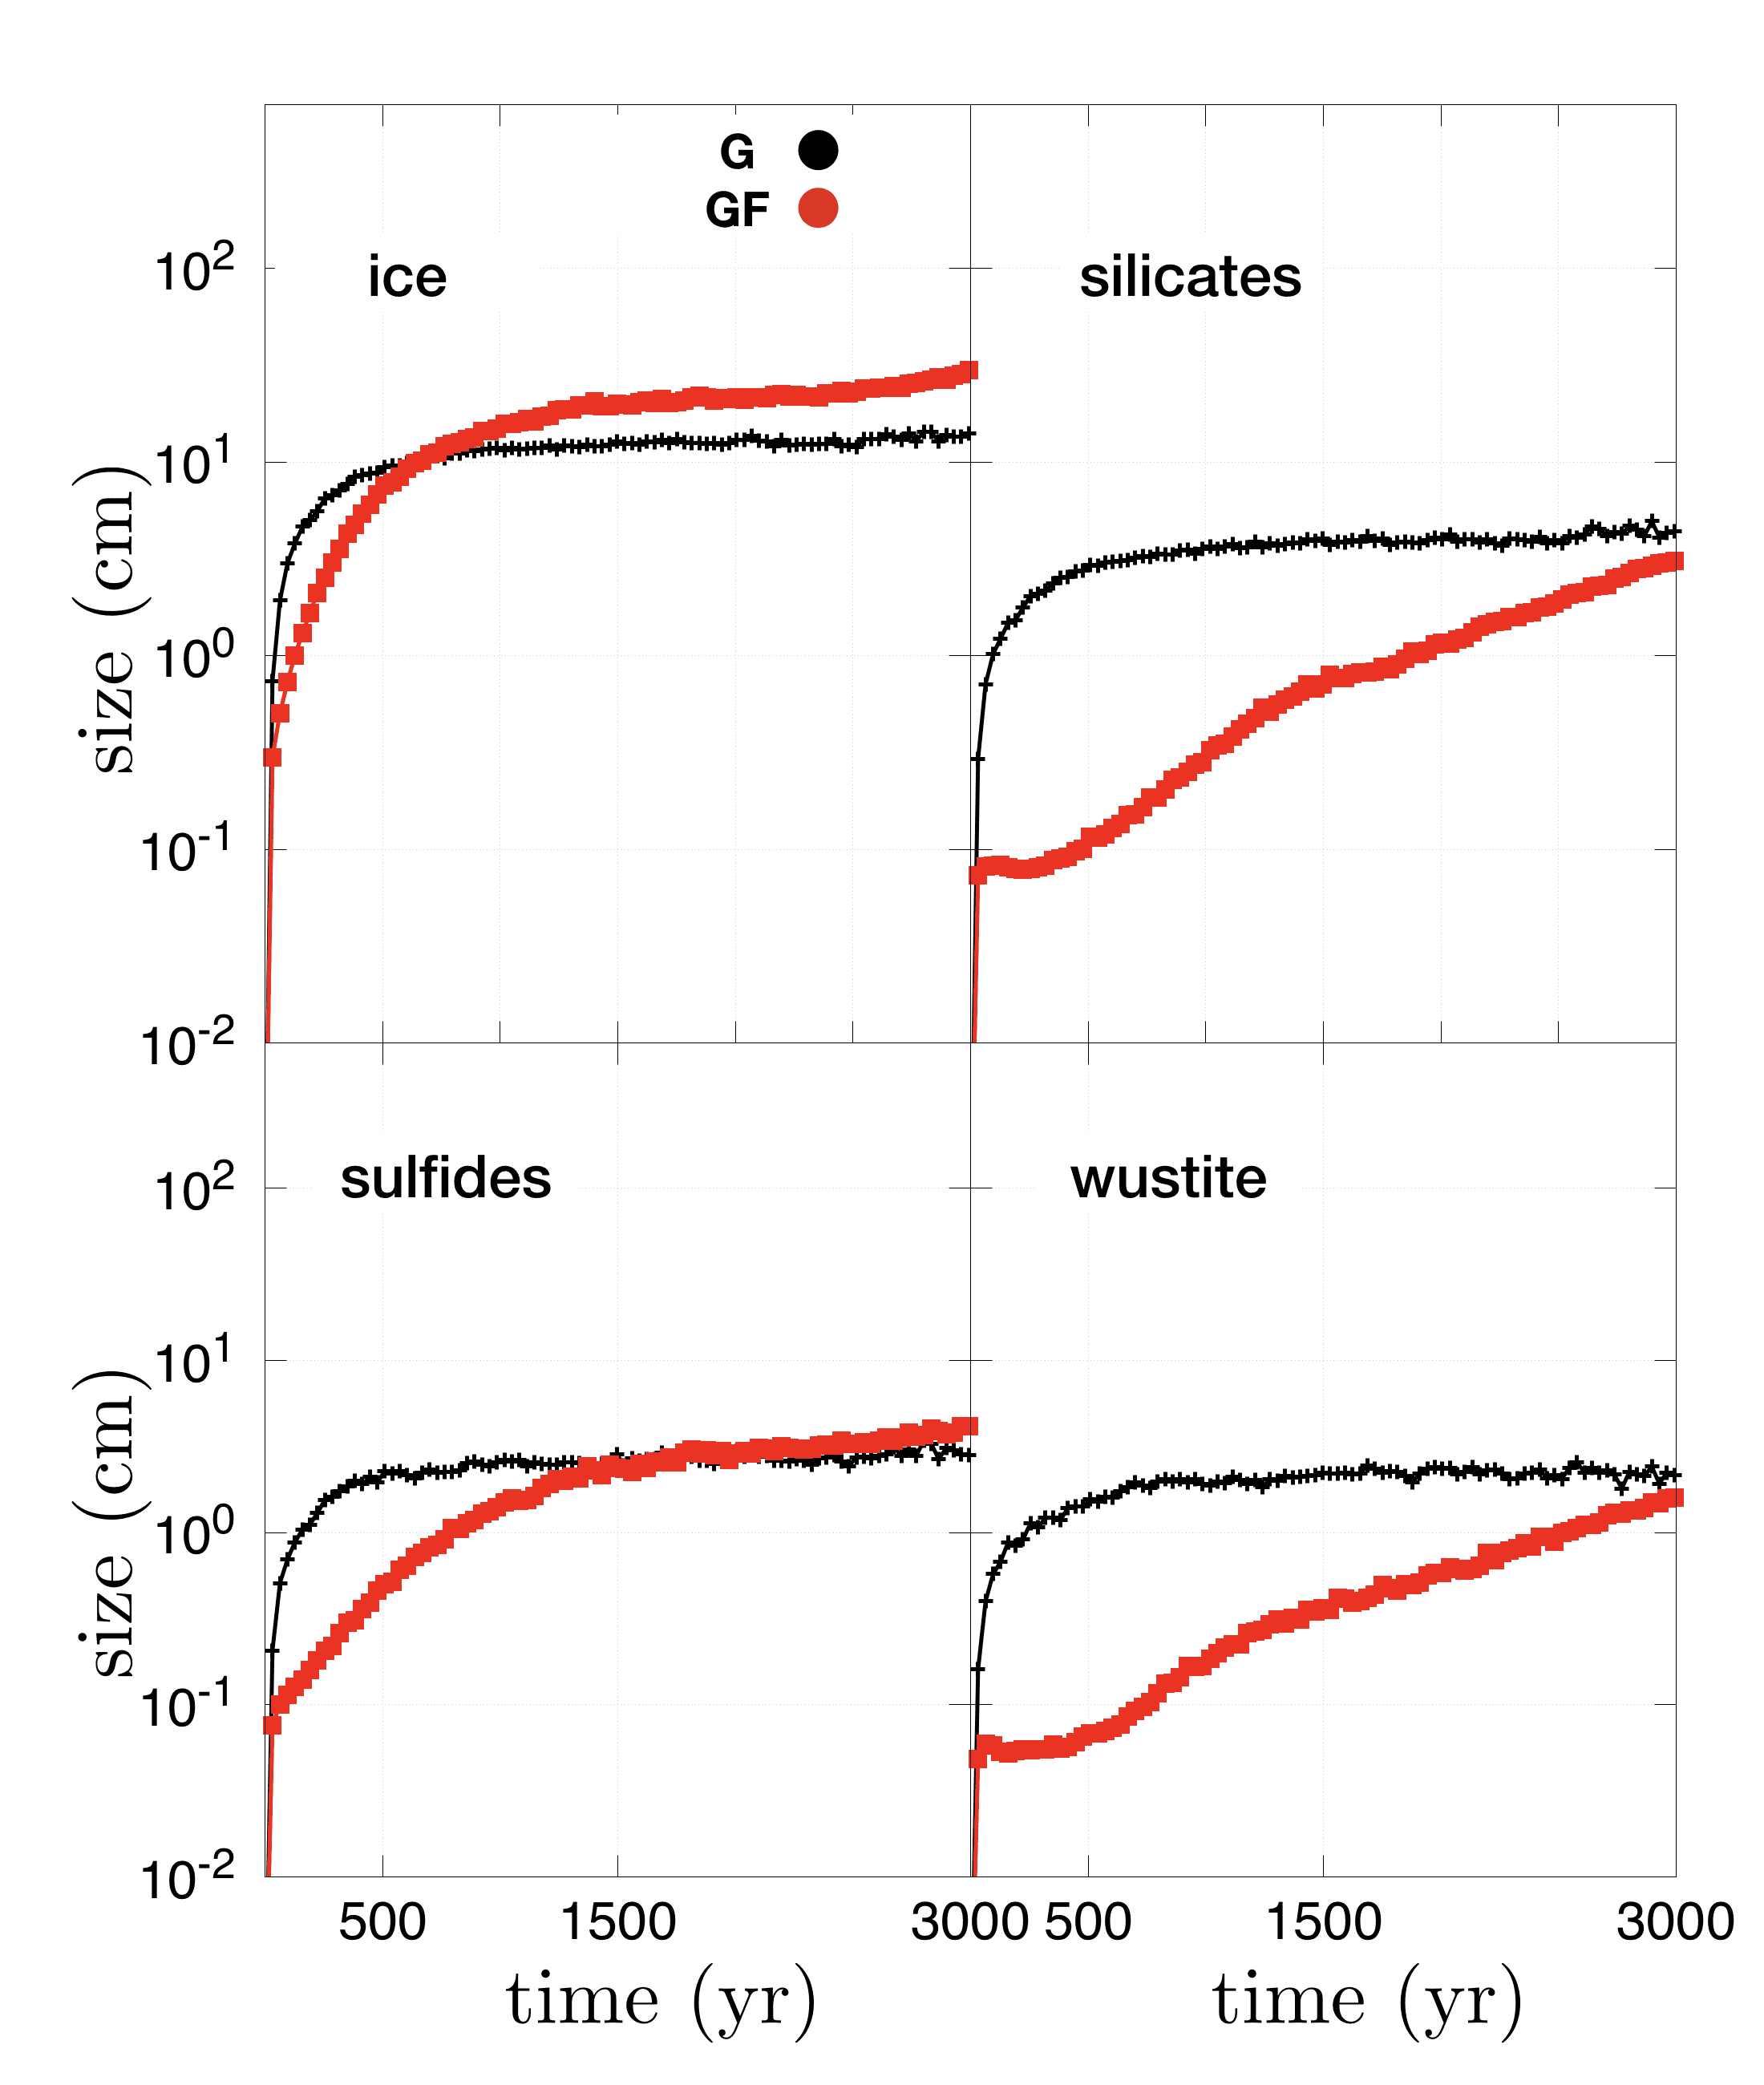
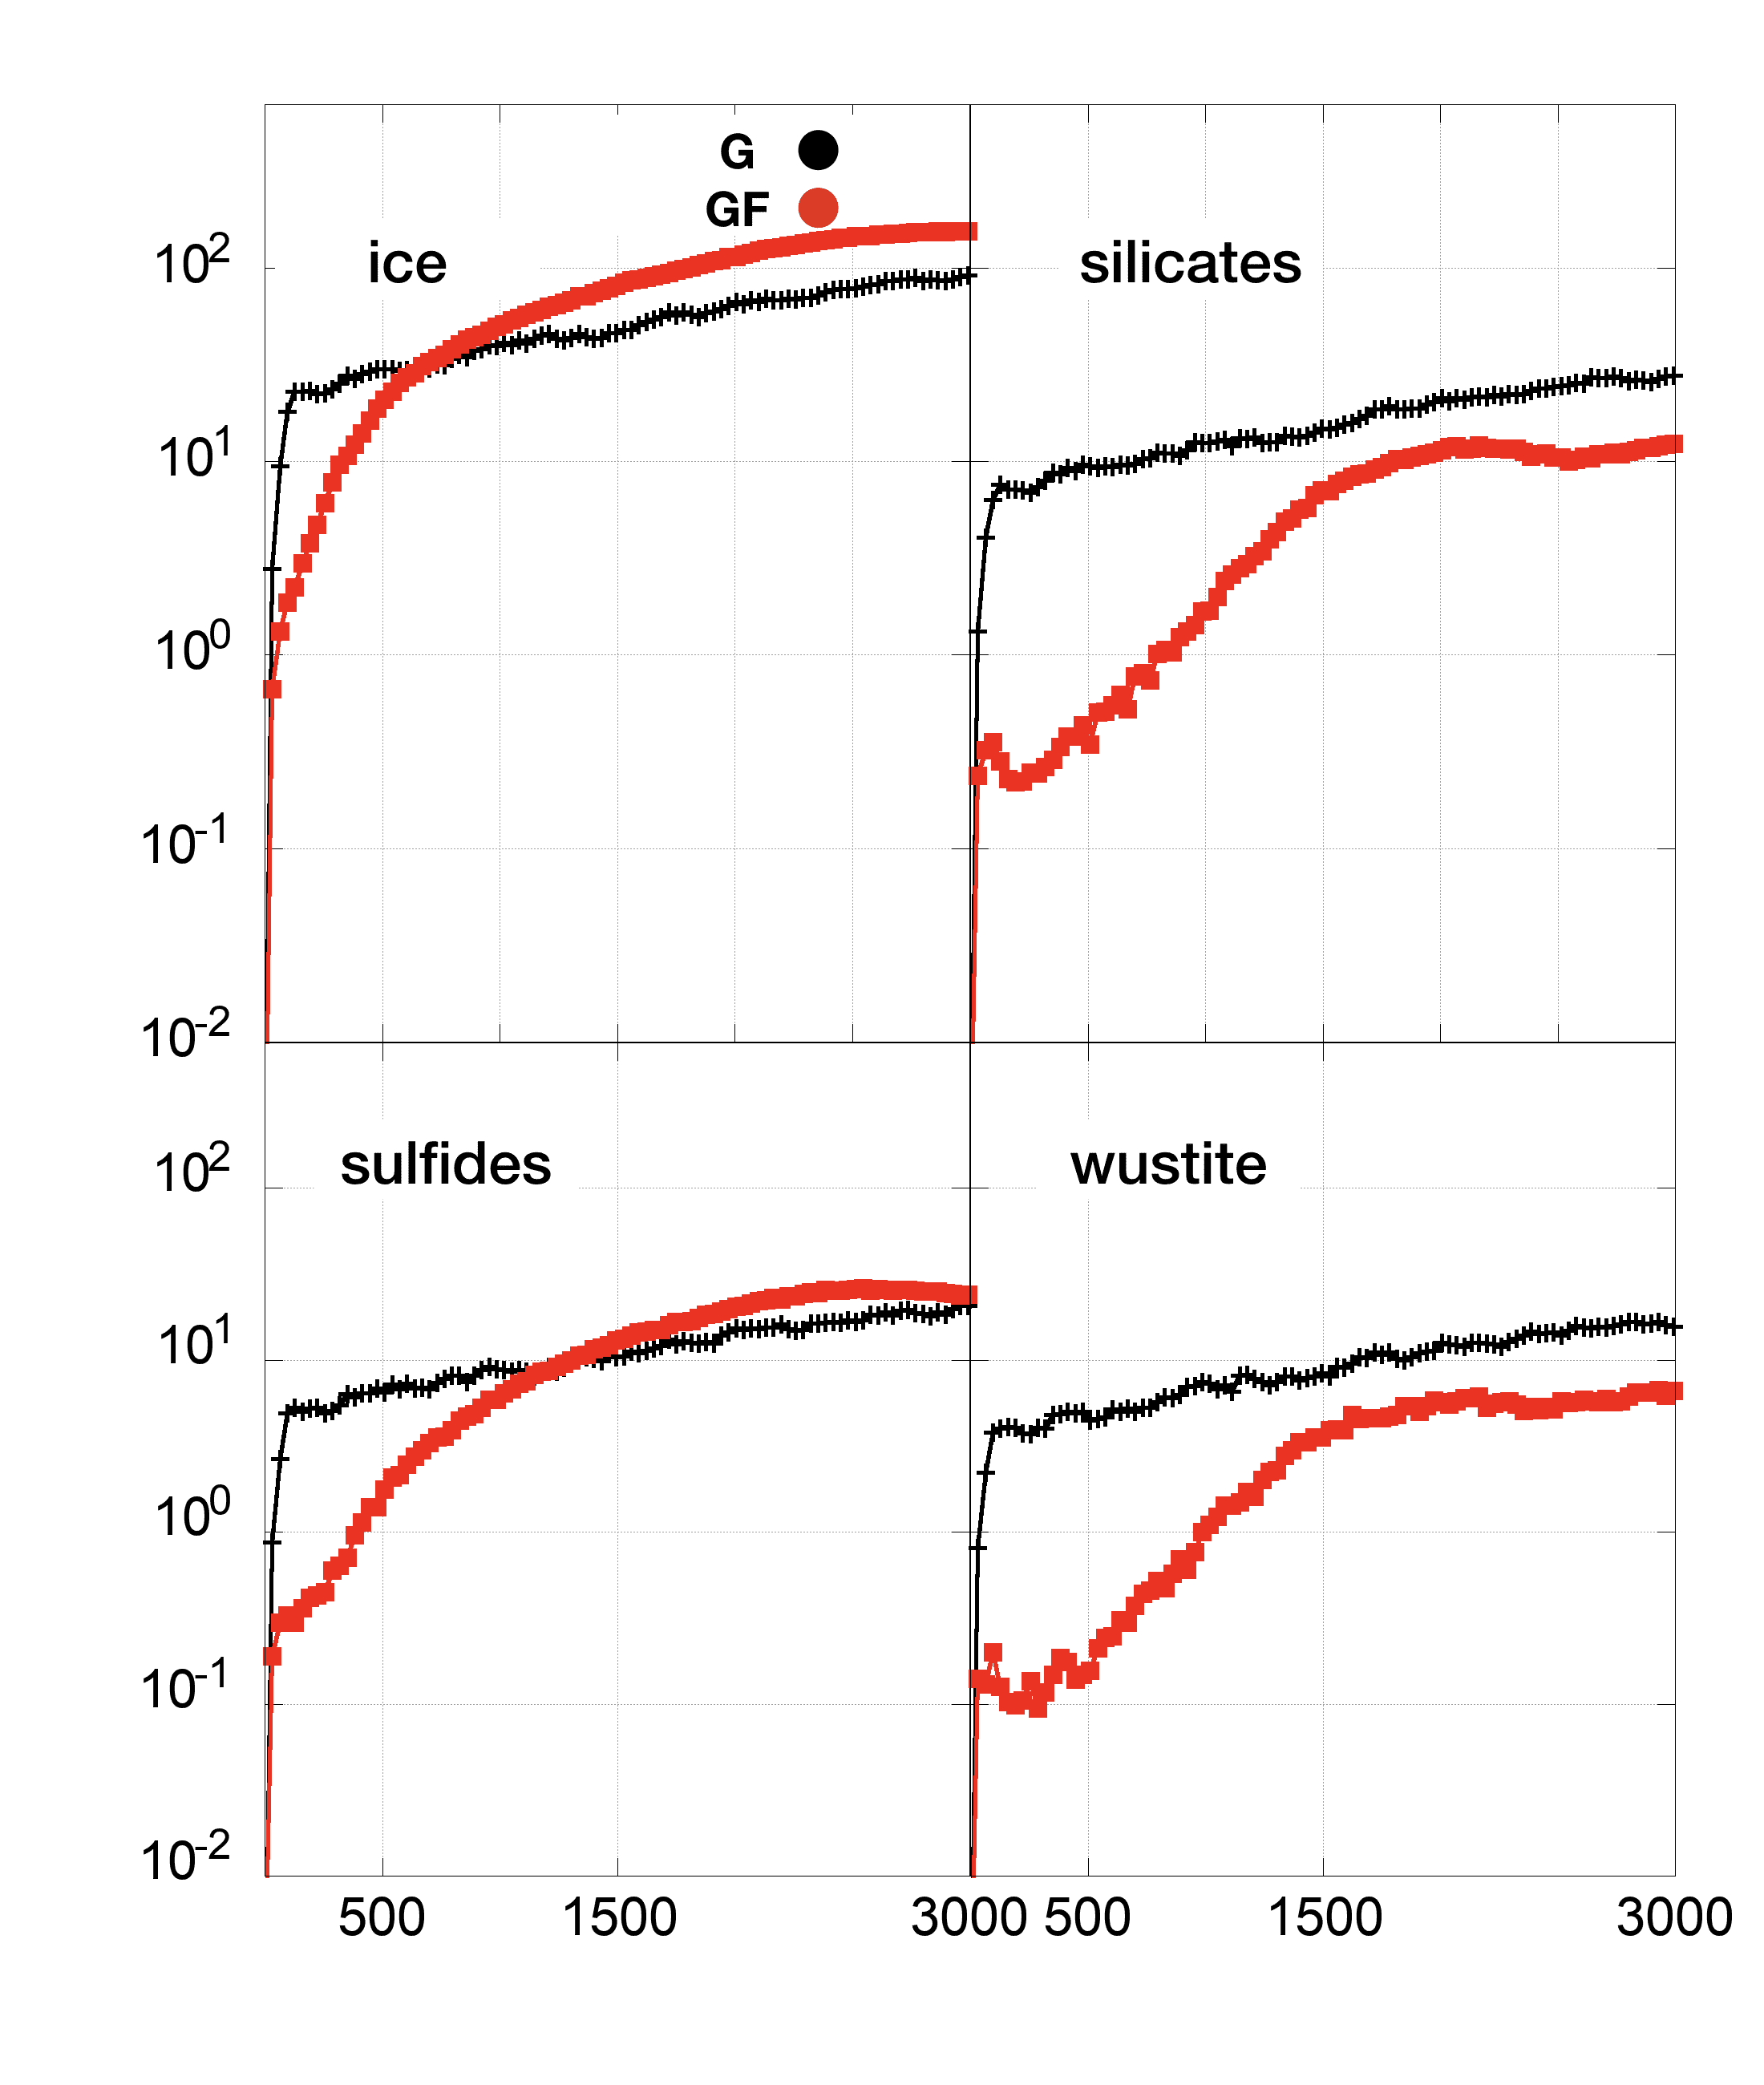
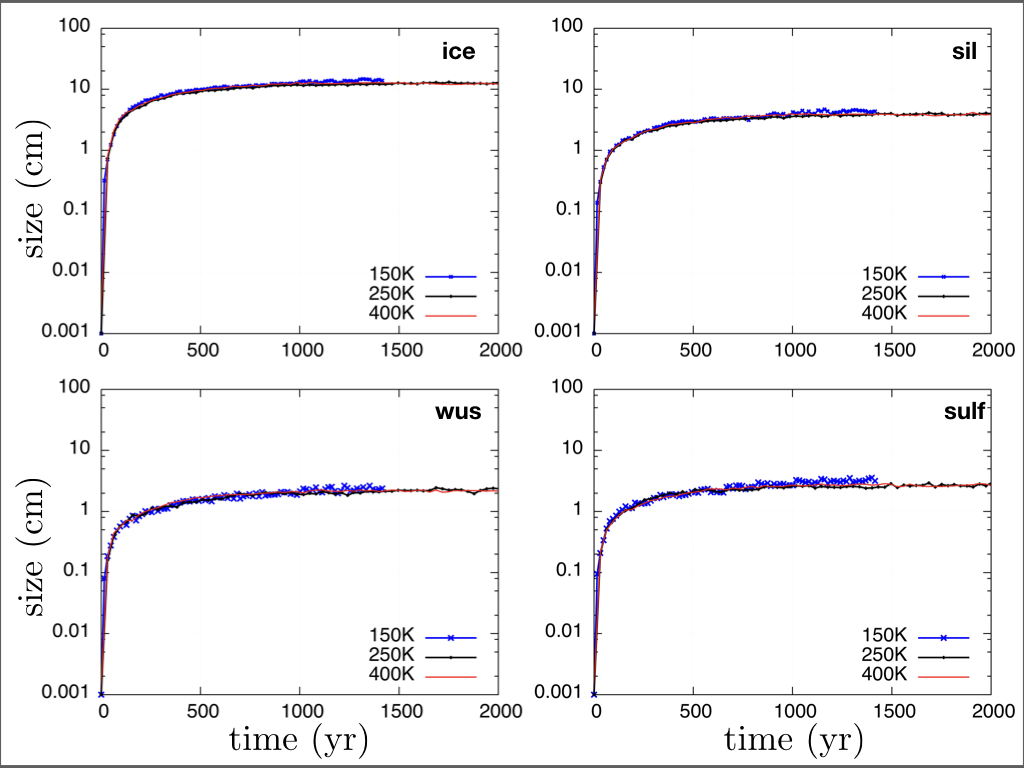
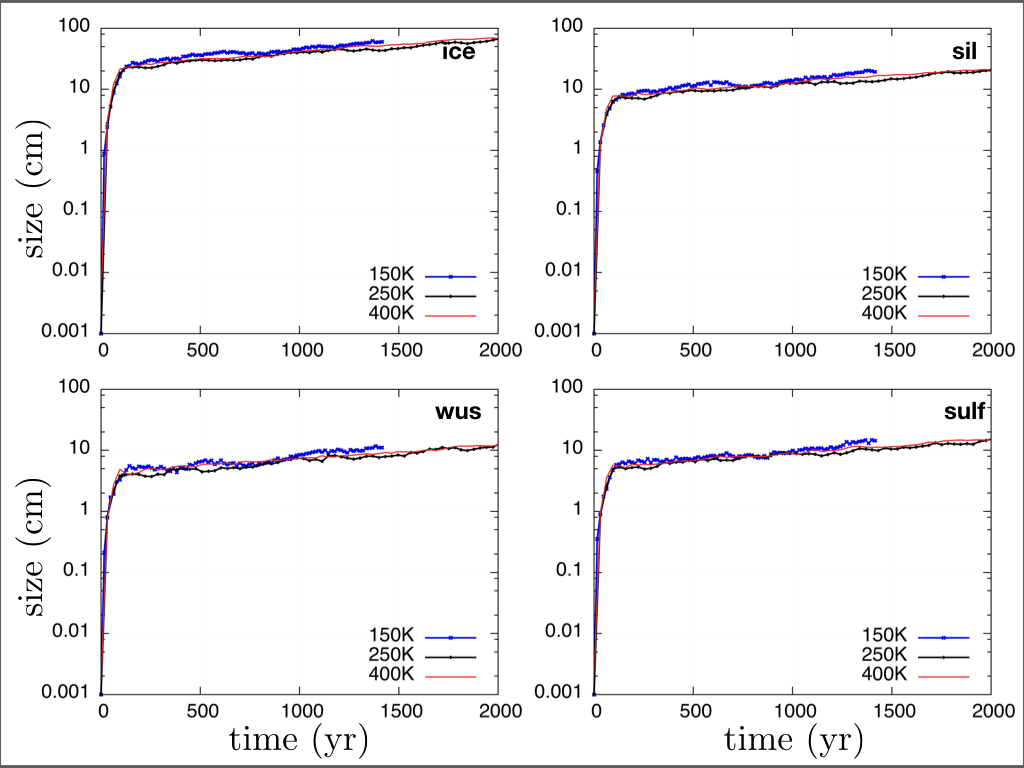
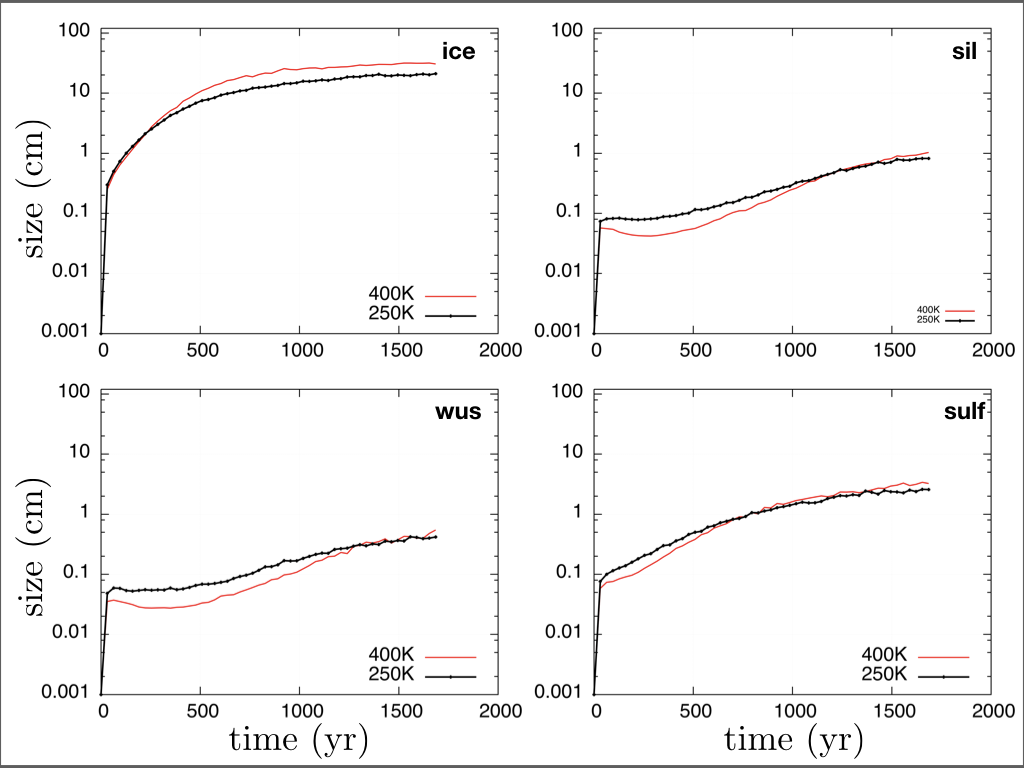
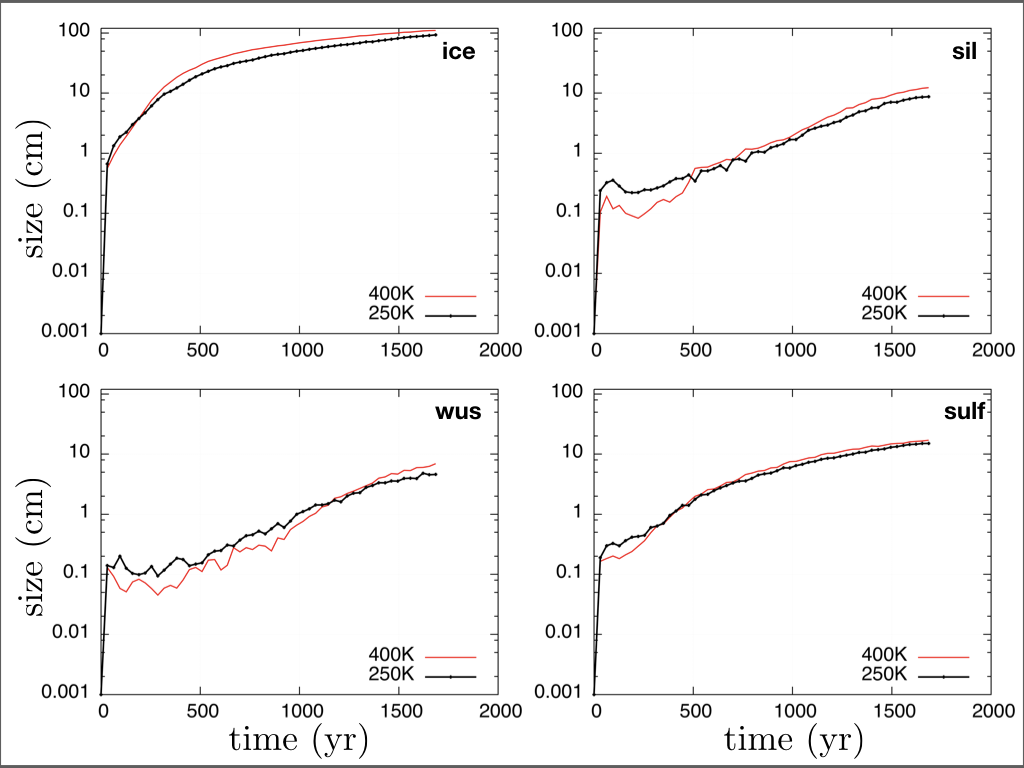
In Fig. 8, left box, we plot the time evolution of the average size of each species in the disc surface in the G and GF cases. In the G case grains grow rapidly to reach cm-dm size within a few hundreds years, while, as expected, GF results in a slower growth rate. However, it is interesting to note that, after yr for ice, and yr for sulfides, grains start to grow larger than in the G case. For silicate and wustite particles, the growth rate is slower for all the considered evolutionary time, with the average size closer to the values predicted by pure growth only after yr.
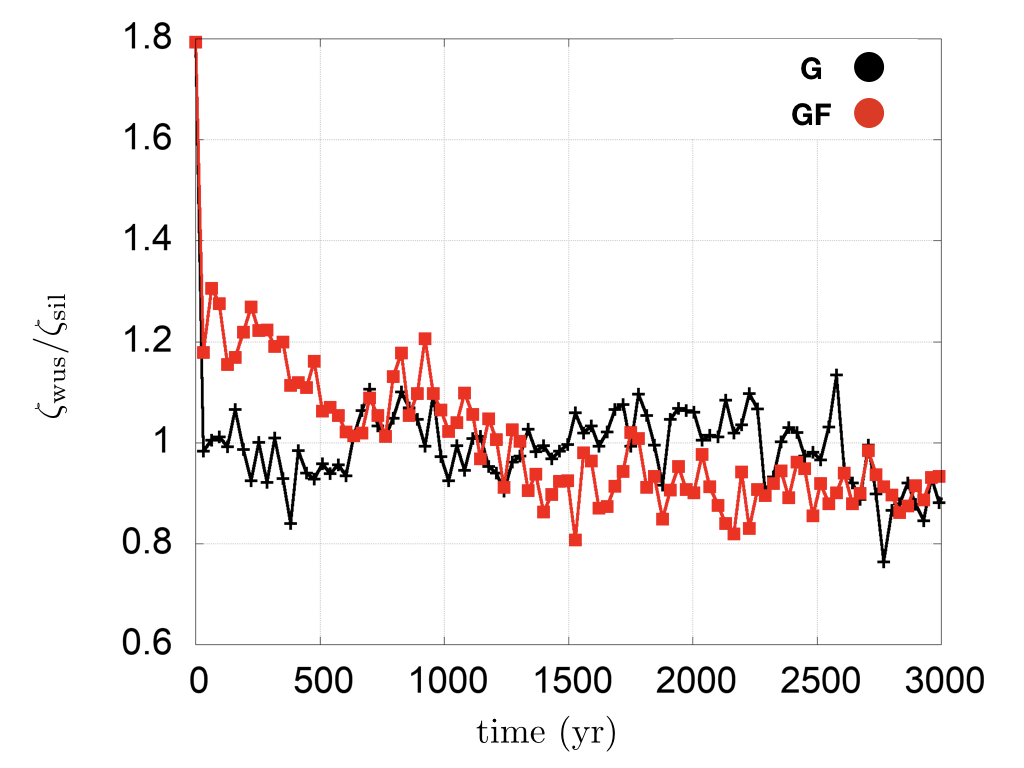
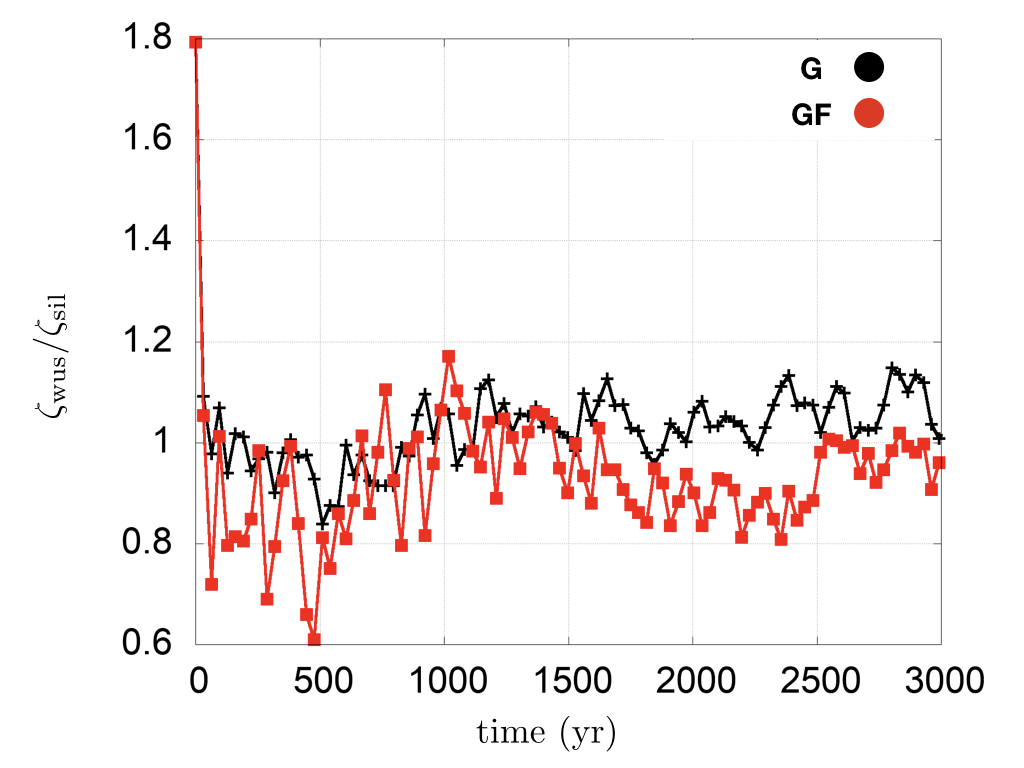
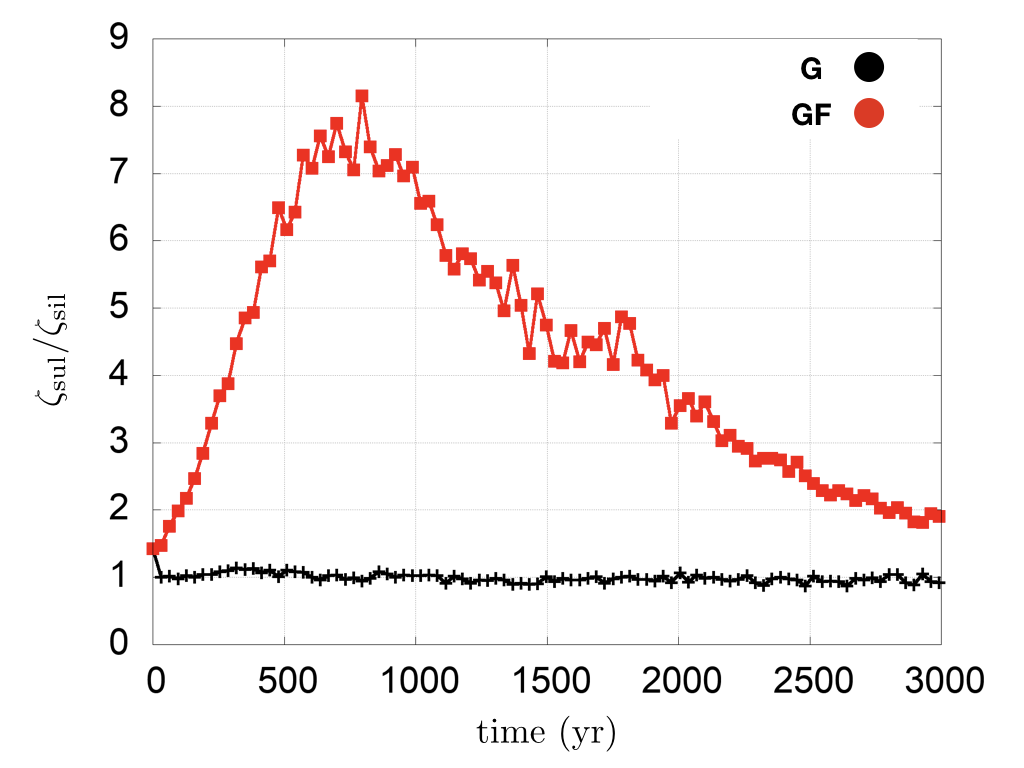
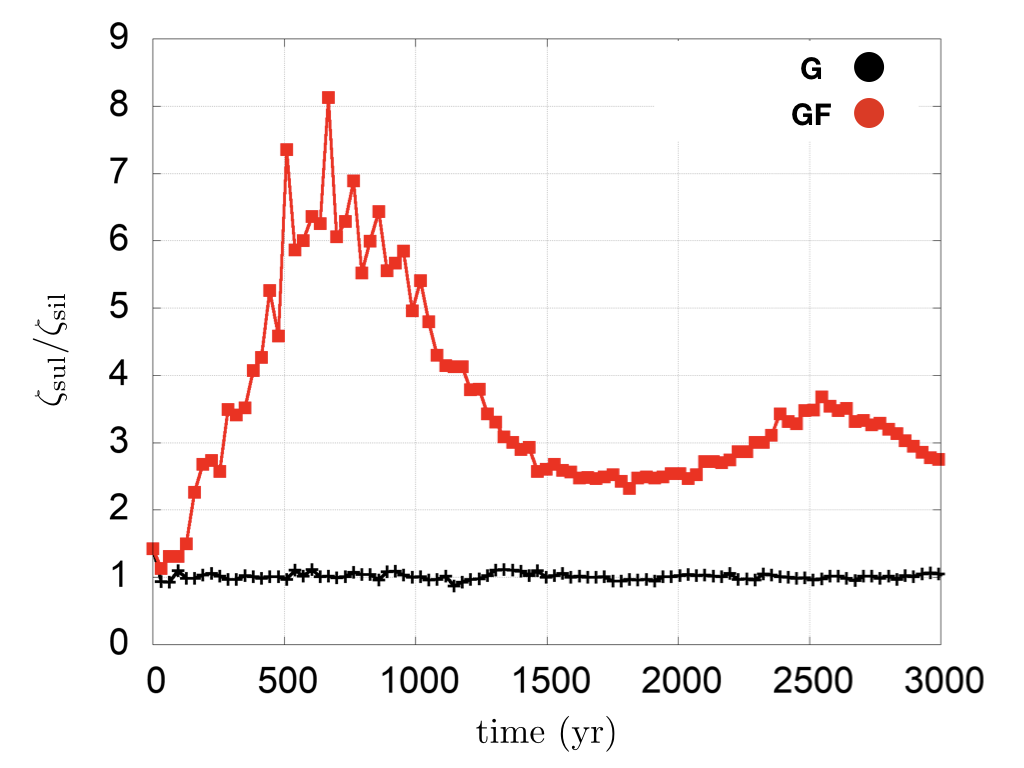
In Fig. 9, left column, we now focus on the single dust species and report the ratios between the averaged aerodynamic parameters, , of wustite and silicates, (top) and sulfides and silicates, (bottom). We see that the ratio returns a similar trend when G and GF are considered. The wustite and silicates particles tend to become size-density sorted, (), almost immediately in the case of pure growth and after yr in the case of fragmentation. The case of is different: in the G simulation the size-density sorting is evident, while GF initially “unsorts” particles for yr before moving them toward a size-density sorting.
3.3 Disc midplane and radial drift
In this section we discuss the the inner disc midplane where and .
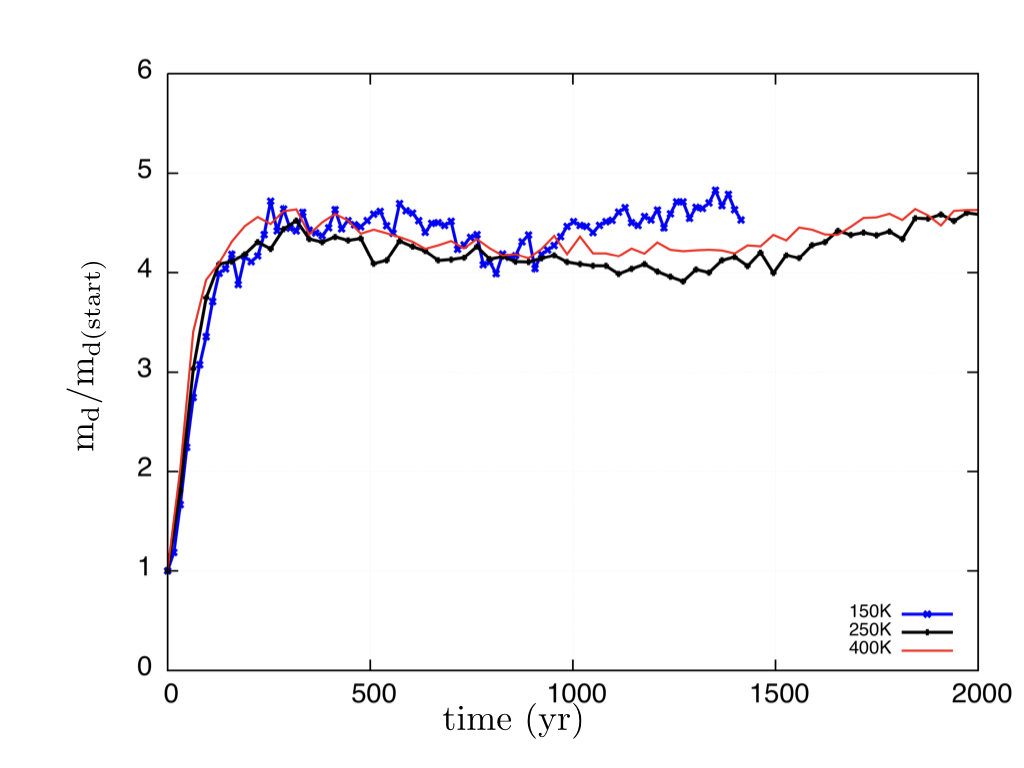
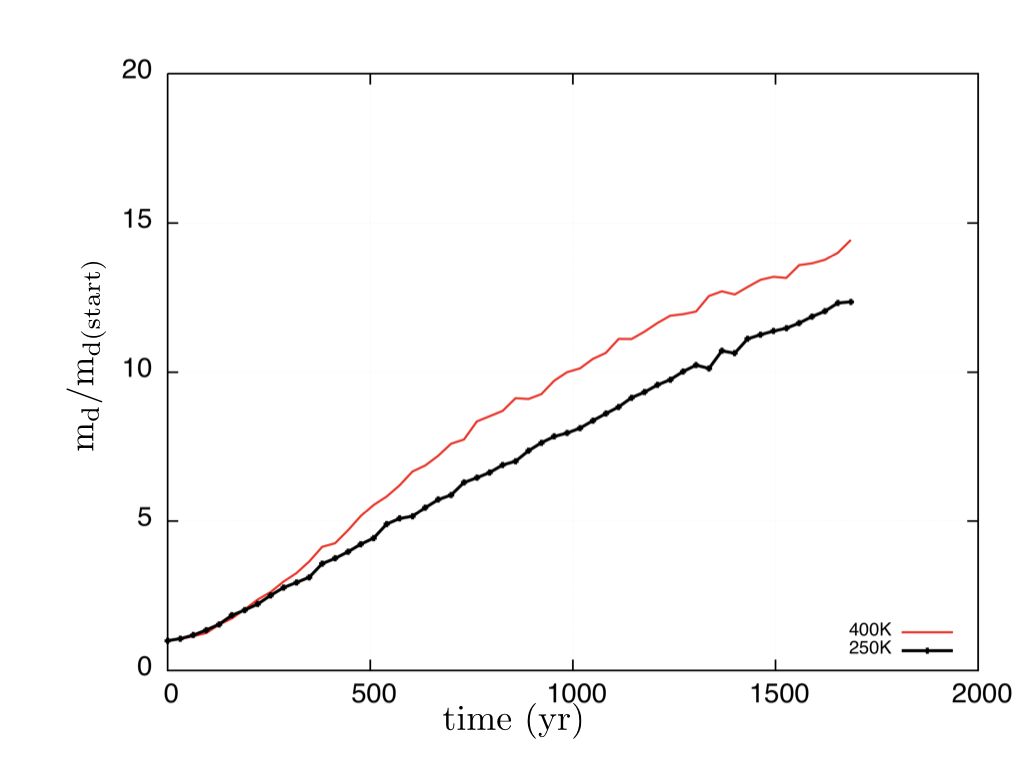
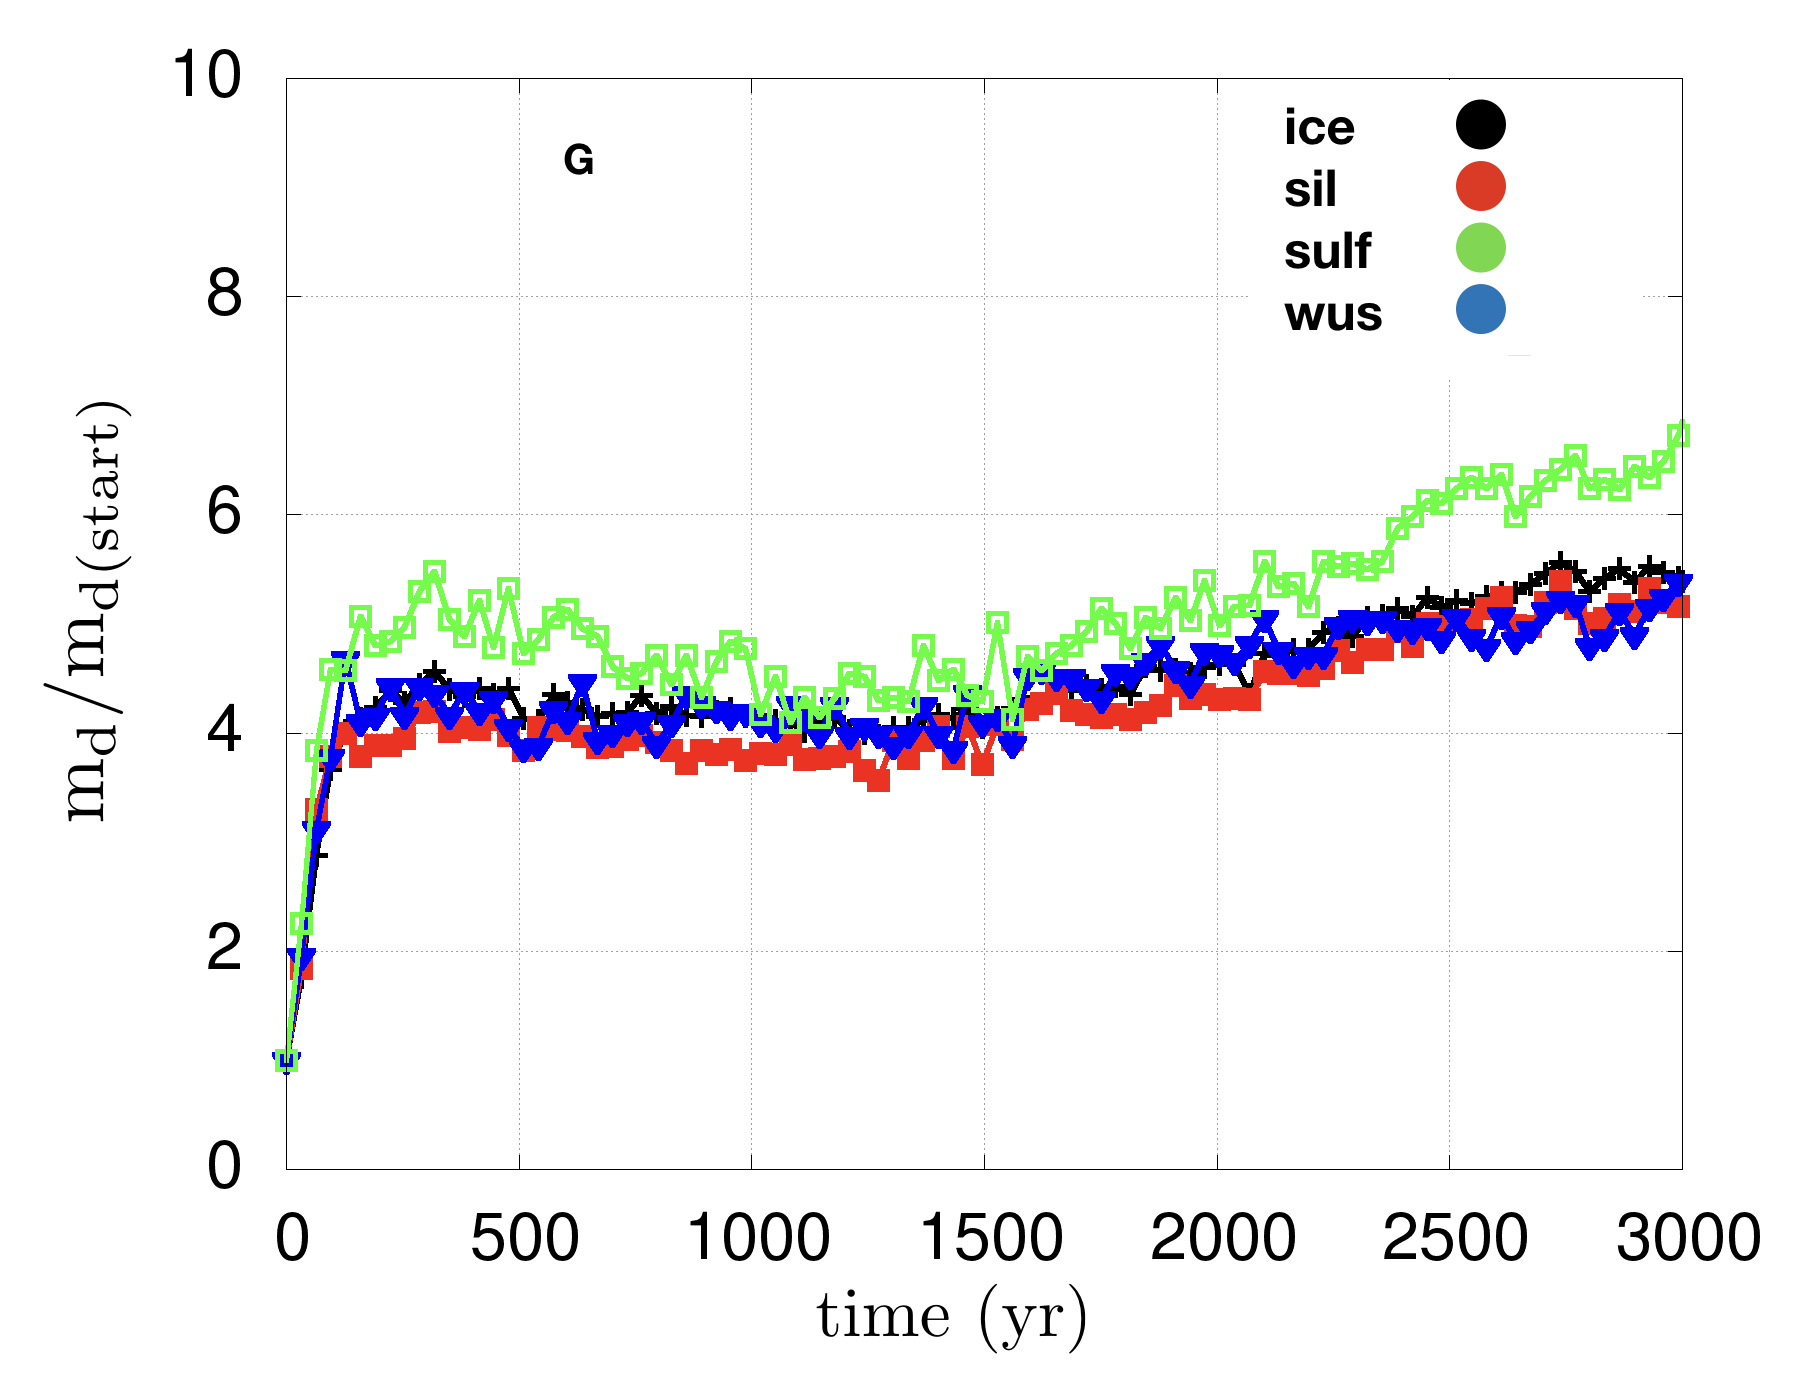
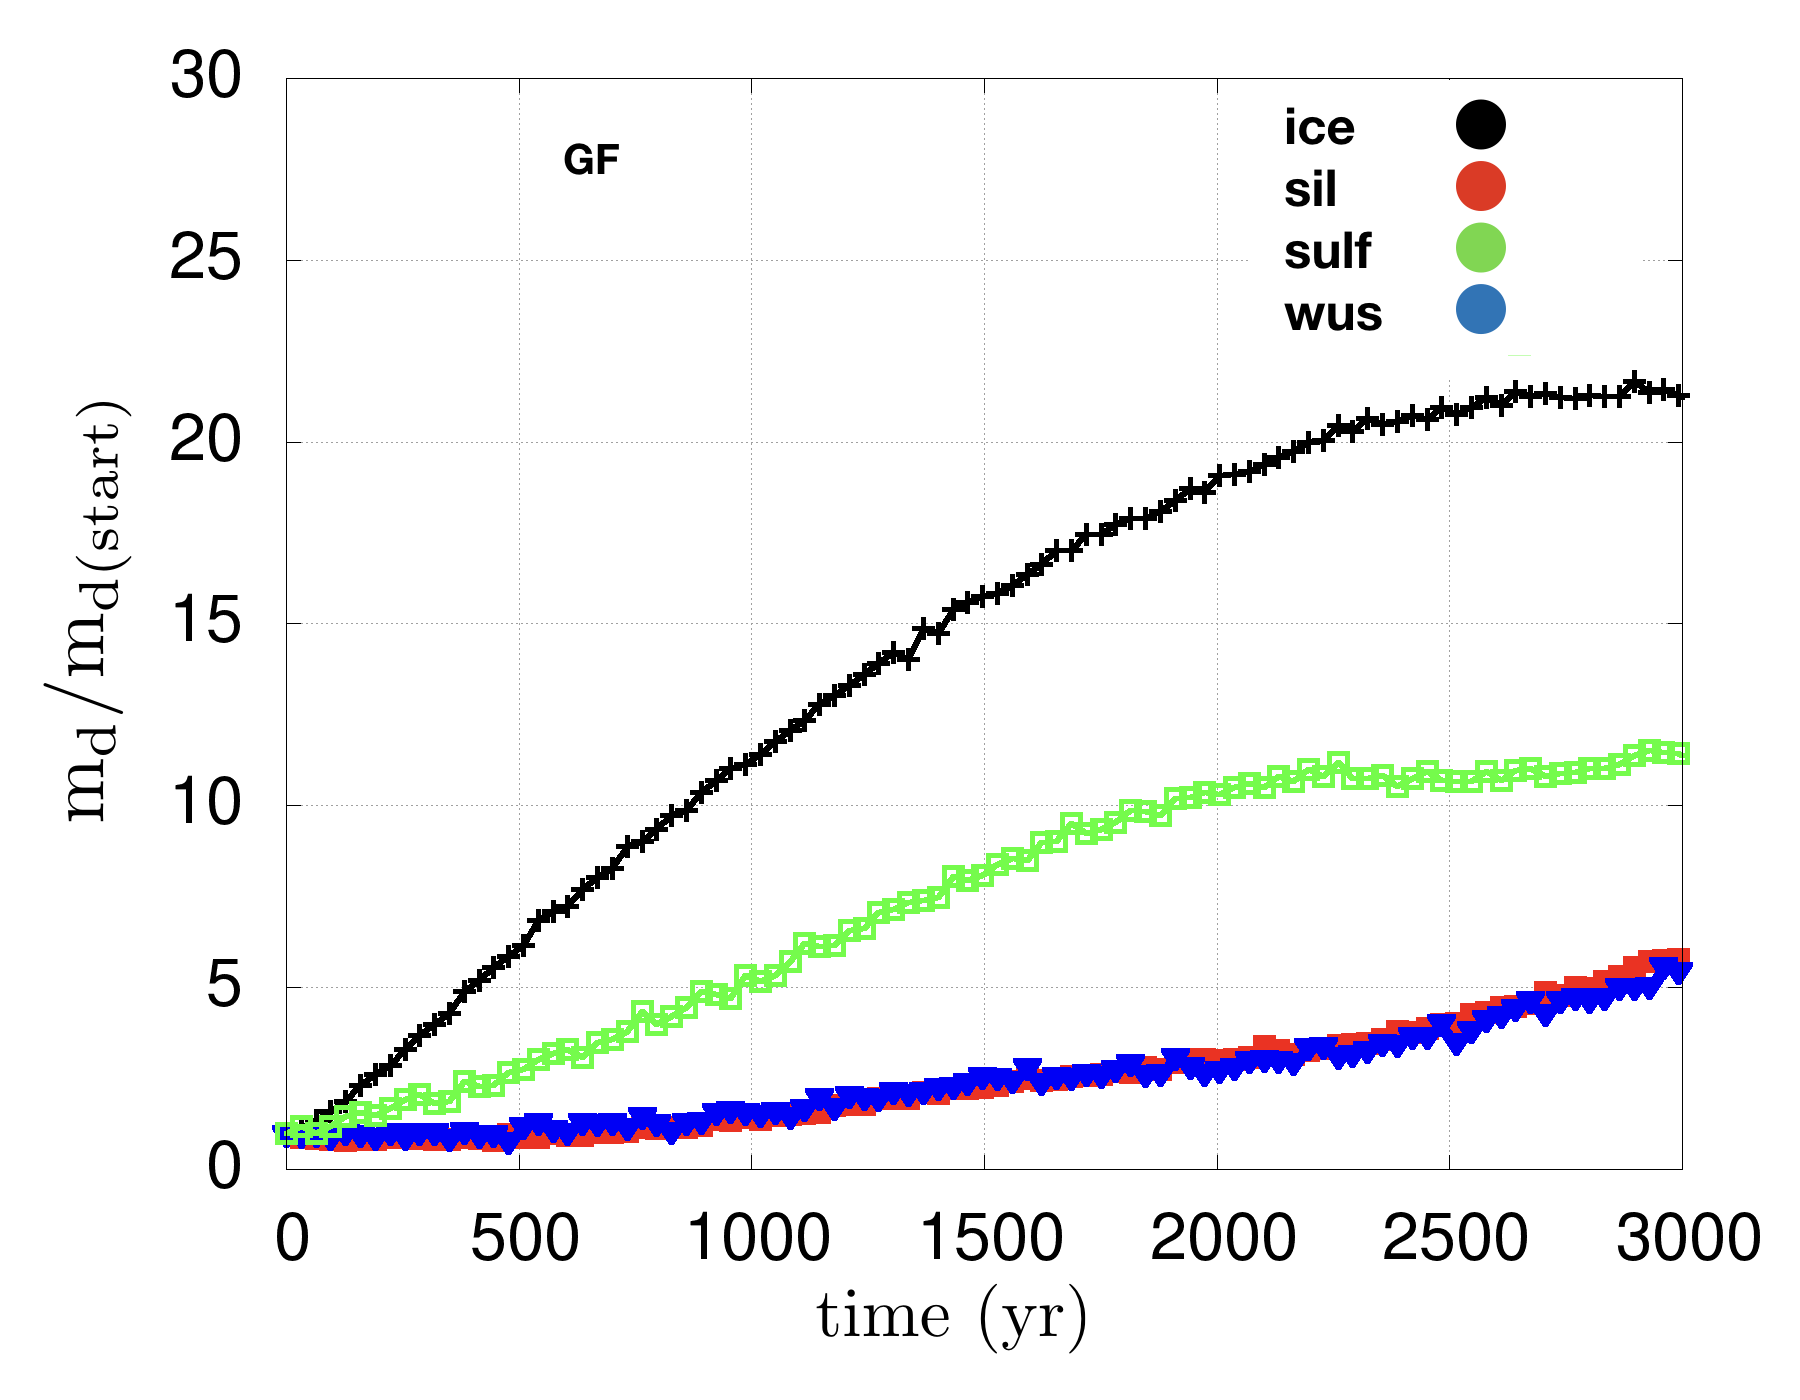
In Fig. 6, right column, we report the time evolution of the total dust mass content compared to the initial mass present in the disc midplane in the G and GF cases (top), and for single species in G (middle), and GF (bottom). We see that in G, after an initial increase, the ratio remains constant around a value of before increasing slowly after yr. In GF, within the first yr, the ratio increases slower when compared with G. However, it keeps increasing with values reaching 15 times the initial mass. When the behaviour of the single species is taken into account we see that, in G, species behave similarly: a first increment due to the vertical settling, and a second increment ( yr) due to the radial drift of the particles from the outer disc ( au) which is becoming more efficient (see also Paper I). In GF, there is a dramatic increase of the mass of ice and sulfides, while the increase of the mass of other species is characterized by a lower rate, more similar to G.
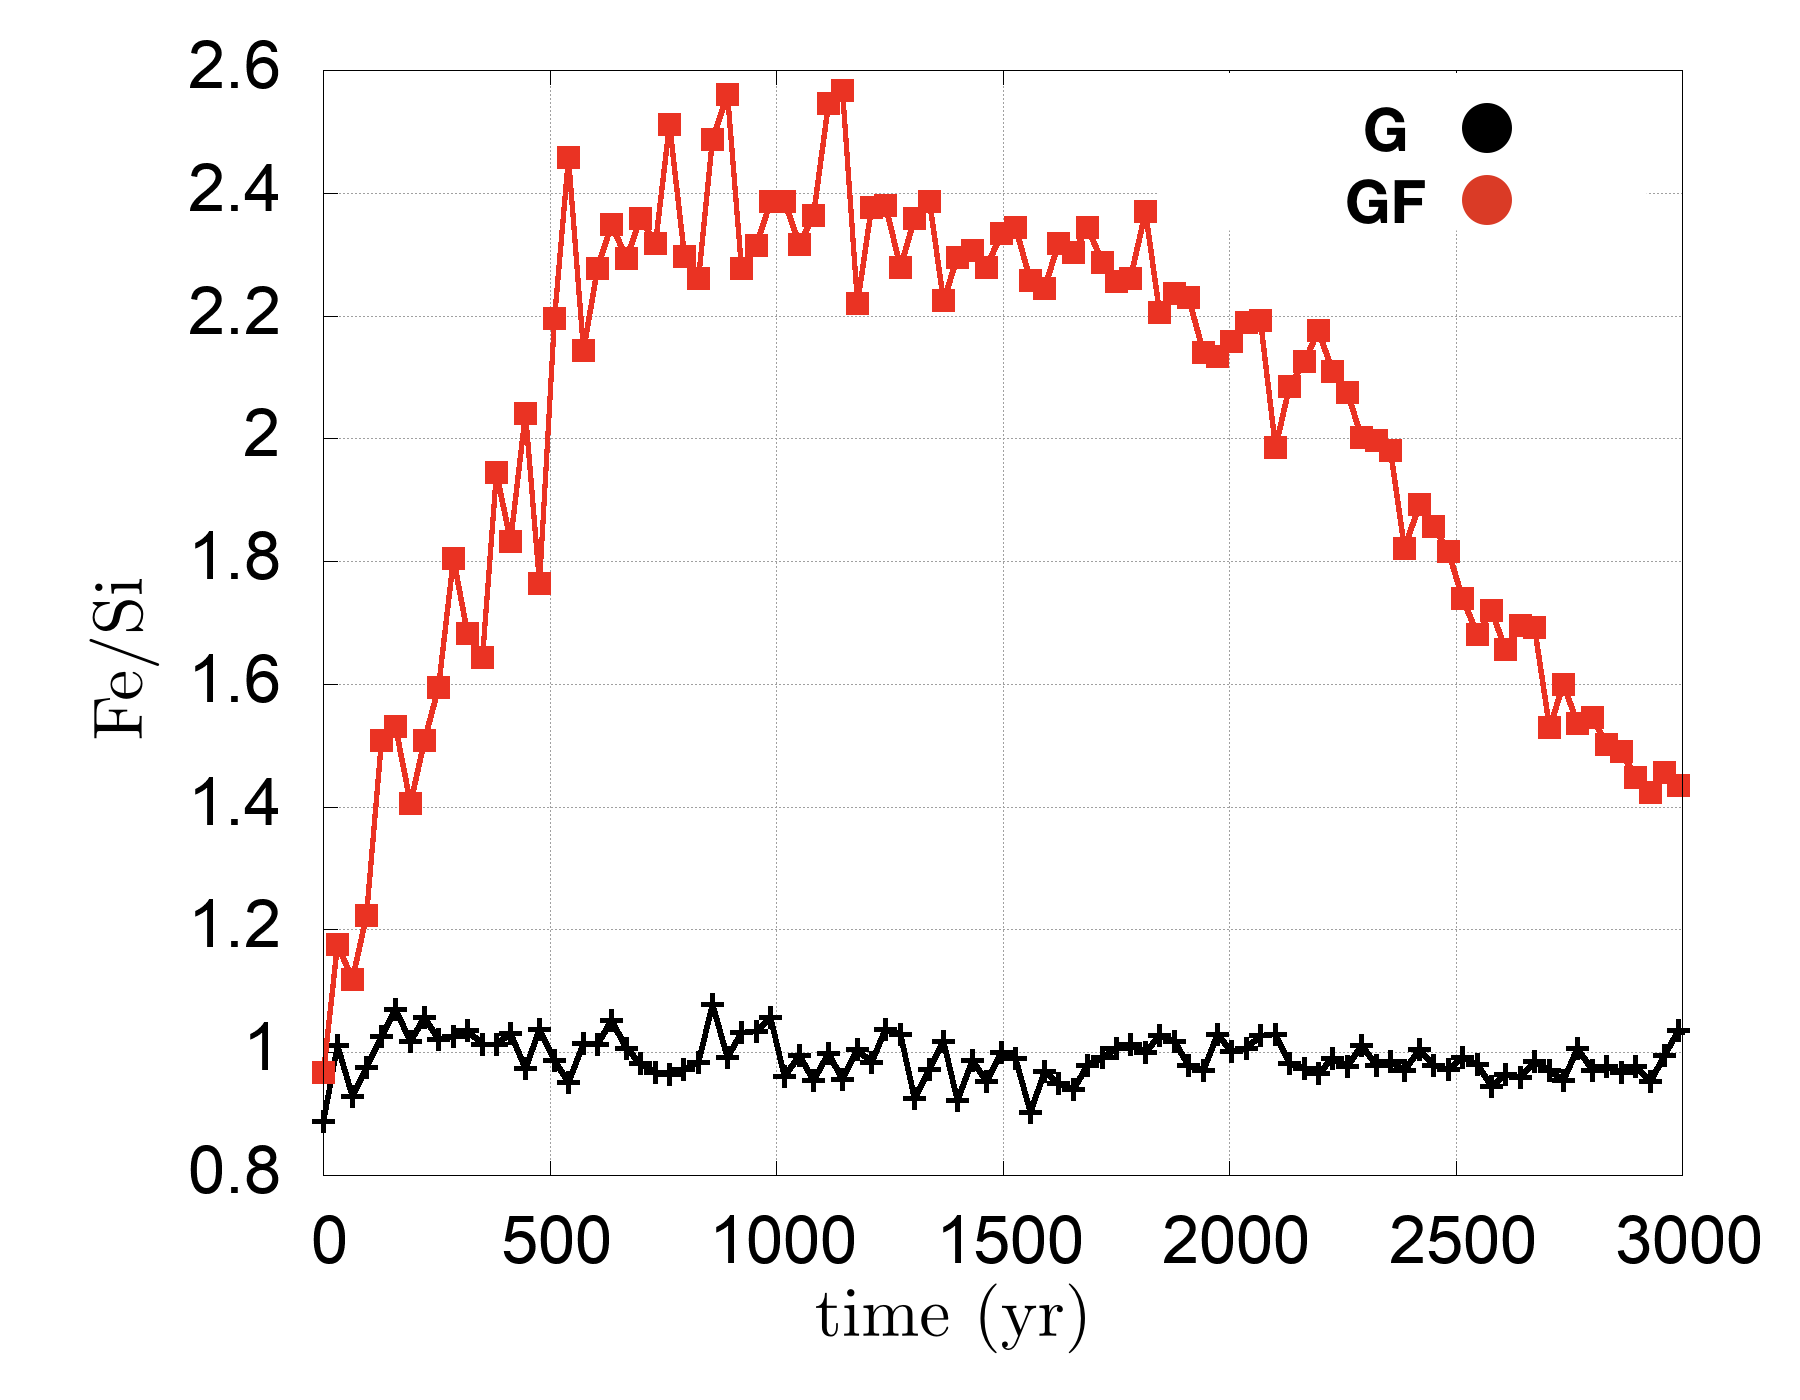
Similarly to the previous Section we plot in Fig. 7, right column, the Fe/Si ratio, (top), and the rock/ice ratio, (bottom), as a function of time. The Fe/Si ratio in G varies within 10% of the initial “solar” value, with a similar trend found in Paper I. In GF the Fe/Si ratio reaches 2.4 times the “solar” value after yr, before dropping toward lower values. The rock/ice ratio shows an important depletion in the case of GF compared to G. This is because, as we saw from the disc surface, the ice is efficiently populating the midplane.
Figure 8, right box, shows the time evolution of the average size of each species in the disc midplane in the case of G (black) and GF (red). We find a behaviour which is similar to the disc surface, with an efficient growth at early stages in the G case. Ice and sulfide grains then reach larger size in the case of fragmentation, in the same timescales found for the disc surface.
Finally, in Fig. 9, right column, we report the evolution of the ratios between the aerodynamic parameters of wustites and silicates, and between sulfides and silicates. We see that, similary to the disc surface, there is a size-density sorting between wustite and silicates and an “un-sorting” between sulfides and silicates for the first 1000 yr. In this latter case, the curve has two peaks within the considered time period.
4 Discussion
In Paper I we investigated the dust properties and disc chemical composition which resulted in the different aerodynamical sorting of the dust species in a pure-growth regime. In this Section we repeat that analysis comparing our two simulations, G and GF.
4.1 Time evolution of relative velocities
At the end of Section 3.1 we showed that the mass fraction of different species that is over/under the respective fragmentation thresholds changes with time. This is because varies with time due to the change in St as grains grow/fragment (see equation (3) and Section 2).
As the particle size increases, reaches a maximum and then decreases ( for small sizes and for large sizes, see equations 2 and 3). This explains the fact that the dust in the disc can naturally transition from a fragmentation regime to a pure-growth regime (see also Sections 2.3, 2.4 and Appendix A in Gonzalez et al. (2017a)). The values of will be determined by the gas drag and by the disc local conditions, but its overall behaviour will remain unchanged. The timescales of the fragmentation regimes, will be then determined by the disc and dust properties.
4.2 Effect of growth and fragmentation in sorting dust
The differences found between G and GF can be explained by the different response of single dust species to the growth and fragmentation. The evolution of dust can be followed from the disc surface. In G, where growth proceeds similarly for all the species, it is the intrinsic density which initially drives the vertical settling as shown in Paper I. In the GF case, the Fe/Si ratio has a steeper decrease because sulfides have a higher fragmentation thresholds () compared to silicates and wustite, ( and respectively). As such, they experience less fragmentation (Fig.4 and 5), grow larger than silicates (see Fig. 8) and thus decouple from the gas more efficiently. This contributes to a more efficient depletion of iron-rich particles in the disc surface. The values of the rock/ice ratios can be explained with a similar argument. Ice particles in our calculations have the highest fragmentation threshold (). As a consequence, they are less sensitive to fragmentation, thus they grow and decouple from the gas, settling toward the disc midplane and depleting the disc surface of ice. This can be clearly seen in Figs. 2 and 6 (bottom left) where ice and sulfides, in GF, settle toward the midplane at higher rates compared to silicates and wustite.
Fragmentation properties can also explain the sorting and “unsorting” of the single species found in Fig. 9. Paper I and references therein showed that, in the G case, grain growth is regulated, if other parameters such as temperature, gas densities, turbulence are kept fixed, by their aerodynamic parameter, . This process distributes all the grains toward a significant size-density sorting. The GF case alters this behaviour as there is another important factor to consider: . Silicates and wustite have similar and thus respond to the growth-fragmentation in an overall similar way. The difference in between sulfides and silicates is more significant and thus they do not respond to the growth-fragmentation in the same way. This is the reason sulfides and silicates are not aerodynamically sorted at the early evolutionary stages.
The evolution of the Fe/Si and the rock/ice ratios in the midplane is directly connected to the behaviour of the dust in the disc surface: the fast rate of settling of ice (Fig. 6, left column) decreases the rock/ice ratio, (see Fig. 7, right column). The rapid depletion of sulfides in the disc surface increases instead the Fe/Si ratio in the midplane. The evolution of the size-density sorting between wustite and silicates, and sulfides and silicates follow the same explanation as for the disc surface (see Fig. 9): wustites and silicates aerodynamically sort since the early stages given their similar , while sulfides and silicates do not as they have different .
Our simulations return other very interesting results: (i) in GF, ice and sulfide grains grow to an average larger size compared with the average size reached by the two species when pure growth is considered (see Fig. 8), and (ii) after a first stage in which sulfides and silicates are aerodynamically “unsorted”, they start to move toward a size-density sorting (see Fig. 9). Moreover, in the midplane, at yr, we saw that the curve has a second peak.
Let us first focus on the two evolutionary stages at which the average size of ice ( yr) and sulfides ( yr) particles overtake the corresponding average size resulting from G (see Fig. 8). At these stages the amount of dust in the disc surface is larger than in the case of pure growth (see Fig. 6, top left). A similar situation in found in the midplane (see Fig. 6, top right). This is mainly due to the fact that fragmentation does not allow grains to grow large enough to decouple from the gas and start drifting and then accreting into the central star. Moreover, at yr most of the ice particles evolved under the fragmentation thresholds (90%) and thus, into a pure-growth regime (for sulfides the 90% threshold is reached at yr) (see Figs. 4 and 5). When ice and sulfides evolve under the fragmentation threshold, there is more dust compared to the G case. Indeed, in Fig. 6 (top) we see that after yr the ratio is of the initial amount in GF and in G (given the overall efficiency of dust settling). At yr the ratio is of the initial amount in GF and in G. Since the efficiency of growth is proportional to the dust mass present around the dust particle (Laibe et al., 2008), when ice and sulfides turn into the pure-growth regime, there is more dust available and, as a consequence more collisions and thus, more growth.
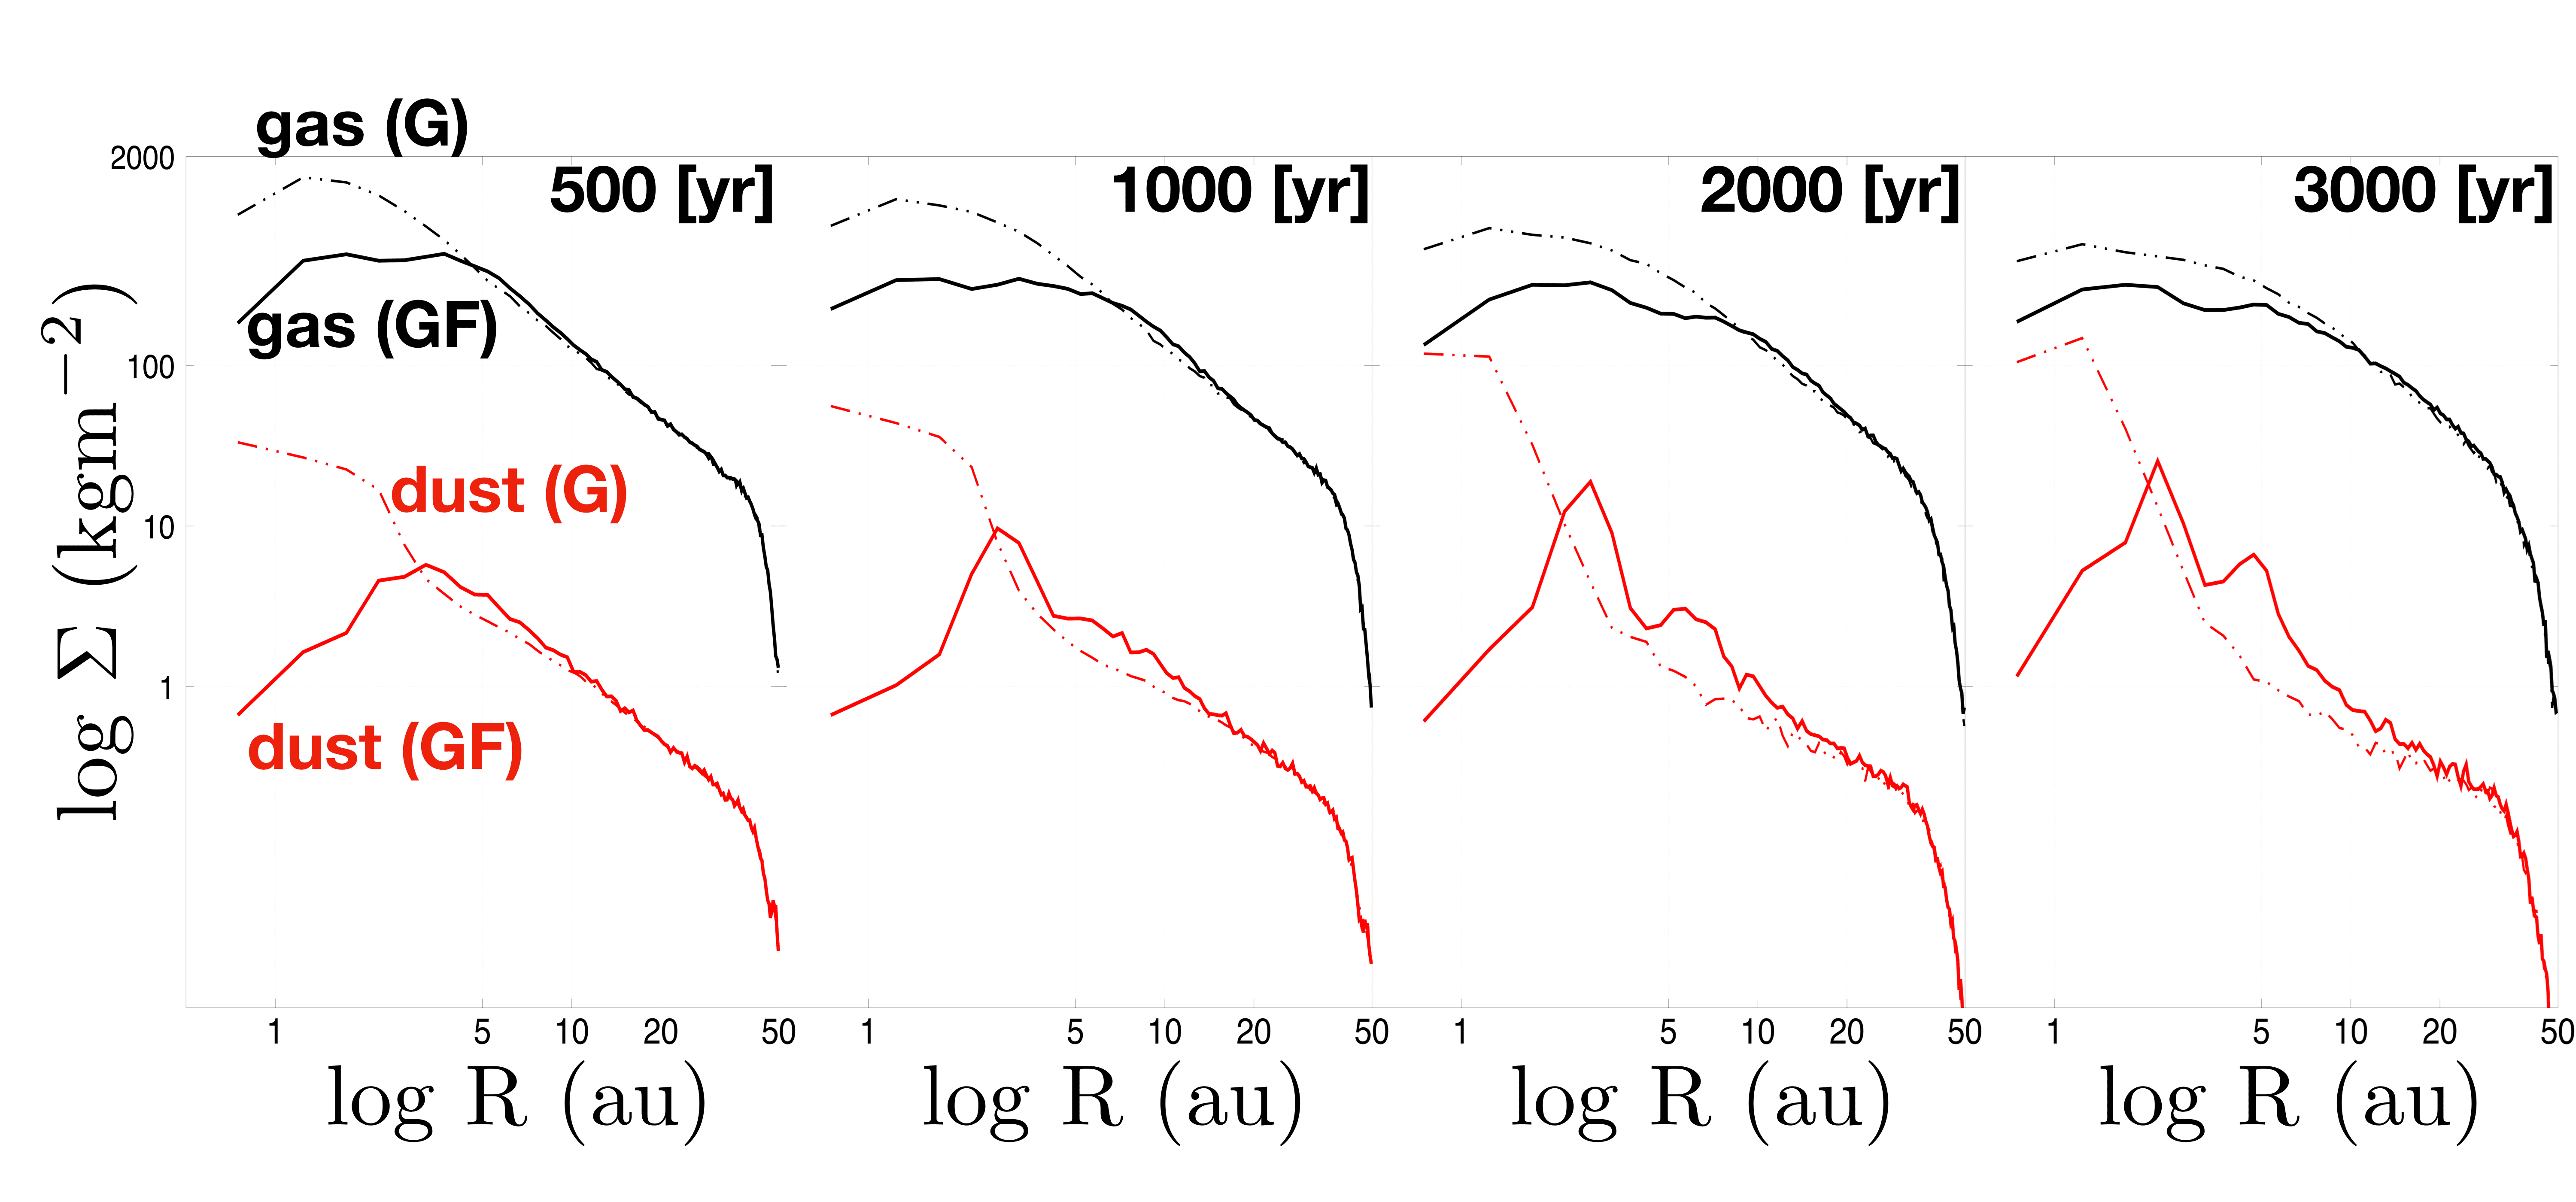
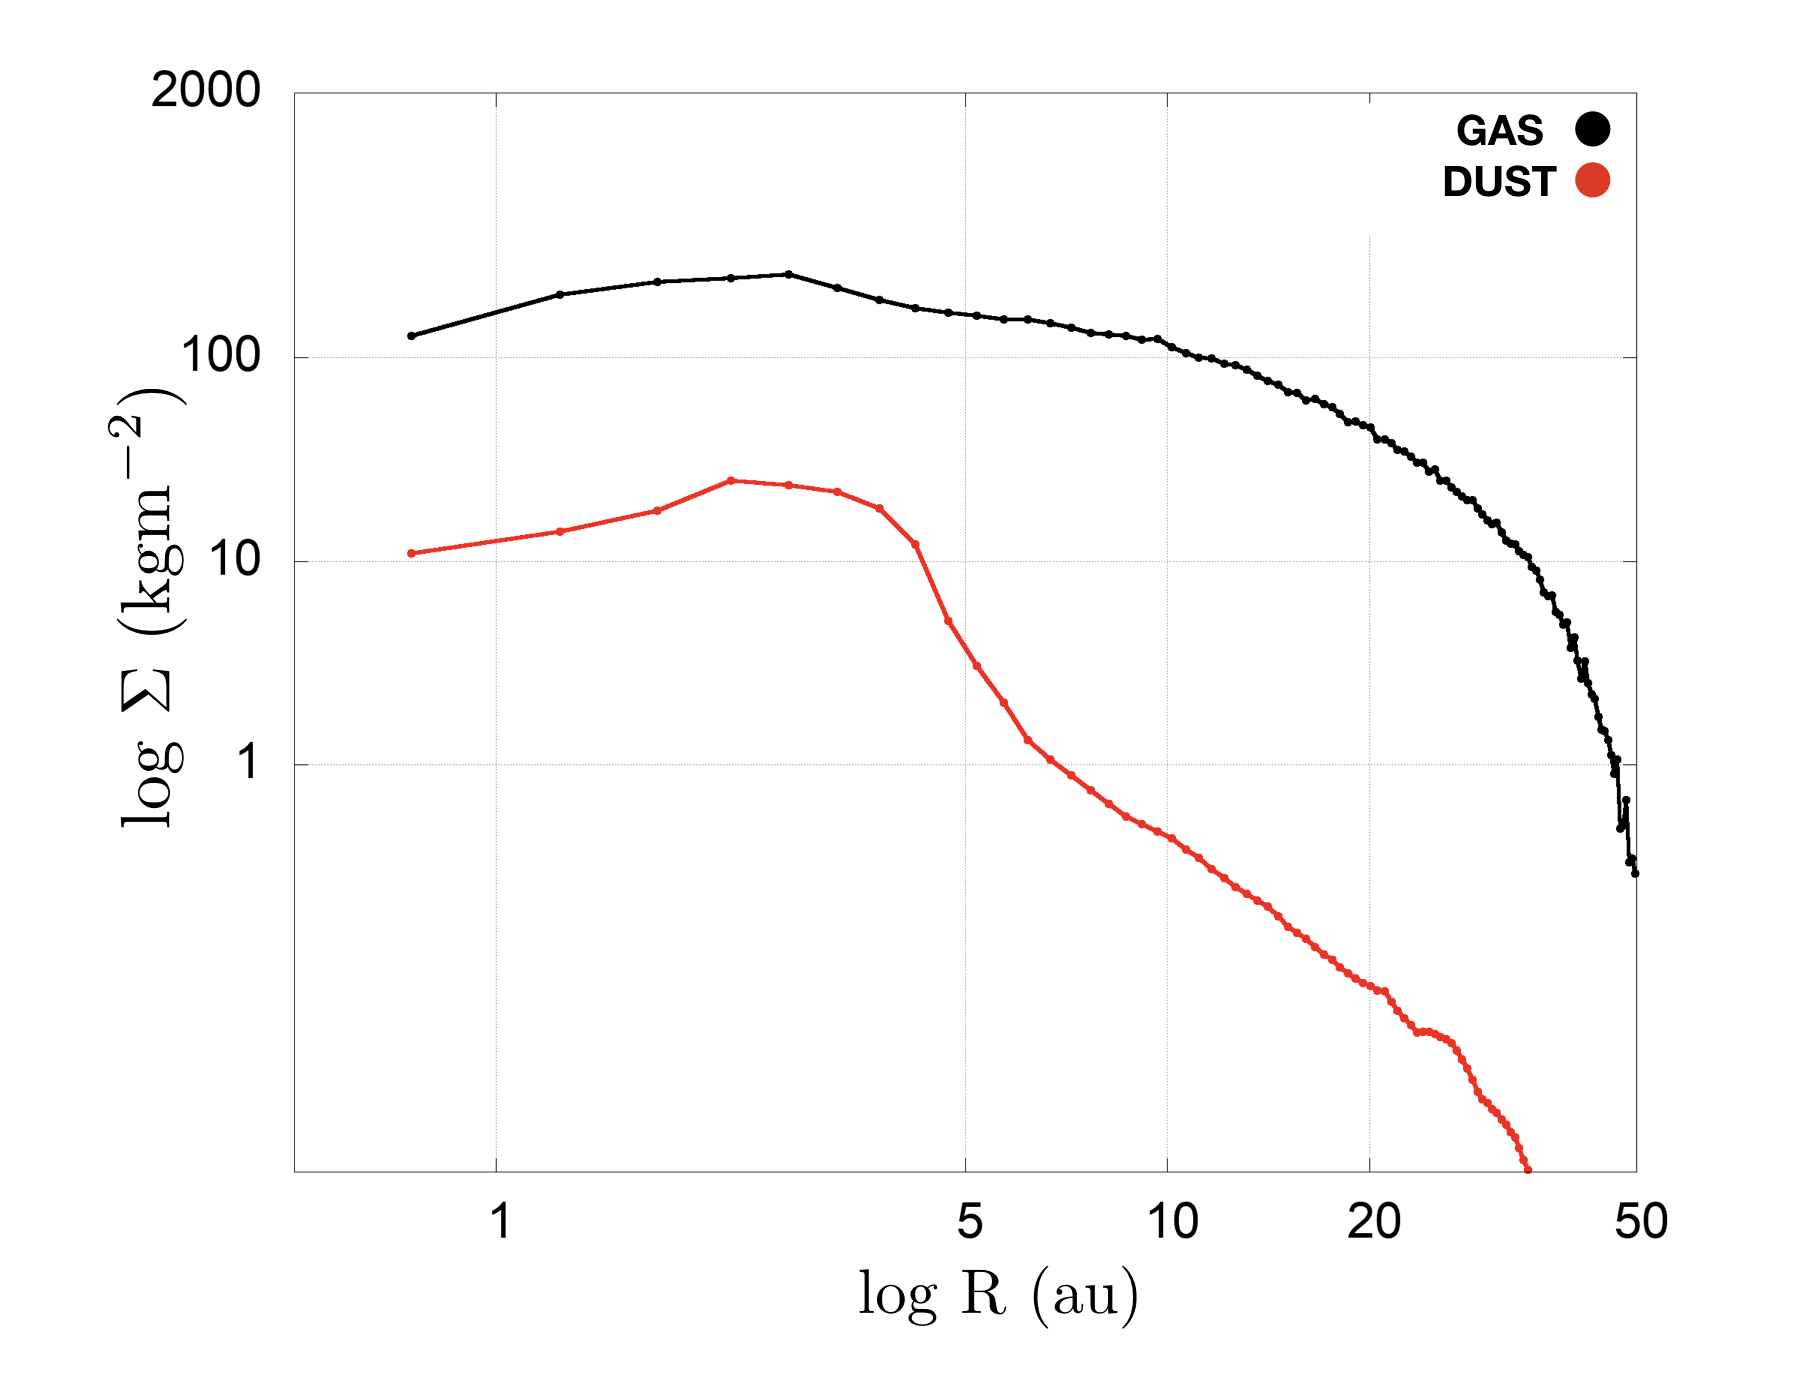
Nevertheless, there is another important aspect which has to be taken into account. In Fig. 10 we report the time evolution of the gas and dust surface density for G and GF. In G the dust and gas profiles do not change dramatically with time. Dust drifts toward the inner disc past our inner disc limit and eventually onto the star, or decouples from the gas, piling up at the inner disc edge. Indeed, the inner boundary of our simulations at 0.5 au mimics a central cavity with a sharp drop of gas density at the very inner rim. The gas density has a maximum just outside this drop, where grains having decoupled accumulate. Their back-reaction further enhances this gas maximum. These results are in very good agreement with what has been found in earlier work (Laibe et al., 2008, Paper I, and references therein). In GF we see that dust piles up at two locations in the inner region ( and au) but not at the inner edge where the gas density, similarly to the G case, has a maximum at early times. These two locations are self-induced dust traps and form via a mechanism explained and investigated in detail by Gonzalez et al. (2017a, b) and summarized here. Drifting dust grains reach a location where their relative velocity is larger than their fragmentation velocity. As a consequence, dust starts to fragment and slow down its drift. As the dust is accumulating, given the back-reaction of dust on gas, the gas profile is affected in correspondence of the dust peaks, generating a gas pressure maximum, i.e. a self-induced dust trap at the same two locations, and au, in the GF curves of Fig. 10. In their Appendix B, Gonzalez et al. (2017a) showed that the location of a self-induced dust trap is a function of the fragmentation velocity: , where is the exponent of the power law for the temperature profile. For our disc model, . Here, the trap at 2 au is caused by the accumulation of ice, with m s-1, while that at 5 au is attributed to the other species, which all have more similar fragmentation velocities of the order of 40 m s-1. Indeed, the expected location of the trap for this value is au, in agreement with the observed value. Dust grains of different species drifting from the outer disc are then trapped at either of these locations and cannot drift further inwards, preventing the dust pile-up at the inner disc edge that was seen in the G case. Furthermore, even though the inner boundary at 0.5 au can alter the density profiles, its effect on our results is small since we only consider the disc regions outside the snowline at 1.87 au. As the growth is a function of the dust density (Laibe et al., 2008, Paper I), we would expect an overall increase of the average size of dust particles at and au, after the first 2000 yr, when most of the relative velocities between dust particles have decreased below the fragmentation threshold (see Fig.5). We do indeed observe this in the bottom-right panel of Fig. 3. Note that a similar behaviour can be expected with other species-dependent trapping mechanisms, such as snow lines.
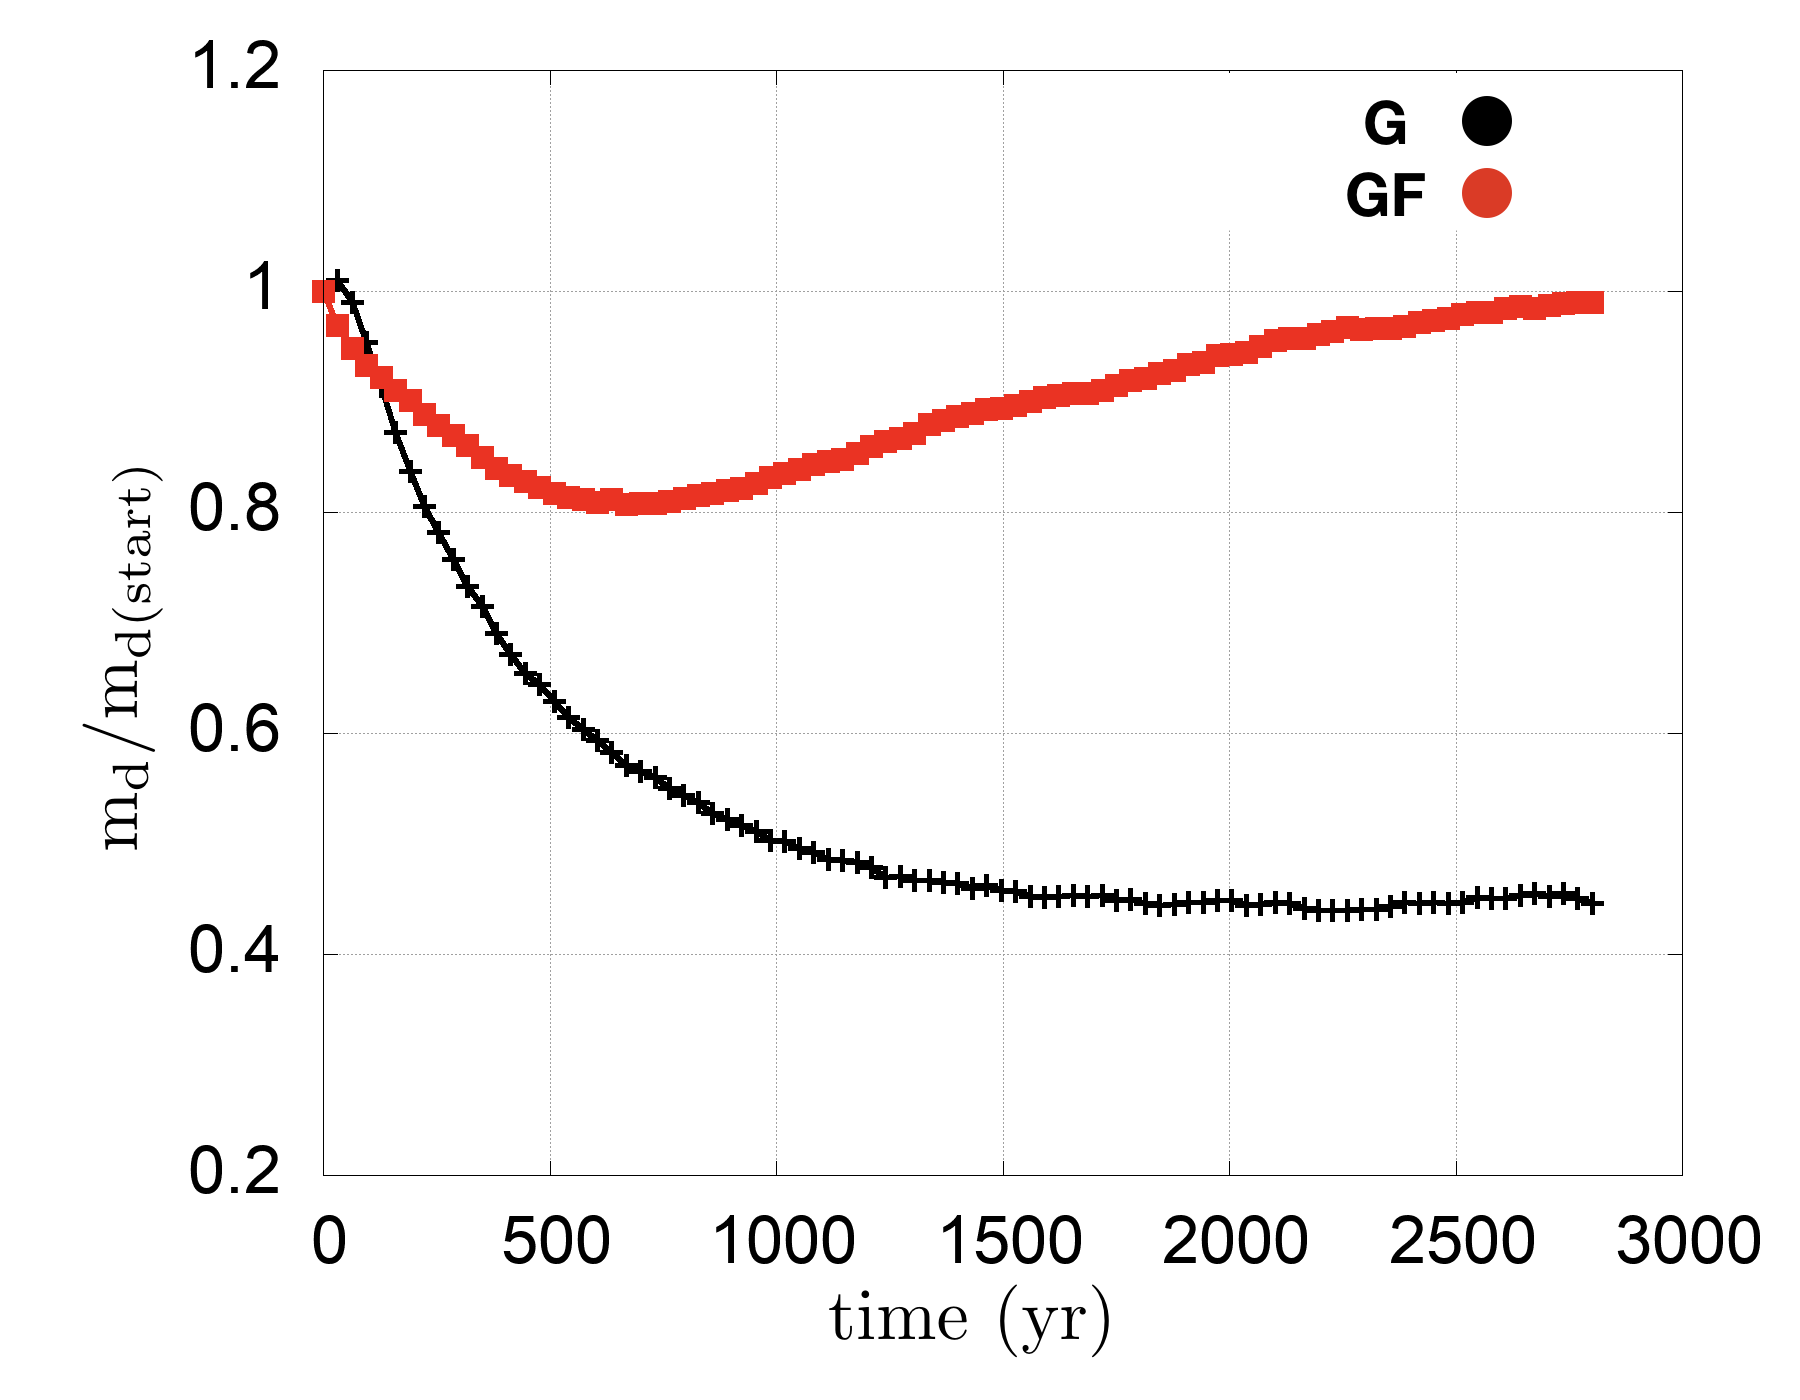
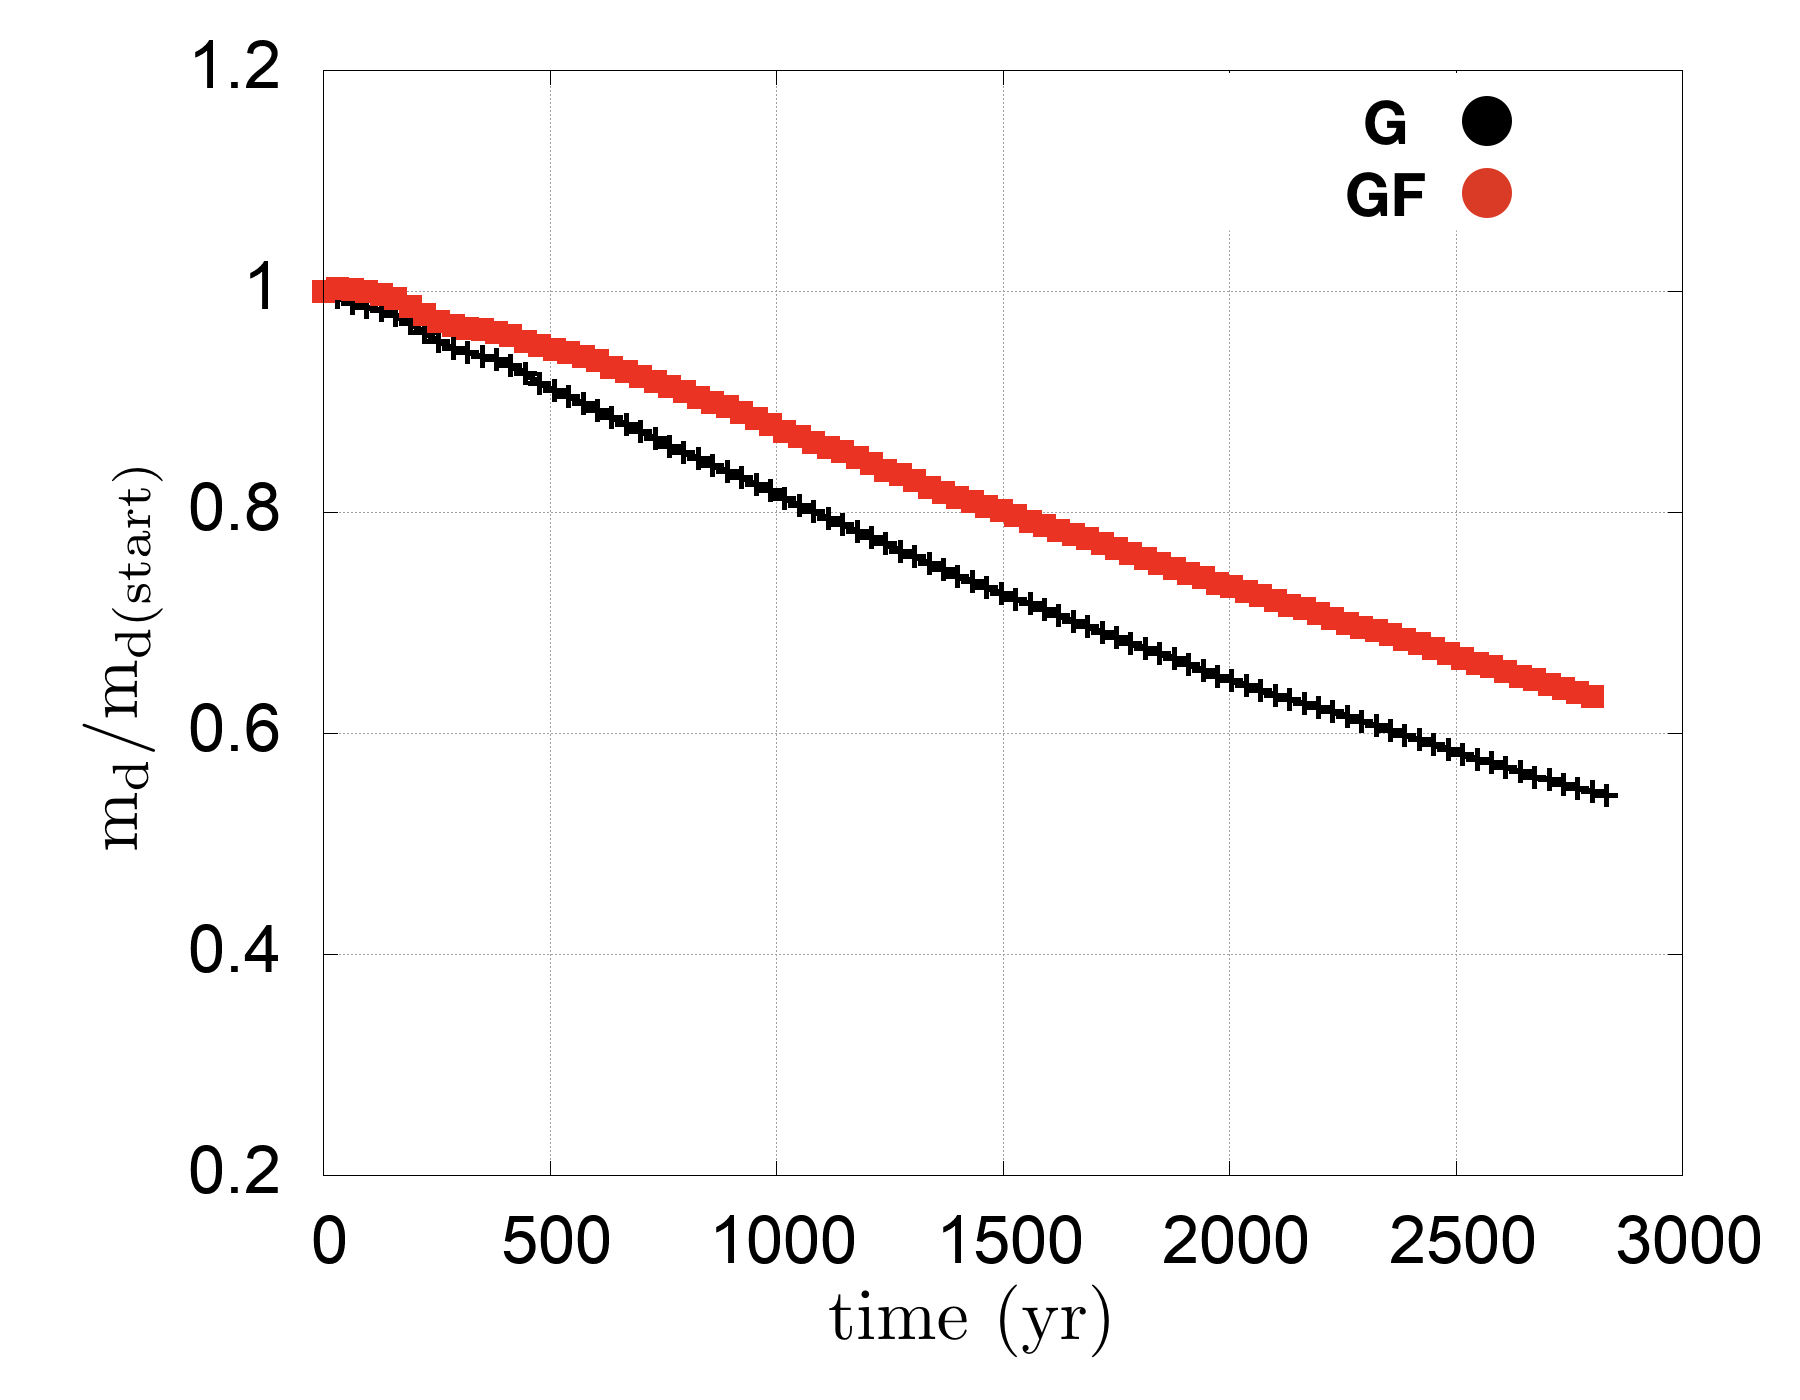
Figure 11 shows the time evolution of the total dust mass in the whole (surface plus midplane) inner () disc (left) and in the outer () disc (right). Figure 11 (left) illustrates the balance between accretion of the dust into the very inner region au and the radial drift of particles which come from the outer disc ( au). Figure 11 (right) shows that the rate of depletion (or drift) from the outer disc is not so different when pure-growth and fragmentation are taken into account, as the fragmentation is not so efficient in that zone of the disc. However, as expected, fragmentation slows the drift of particles as the optimal drift size is reached within longer times (see Fig.3). Figure 11 (left) clearly shows that in the G case dust “accretes” efficiently onto the star until the accretion rate reaches an equilibrium with the material that is moving inward from the outer disc and a balance between accretion and the initial drift from the outer disc is reached within yr: grains grow, reach the optimal drift size and drift. In GF we see that, after a first stage in which accretion is emptying the dust content in the inner disc, at yr, the trend is inverted and the amount of dust increases. After yr the dust mass in the disc, in GF, is again comparable to the initial mass, while in G the dust mass in the disc is times the initial value.
In GF, after yr most (90%) of the ice and, after yr, most of sulfide particles are not in the fragmentation regime anymore (see Figs. 4 and 5) and they grow larger compared to G. These particles are well above their optimal drift size (see Figs. 3), and thus they decouple from the gas and pile up efficiently in the inner disc region. Moreover, dust particles which come from the outer disc move in an environment in which the relative velocities are very close to the fragmentation threshold. This is the case of wustite and silicates particles which, after yr are still in the fragmentation regime. Silicates and wustite particles fragment and thus, stop their drift and pile up.
The plateau around yr in in Fig. 8 shows that the average size profile of wustite and silicates become flatter (the average size now takes in account the smaller and fragmenting grains which are drifting from the outer disc) and then start to grow again around yr, when it is clear (see Fig. 5 (middle)) that these species are into the pure-growth regime. At yr, of silicate and wustite grains are under the fragmentation threshold and start a pure growth which results in larger average sizes in the inner disc (see Fig. 3). The drift also explains the second peak of the curve seen in Fig. 9 for the midplane: it occurs when the silicate particles, which are drifting from the outer disc, enter the inner disc zone experiencing fragmentation, and, thus, “unsort” with the sulfides.
4.3 Later evolutionary stages
In order to investigate the evolution of the GF simulation within longer timescales, we further evolved our GF simulation for over yr. In Fig. 12 we report all the quantities illustrated in the previous Sections for this final stage. We can see that our disc evolved toward a state for which most of the dust is under the fragmentation threshold. The continued dust drift from the outer disc has increased the dust pile-up in the outer self-induced dust trap and both traps have merged into a single, broader one at au. Most of the disc is now in a pure growth regime, and this stage compares well overall with results found in Paper I, except for the location of the dust pile-up.
4.4 Small grains and planetesimal formation
Dullemond & Dominik (2005) investigated the effect of growth and fragmentation of dust in protoplanetary discs. They pointed out that if growth is efficient and dominating on the fragmentation, it should deplete the small grains quickly with derived timescales that are not compatible with the IR spectra of discs. In fact, observations do show the presence of sub micron and micron size grain on the disc surface. Dullemond & Dominik (2005) suggested that growth and fragmentation result in a steady size distribution with a constant replenishment of smaller grains. Birnstiel et al. (2010, 2012) showed that fragmentation is a required and important mechanism to prevent strong radial drift and thus depletion of dust that can make the process of planetesimal formation difficult. Birnstiel et al. (2012) also found that inner discs are generally fragmentation-dominated while outer discs are growth-dominated and then conclude that discs have to be in a strong turbulence regime, as drift alone cannot support efficient fragmentation over long evolutionary timescales. Saito & Sirono (2011) pointed out that the sublimation of the ice content of composite large grains that drift from the outer region can release large quantities of rocky material whose smaller size would allow a re-coupling to the gas phase. This would replenish the inner disc with smaller grains. Dra̧żkowska & Alibert (2017) then suggest that this dust would not be free to drift in the inner disc but it will pile-up close to the snow line and enhance planet formation.
Our calculations show some analogies with the effects found in previous work: as the drift becomes efficient, the dust moves in the inner disc, fragments, and piles up at specific locations that depends on the density of the grains and their fragmentation properties. In our case, the dust pile-up is caused by the back-reaction of the dust onto the gas, that is not included in Birnstiel et al. (2010, 2012).
However, we do not find an overall steady state distribution of grains size within the considered time. This is because, according to our disc model, the relative velocities of the dust species evolve as a function of time, transitioning under the considered fragmentation threshold. Only in the very inner disc that we consider, a small percentage of dust is still in the fragmentation regime. However, we do expect the effects of fragmentation to have a variable duration as the considered threshold velocities and disc parameters change.
In order to preserve a detectable quantity of smaller grains in the inner surface of old discs, fragmentation regimes should last longer in these regions (or growth should be inefficient). On the other hand, in discs like GG Tau and TW Hya where size sorting and stratification is detected (Pinte et al., 2007; Wilner et al., 2000, 2003; Hughes et al., 2007, 2008; Andrews et al., 2012; Menu et al., 2014) planetesimal and planet formation are also thought to be underway (van Boekel et al., 2017). This is also thought to occur in relatively younger objects such as HL Tau (Dipierro et al., 2015; Testi et al., 2015).
Nevertheless, dating of achondrite meteorites (samples of already differentiated planetesimals) shows that accretion of their parent bodies occurred as early as 1 Myr after the formation of the CAIs (Kleine et al., 2009; Sugiura & Fujiya, 2014). To match disc observations (dust size-sorting and gaps by forming planets) with Solar System’s achondrite ages, fragmentation and growth regimes have to be efficient at the same time, but, in different locations.
In Fig. 5 it can be seen that the dust in the disc surface remains, after yr, slightly more fragmenting than the dust located in the disc midplane. This is probably a consequence of the average smaller size of the particles in the disc surface (Fig. 8) that keeps them in the fragmentation regime as the relative velocities are a function of the particle size.
Although limited by resolution and model constraints, our 3D simulations suggest that two different growth regimes characterize the disc surface and the midplane. This could explain the observable discrepancies between the sub-micron and micron sized dust in disc surfaces and planetesimal formation and differentiation in the midplane. Moreover, if aggregates of different composition and size have different fragmentation properties we can speculate the presence in the disc of different fragmentation lines (or zones) that would act similarly to the disc particle traps or the snow/sublimation lines where dust can pile up efficiently (see section 4.2).
4.5 Aerodynamical sorting in chondrites
In this section, we explore whether the combined effects of transport and fragmentation described in previous sections can be used for explaining the chemical variations in the composition of chondrites and planetary objects.
In Paper I we suggested that size-density sorting that occurred via gas-dust interaction in an evolving disc could have played an important role in determining the physical and compositional properties seen in chondrites (Benoit et al., 1998; Kuebler et al., 1999).
One salient compositional feature of chondrites is the variation in the abundance of metallic iron/iron-sulfide (see Fig.2 and the Urey-Craig diagram in Fig.3 of Paper I, also reported in Righter et al. (2006)). The relative abundance of reduced iron phases is controlled by the redox conditions whereby oxidizing conditions lead to more abundant FeO with limited metallic iron. For example CI chondrites and H chondrites have similar ratios (where refers to the total iron content) but the amount of reduced iron is much greater in H chondrites. A second important parameter that may be influenced by aerodynamic sorting is the abundance of Fe (present as Fe or FeS) relative to silicates where iron is incorporated as FeO. An example is given by enstatite chondrites: EH and EL chondrites are similarly reduced but the EL chondrites have a low metallic iron content relative to EH chondrites. In what follows, the variations of metal content relative to silicates will be discussed as the behaviour of metallic iron can be easily extrapolated from our simulations. It is assumed here that the fragmentation threshold of metallic particles are on the order of as suggested by Yamamoto et al. (2014) or higher than the silicates values as experimental evidences suggest. This would allow a more evident separation between the Fe-rich particles and the Si-rich particles, with a behaviour of Fe-metal closer to that of the ice.
The existence of sorting according to size-density has already been described in chondrites (Benoit et al., 1998; Kuebler et al., 1999; Cuzzi et al., 2001). First, it was shown that there is a relatively narrow size distribution for chondrules in ordinary chondrites. Furthermore, it was shown that the size of chondrules decreases from LL to L and H chondrites (Rubin, 1989) (see also Fig.1 in Paper I). This work was extended to metal grains by Kuebler et al. (1999) who determined the size distribution of both chondrules and metals in the same ordinary chondrites H, L and LL. Overall, the LL chondrules are larger than L and H chondrules, while the metallic grains are slightly smaller. Similarly, Schneider et al. (2003) showed that the metal grains and chondrules are larger in EL chondrites relative to EH chondrites, while EL chondrites are overall depleted in metallic iron, for a similar redox state. An additional observation was that the total iron content of H and EH chondrites is overall similar to that of CI chondrites, indicating that the EL, L and LL chondrites reflect a depletion of iron relative to the solar composition. It was argued by Jacquet (2014) that these features could indicate sorting of metal grains relative to silicates represented by chondrules.
It has long been known that the variations of ratios in ordinary chondrites reflect a fractionation between metallic iron and silicates in protoplanetary discs (Larimer & Anders, 1970; Larimer, 1973). However, the mechanism responsible for this fractionation has remained elusive. While the possibility of aerodynamic sorting was suggested, this mechanism has not been explored quantitatively. Wasson (1972) argued that the separation between metal and silicates in ordinary chondrites was clearly an early process, as the refractory siderophile elements are not equally enriched in the metal of H, L and LL chondrites, indicating that the process of metal separation took place at high, albeit different temperatures. Furthermore, Hellmann et al. (2017) have also shown that the timing of Hf-W fractionation, itself indicative of metal-silicate separation between the three ordinary chondrite groups was estimated to be around 2 Myr after CAIs (Calcium Aluminium rich Inclusions), also suggesting an early process.
Kuebler et al. (1999) have argued that the observed patterns in ordinary chondrites could result from aerodynamic sorting. Interestingly the ratio of ranges between 1.49 and 0.84 from LL to H chondrites, with the H chondrites having a closer to 1. This could mean that metal and silicates were transported jointly yielding little fractionation, which is consistent with the of H chondrites similar to that of CI chondrites ( solar composition). In contrast, the LL chondrites have a higher and are characterized by metallic iron content (typically 3%) lower than other ordinary chondrites (8-15%). Thus, the LL chondrites represent a reservoir with a low . These observations may result from the process described in section 4.2 and depicted in Figures 7 and 9, showing variations in the in the disc surface compared with the midplane. A limitation to this reasoning could arise if the observed fractionation was not related to the observed metal and chondrule grains but to an earlier generation of precursor grains, in which case the aerodynamic properties could have been different. Recent 207Pb–206Pb and 26Mg–26Al chronology of chondrules (Bollard et al., 2017) suggests that most primary chondrules formed Myr after the beginning of the solar system. However, it could be argued that these ages are not consistent with numerous 26Mg–26Al observations (e.g. Villeneuve et al. (2009)). While the timing of these processes may have to be better defined, the observations in chondrites are indeed suggestive of the process described in our model.
In contrast with ordinary chondrites, the CH and CB chondrites are globally enriched in metallic iron (Scott, 2007), while being characterized by a higher ratio than CI chondrites. Thus, a mechanism similar to that outlined here could have enriched metallic iron or iron sulfide relative to silicates. At a larger scale, Mercury is similarly reduced to EH chondrites (Nittler et al., 2011) but it has a higher abundance of metallic iron and a higher ratio than CI chondrites. The unusual compositional features of Mercury may also stem from the process described in this study and Paper I (iron enrichment in the inner midplane, see also Pignatale et al. (2016, and reference therein)), provided the dust enriched in Fe was rapidly accreted into planetesimals before further changes in the overall composition could take place. While this interpretation is speculative and would deserve more in-depth investigations, the new process of Fe enrichment stemming from density contrasts coupled with differences in fragmentation behavior suggests that it could have played an important role in explaining the abundance of iron in planetary materials.
In term of size-density sorting of chondritic components, our work on fragmentation adds several further constraints. In order to allow aerodynamic sorting during the fragmentation regime, our results suggest that different chondritic components need to have the same fragmentation properties, but evidence suggests that this is not the case. To preserve the aerodynamical sorting (i) aggregation of chondritic material should have occurred when or where fragmentation was not efficient (), or (ii) the single components in chondrites were highly resistant (very high ), or (iii) single components in chondrites already stopped growing and fragmenting at the time of accretion with their sorting dictated only by the gas drag. As a consequence, aerodynamic sorting of metallic grains, sulfides and chondrules should have occurred following one of these three conditions. These conditions are compatible with the suggested location (around the snow line) and aggregation timescale (after Myr from CAI formation) proposed for the parent body formation of ordinary and carbonaceous chondrites (Krot et al., 2015; Sugiura & Fujiya, 2014).
4.6 On the fragmentation thresholds and caveats
In this work we used as of the considered species values taken from Yamamoto et al. (2014) and values derived in Section 2.2. These values are based on theoretical and experimental evaluations. As already pointed out in the introduction, the fragmentation velocities for different species are very difficult to evaluate as the resulting threshold is a function not only of the chemical composition of the dust but also a function of the grain physical properties such as their crystalline or amorphous structure, size, porosity, shape (Blum & Wurm, 2008; Wada et al., 2009; Teiser & Wurm, 2009; Zsom et al., 2010; Wada et al., 2013; Meru et al., 2013; Yamamoto et al., 2014). However, the behaviour of fragmenting dust described in this work would still be valid, in the sense that if the fragmentation velocities and bulk densities of two different species (or aggregates) are known, their behaviour can be easily extrapolated from our results. Our finding can be extended to aggregates of mixed species as well. As such, in terms of aerodynamic sorting we find that if two aggregates have the same fragmentation properties (similar fragmentation threshold) they will aerodynamically sort. If they have different fragmentation properties they will not sort aerodynamically until the disc environment (or aggregates) evolves very close to a pure-growth regime.
In this work we considered, for simplicity, all the fragmentation velocities as constant, i.e. with no variation with time, grain size, or other parameters. If a variation of with the size of a given species is known, it could then be compared to the variation of with size (see equation 3), to infer at which stage any species would move into or away from a pure-growth regime according to its size and given disc conditions. Moreover, if species are “resistant” to fragmentation, they will vertically sort and radially drift driven by their intrinsic density first, and their size later, as described in Paper I. If species are “sensitive” to fragmentation, it will be that will dictate the dynamical behaviour, at early stages, when compared to other species. Furthermore, different and different disc models will change the timescales at which the transition between the fragmentation regime and the pure-growth regime could occur and where fragmentation would be more efficient.
We do not consider, for resolution limits and scope of the work, the erosion, disruption and bouncing that large grains/bodies (s cm) can experience upon collision. According to the type of collision, the production of smaller grains with a large size distribution (Güttler et al., 2010; Geretshauser et al., 2012) can occur. As a consequence, a more complex situation can be produced where grains having different size but located in the same environment can experience new episodes of fragmentation and growth.
5 Conclusions
In this work we studied the effects of growth and fragmentation in determining the behavior of a multi-phase dust. Fragmentation changes the chemical composition of the disc with values and trends that can actually diverge when compared to the case of pure-growth. The chemical fractionation of dust via dynamical processes is sensitive to the of the considered species. As a consequence, fragmentation can affect the bulk composition of the planetesimals that may be accreted into planets as it could change, for example, the rock/ice ratio. Our results suggest that the chemical fractionation observed in chondrite families and Mercury’s enrichment in iron could be the result of size-density sorting and different fragmentation properties of dust grains.
Two species become aerodynamically (size-density) sorted in a fragmentation regime only if they have the same fragmentation properties. Eventually they will be size-density sorted at later stages when the pure-growth regime takes over. Our results suggest that chondrite components that show a size-density sorting may have accreted into larger bodies in regions of the Solar Nebula, and/or at a time where fragmentation was not efficient or not occurring at all, thus allowing the observed degree of sorting.
Dust in the disc can evolve toward a pure-growth regime as is regulated by the Stokes number. Similarly to Gonzalez et al. (2017a, b) we found that, when fragmentation is taken into account, drifting dust can pile up at fragmentation fronts. Then, a runaway accretion of dust occurs as the accumulating grains transition to a pure-growth regime. Counter-intuitively, taking fragmentation into account can thus produce dust aggregates which are larger than those that result from a pure-growth simulation. As a consequence, we further confirm that fragmentation may be a key mechanism to overcome the radial-drift barrier in short timescales.
The fact that micron-size dust grains are seen in discs where planetesimals formation should be well underway suggests that discs surfaces and midplanes are in different fragmentation/growth regime and/or that dust and gas accretion occur in a differential way (active surface and dead midplane) as recently proposed.
We can speculate that if aggregates with different bulk composition or different sizes have different fragmentation properties, a formation of multiple fragmentation lines in discs where dust can pile up and efficiently form large aggregates can occur. Different fragmentation thresholds and different disc parameters can extend/reduce the effects of fragmentation.
Acknowledgments
The authors are grateful to the LABEX Lyon Institute of Origins (ANR-10-LABX-0066) of the Université de Lyon for its financial support within the program ”Investissements d’Avenir” (ANR-11-IDEX-0007) of the French government operated by the National Research Agency (ANR). FCP acknowledges the financial support of ANR-15-CE31-0004-1 (ANR CRADLE) and thanks Jonathan Léger for helping in managing the large amount of data which resulted from the simulations. JFG acknowledges funding from contract number ANR-16-CE31-0013 (Planet-Forming-Disks). All simulations were performed at the Common Computing Facility of LABEX LIO. The authors wish to thank the anonymous referee for their detailed comments and suggestions that greatly improved the manuscript.
References
- Andrews et al. (2012) Andrews S. M., et al., 2012, ApJ, 744, 162
- Arena & Gonzalez (2013) Arena S. E., Gonzalez J. F., 2013, MNRAS, 433, 98
- Armitage (2011) Armitage P. J., 2011, ARA&A, 49, 195
- Barrière-Fouchet et al. (2005) Barrière-Fouchet L., Gonzalez J.-F., Murray J. R., Humble R. J., Maddison S. T., 2005, ApJ, 443, 185
- Benoit et al. (1998) Benoit P. H., Akridge G., Sears D. W. G., 1998, in Lunar and Planetary Science Conference. p. 1457
- Birnstiel et al. (2010) Birnstiel T., Dullemond C. P., Brauer F., 2010, A&A, 513, A79
- Birnstiel et al. (2012) Birnstiel T., Klahr H., Ercolano B., 2012, A&A, 539, A148
- Blum & Wurm (2008) Blum J., Wurm G., 2008, ARA&A, 46, 21
- Bollard et al. (2017) Bollard J., et al., 2017, Science Advances, 3, e1700407
- Booth et al. (2015) Booth R. A., Sijacki D., Clarke C. J., 2015, MNRAS, 452, 3932
- Brauer et al. (2008a) Brauer F., Dullemond C. P., Henning T., 2008a, A&A, 480, 859
- Brauer et al. (2008b) Brauer F., Henning T., Dullemond C. P., 2008b, A&A, 487, L1
- Cuello et al. (2016) Cuello N., Gonzalez J.-F., Pignatale F. C., 2016, MNRAS, 458, 2140
- Cuzzi & Weidenschilling (2006) Cuzzi J. N., Weidenschilling S. J., 2006, Particle-Gas Dynamics and Primary Accretion. pp 353–381
- Cuzzi et al. (2001) Cuzzi J. N., Hogan R. C., Paque J. M., Dobrovolskis A. R., 2001, ApJ, 546, 496
- D’Alessio et al. (1998) D’Alessio P., Canto J., Calvet N., Lizano S., 1998, ApJ, 500, 411
- D’Alessio et al. (1999) D’Alessio P., Calvet N., Hartmann L., Lizano S., Cantó J., 1999, ApJ, 527, 893
- Deckers & Teiser (2016) Deckers J., Teiser J., 2016, MNRAS, 456, 4328
- Dipierro et al. (2015) Dipierro G., Price D., Laibe G., Hirsh K., Cerioli A., Lodato G., 2015, MNRAS, 453, L73
- Dominik & Dullemond (2008) Dominik C., Dullemond C. P., 2008, A&A, 491, 663
- Dra̧żkowska & Alibert (2017) Dra̧żkowska J., Alibert Y., 2017, A&A, 608, A92
- Dullemond & Dominik (2004) Dullemond C. P., Dominik C., 2004, ApJ, 421, 1075
- Dullemond & Dominik (2005) Dullemond C. P., Dominik C., 2005, ApJ, 434, 971
- Fouchet et al. (2007) Fouchet L., Maddison S. T., Gonzalez J.-F., Murray J. R., 2007, ApJ, 474, 1037
- Fouchet et al. (2010) Fouchet L., Gonzalez J.-F., Maddison S. T., 2010, A&A, 518, A16
- Fromang et al. (2011) Fromang S., Lyra W., Masset F., 2011, A&A, 534, A107
- Geretshauser et al. (2012) Geretshauser R. J., Speith R., Kley W., 2012, in , High Performance Computing in Science and Engineering 11. Springer, pp 29–45
- Gonzalez et al. (2012) Gonzalez J.-F., Pinte C., Maddison S. T., Ménard F., Fouchet L., 2012, A&A, 547, A58
- Gonzalez et al. (2015a) Gonzalez J.-F., Laibe G., Maddison S. T., Pinte C., Ménard F., 2015a, Planet. Space Sci., 116, 48
- Gonzalez et al. (2015b) Gonzalez J.-F., Laibe G., Maddison S. T., Pinte C., Ménard F., 2015b, MNRAS, 454, L36
- Gonzalez et al. (2017a) Gonzalez J.-F., Laibe G., Maddison S. T., 2017a, MNRAS, 467, 1984
- Gonzalez et al. (2017b) Gonzalez J. F., Laibe G., Maddison S. T., 2017b, MNRAS, 472, 1162
- Güttler et al. (2010) Güttler C., Blum J., Zsom A., Ormel C. W., Dullemond C. P., 2010, A&A, 513, A56
- Hellmann et al. (2017) Hellmann J. L., Kruijer T. S., Kleine T., 2017, in Lunar and Planetary Science Conference. p. 2046
- Hughes et al. (2007) Hughes A. M., Wilner D. J., Calvet N., D’Alessio P., Claussen M. J., Hogerheijde M. R., 2007, ApJ, 664, 536
- Hughes et al. (2008) Hughes A. M., Wilner D. J., Qi C., Hogerheijde M. R., 2008, ApJ, 678, 1119
- Jacquet (2014) Jacquet E., 2014, Icarus, 232, 176
- Jacquet et al. (2012) Jacquet E., Gounelle M., Fromang S., 2012, ICARUS, 220, 162
- Johansen et al. (2007) Johansen A., Oishi J. S., Mac Low M.-M., Klahr H., Henning T., Youdin A., 2007, nature, 448, 1022
- Johansen et al. (2008) Johansen A., Brauer F., Dullemond C., Klahr H., Henning T., 2008, A&A, 486, 597
- Kataoka et al. (2013) Kataoka A., Tanaka H., Okuzumi S., Wada K., 2013, A&A, 557, L4
- Keller & Gail (2004) Keller C., Gail H.-P., 2004, A&A, 415, 1177
- Kleine et al. (2009) Kleine T., et al., 2009, Geochimica Cosmochimica Acta, 73, 5150
- Kretke & Lin (2007) Kretke K. A., Lin D. N. C., 2007, ApJl, 664, L55
- Krot et al. (2015) Krot A. N., Nagashima K., Alexander C. M. O., Ciesla F. J., Fujiya W., Bonal L., 2015, Sources of Water and Aqueous Activity on the Chondrite Parent Asteroids. pp 635–660, doi:10.2458/azu˙uapress˙9780816532131-ch033
- Krzyzanowski et al. (2010) Krzyzanowski M., Beynon J. H., Farrugia D. C., 2010, Oxide scale behavior in high temperature metal processing. John Wiley & Sons
- Kuebler et al. (1999) Kuebler K. E., McSween H. Y., Carlson W. D., Hirsch D., 1999, ICARUS, 141, 96
- Laibe (2014) Laibe G., 2014, MNRAS, 437, 3037
- Laibe & Price (2012) Laibe G., Price D. J., 2012, MNRAS, 420, 2345
- Laibe et al. (2008) Laibe G., Gonzalez J.-F., Fouchet L., Maddison S. T., 2008, A&A, 487, 265
- Laibe et al. (2012) Laibe G., Gonzalez J.-F., Maddison S. T., 2012, A&A, 537, A61
- Laibe et al. (2014a) Laibe G., Gonzalez J.-F., Maddison S. T., 2014a, MNRAS, 437, 3025
- Laibe et al. (2014b) Laibe G., Gonzalez J.-F., Maddison S. T., Crespe E., 2014b, MNRAS, 437, 3055
- Larimer (1973) Larimer J. W., 1973, Geochimica Cosmochimica Acta, 37, 1603
- Larimer & Anders (1970) Larimer J. W., Anders E., 1970, Geochimica et Cosmochimica Acta, 34, 367
- Lewis (1974) Lewis J. S., 1974, Science, 186, 440
- Liffman (2005) Liffman K., 2005, Meteoritics and Planetary Science, 40, 123
- Lodders (2003) Lodders K., 2003, ApJ, 591, 1220
- Mavko et al. (2009) Mavko G., Mukerji T., Dvorkin J., 2009, The rock physics handbook: Tools for seismic analysis of porous media. Cambridge university press
- Menu et al. (2014) Menu J., et al., 2014, A&A, 564, A93
- Meru et al. (2013) Meru F., Geretshauser R. J., Schäfer C., Speith R., Kley W., 2013, MNRAS, 435, 2371
- Monaghan (1989) Monaghan J. J., 1989, Journal of Computational Physics, 82, 1
- Nittler et al. (2011) Nittler L. R., et al., 2011, Science, 333, 1847
- Paardekooper & Mellema (2004) Paardekooper S.-J., Mellema G., 2004, A&A, 425, L9
- Patnaik (2003) Patnaik P., 2003, Handbook of Inorganic Chemicals. McGraw-Hill handbooks, McGraw-Hill, https://books.google.fr/books?id=Xqj-TTzkvTEC
- Pignatale et al. (2016) Pignatale F. C., Liffman K., Maddison S. T., Brooks G., 2016, MNRAS, 457, 1359
- Pignatale et al. (2017) Pignatale F. C., Gonzalez J.-F., Cuello N., Bourdon B., Fitoussi C., 2017, MNRAS, 469, 237
- Pinilla et al. (2012) Pinilla P., Birnstiel T., Ricci L., Dullemond C. P., Uribe A. L., Testi L., Natta A., 2012, A&A, 538, A114
- Pinte et al. (2007) Pinte C., Fouchet L., Ménard F., Gonzalez J.-F., Duchêne G., 2007, A&A, 469, 963
- Pinte et al. (2016) Pinte C., Dent W. R. F., Ménard F., Hales A., Hill T., Cortes P., de Gregorio-Monsalvo I., 2016, ApJ, 816, 25
- Righter et al. (2006) Righter K., Drake M. J., Scott E. R. D., 2006, Compositional Relationships Between Meteorites and Terrestrial Planets. pp 803–828
- Rolls & De Bruin (1972) Rolls J., De Bruin H., 1972, Journal of Crystal Growth, 16, 235
- Rubin (1989) Rubin A. E., 1989, Meteoritics, 24, 179
- Saito & Sirono (2011) Saito E., Sirono S.-i., 2011, ApJ, 728, 20
- Schneider et al. (2003) Schneider D. M., Benoit P. H., Kracher A., Sears D. W. G., 2003, Geophys. Res. Lett., 30, 1420
- Scott (2007) Scott E. R. D., 2007, Annual Review of Earth and Planetary Sciences, 35, 577
- Scott & Krot (2003) Scott E. R. D., Krot A. N., 2003, Treatise on Geochemistry, 1, 143
- Shakura & Sunyaev (1973) Shakura N. I., Sunyaev R. A., 1973, A&A, 24, 337
- Stepinski & Valageas (1997) Stepinski T. F., Valageas P., 1997, A&A, 319, 1007
- Sugiura & Fujiya (2014) Sugiura N., Fujiya W., 2014, Meteoritics and Planetary Science, 49, 772
- Teiser & Wurm (2009) Teiser J., Wurm G., 2009, MNRAS, 393, 1584
- Testi et al. (2015) Testi L., et al., 2015, ApJ, 812, L38
- Villeneuve et al. (2009) Villeneuve J., Chaussidon M., Libourel G., 2009, Science, 325, 985
- Vinković (2014) Vinković D., 2014, A&A, 566, A117
- Wada et al. (2009) Wada K., Tanaka H., Suyama T., Kimura H., Yamamoto T., 2009, ApJ, 702, 1490
- Wada et al. (2013) Wada K., Tanaka H., Okuzumi S., Kobayashi H., Suyama T., Kimura H., Yamamoto T., 2013, A&A, 559, A62
- Wasson (1972) Wasson J. T., 1972, Reviews of Geophysics and Space Physics, 10, 711
- Weidenschilling (1977) Weidenschilling S. J., 1977, MNRAS, 180, 57
- Wilner et al. (2000) Wilner D. J., Ho P. T. P., Kastner J. H., Rodríguez L. F., 2000, ApJl, 534, L101
- Wilner et al. (2003) Wilner D. J., Bourke T. L., Wright C. M., Jørgensen J. K., van Dishoeck E. F., Wong T., 2003, ApJ, 596, 597
- Wurm et al. (2010) Wurm G., Teiser J., Bischoff A., Haack H., Roszjar J., 2010, Icarus, 208, 482
- Wurm et al. (2013) Wurm G., Trieloff M., Rauer H., 2013, ApJ, 769, 78
- Yamamoto et al. (2014) Yamamoto T., Kadono T., Wada K., 2014, ApJl, 783, L36
- Zsom et al. (2010) Zsom A., Ormel C. W., Güttler C., Blum J., Dullemond C. P., 2010, A&A, 513, A57
- van Boekel et al. (2017) van Boekel R., et al., 2017, ApJ, 837, 132
Appendix A Testing resolutions
In this appendix we verify our resulting dust behaviour against a higher resolution (400,000 total particles). At the time of injection we have 39,877 silicate particles, 11,780 wustite particles, 12,146 sulfide particles and 136,197 ice particles for a total of 200,000 dust particles. The ratios are Fe/Si=0.60 and rock/ice=0.468.
In Figures 13 and 14 we compare the results for the G case presented in the main sections (250,000 particles) and the results retrieved from this new simulation of the G case with 400,000 particles. For completeness, we also add, for the G case, a shorter run with a lower resolution (150,000 particles). In this lower-res simulation we have 14,953 silicate-, 4,413 wustite-, 4,544 sulfide- and 51,090 ice-particle, returning a Fe/Si=0.60 and rock/ice=0.468.
In Figures 15 and 16 we compare the results for the GF case presented in the main sections (250,000 particles) and the results retrieved from this new simulation of the GF case with 400,000 particles. Given the longer computational time required these simulations run up to yr.
Similarly to figures 6 and 8, we report the time evolution of the total dust mass content normalised to the initial mass for the disc surface and midplane (Fig. 13 and 15) and the time evolution of the size for single species in the disc surface and midplane (Fig. 14 and 16).
We find a very similar and consistent behaviour when comparing the low- and high-resolution of the two (G and GF) simulations. All the general trends and behaviour found in the main sections of this work are preserved. This demonstrate that the resolution does not change the overall results and their interpretation.
Finally, we test our 250,000 particles GF simulation against the resolution criterion () proposed by Laibe & Price (2012). Results are reported in Fig. 17, showing that the criterion is satisfied.