Effect of the Surface Diffusion and Evaporation of Impurities on Step Bunching Induced by Impurities
Abstract
We consider a vicinal face, where atoms and impurities impinge and evaporate to a vapor phase, to study how the surface diffusion and evaporation of impurities affect step bunching induced by impurities. When the lifetime of impurities on the vicinal face is long and the surface diffusion of impurities is neglected, the step bunches induced by impurities are tight. When decreases, the size of the step bunches, which means the number of steps in the bunches, decreases but the separation of single steps from bunches does not occur. When we take into account fast surface diffusion of impurities, the separation and collision between single steps and step bunches occur repeatedly.
pacs:
61.50.Ah, 81.15.Aa ,81.10.AjI Introduction
Step bunching is well-known to be induced by impurities. Many groups have studied the theory underlying step bunching cv ; Frank ; Eerden1986prl57 ; Kandel92prl69 ; Kandel-w94prl49_5554 ; Krug-epl2002 ; Vollmer08njp053017 ; Ranganathan-w13pre055503 ; Ranganathan-w2014jcg393-35 ; Ltsuko-2014cgd6129 ; Ltsuko-2016prl015501 ; Sleutel-ld2018cgd18_171 . By assuming that the velocity of a single step decreases with increasing the impurity density on a surface, Frank Frank was able to explain why step bunching is caused by impurities. In that model, the impurity density increases until advancing steps refresh the surface. The time evolution of the number of steps in bunches during the step bunching was studied using a one-dimensional model Eerden1986prl57 ; Kandel92prl69 , in which the dependence of the step velocity on the terrace width was assumed empirically. From Monte Carlo simulations, Weeks and co-workers Kandel-w94prl49_5554 ; Ranganathan-w13pre055503 ; Ranganathan-w2014jcg393-35 were able to study two-dimensional step motion and showed that mesh-like step bunch patterns are formed by step bunching. In their model, the effect of impurities is taken into account as a reduction in the probability of step advancing. Sluetel and co-workers Ltsuko-2016prl015501 also studied step bunching induced by impurities using another type of model. They showed that macrosteps formed by impurities can advance under high impurity conditions in which elementary steps cannot advance.
Those models used in the previous studies cv ; Frank ; Eerden1986prl57 ; Kandel92prl69 ; Kandel-w94prl49_5554 ; Krug-epl2002 ; Vollmer08njp053017 ; Ranganathan-w13pre055503 ; Ranganathan-w2014jcg393-35 ; Ltsuko-2014cgd6129 ; Ltsuko-2016prl015501 ; Sleutel-ld2018cgd18_171 are simple and useful, but the surface diffusion field formed by adatoms is neglected and motions of impurities are not taken into account concretely. Therefore, we developed a model in which those processes were adopted and studied the step bunching induced by impurities performing Monte Carlo simulations msato-jpsj2017 ; ms2018pre . We suppose that both atoms and impurities impinge from a vapor phase to a vicinal face with impingement rates and , respectively. We assume that impurities are contained in materials with a constant ratio. Under that assumption, the ratio of to should be kept constant if changes. Therefore, we kept constant in our simulations. In our previous studies msato-jpsj2017 ; ms2018pre , we neglected the surface diffusion of impurities and studied how step bunching induced by impurities depends on . When neither impurities nor adatoms evaporate from a vicinal face msato-jpsj2017 , step bunching is caused by small . The impurity density on the surface increases when step bunches are formed. We also studied step bunching in two other systems: one is the system in which only impurities evaporate, and the other is the system in which both atoms and impurities evaporate ms2018pre . When only impurities evaporate, the step bunching is induced by small , which is the same as that in the system where neither impurities nor adatoms evaporate msato-jpsj2017 . When large bunches are formed, increases but the density of impurities incorporated in solid decreases. When both impurities and adatoms evaporate, and increase because of step bunching.
Separation of single steps from bunches did not occur in our previous studies msato-jpsj2017 ; ms2018pre . We wondered why the separation of steps, which is observed during step bunching in other systems sato-u-prb11172_51_1995 ; sato-u-ss318_442_1999 ; sato-u-ss494_493_2001 , does not occur in our previous simulations for impurity-induced step bunching msato-jpsj2017 ; ms2018pre . We suggest that the separation of single steps may occur repeatedly when we change the lifetime of impurities or take into account the surface diffusion of impurities. Therefore, in our study, we performed Monte Carlo simulations and studied the effects of both the surface diffusion of impurities and the lifetime of impurities on the separation of single steps. In Sec. II, we introduce our model, in which we add the surface diffusion of impurities to our previous model ms2018pre . In Sec. III, we show the results of our simulations. In Ref. Vladimirova01prb245420, , the difference in the Ehrich-Schwoebel barrier Ehrlich-H ; Schwoebel-s between dimers and monomers causes step bunching during growth. In that study, the distribution of terrace width changes with the variation in the impingement rate of monomers, the coefficient of diffusion of monomers, and the average terrace width on a vicinal face. Although the cause of step bunching is different in our model, we show that the distribution of terrace widths changes by controlling parameters even in our system. In Sec. III.1, we show the dependence of the form of step bunches on . In Sec. III.2, we show the relationship between the separation of steps and the frequency of the surface diffusion of impurities. In Sec. IV, we summarize our results.
II Model
In general, kinetic Monte Carlo simulations are based on implementing a set of events with given rates. We just have to perform the events according to the rates. However, we adopted another approach used in previous studies Uwaha-Saito92prl224 ; Uwaha-Saito93ss366 ; Uwaha-Saito93jcg82 ; Saito-u94prb10677 . This approach is not effective but it is easy to consider the correspondence with the Burton–Cabrera–Frank (BCF) model Frank . We discretize the diffusion equation of adatoms and consider particles hopping on a lattice, which correspond to adatoms. Hopping of particles, and solidification and melting at steps occur probabilistically. Because solid atoms and adatoms are distinguished in the model, we can define the step stiffness and the equilibrium adatom density independently. We modify the models adopted in our previous studies msato-jpsj2017 ; ms2018pre and conduct Monte Carlo simulations.
We consider a square lattice, in which the lattice constant is unity. The system lengths in the and -directions are denoted by and , respectively. We use a periodic boundary condition in the -direction and a helical boundary condition in the -direction. Initially, straight steps are set parallel to the -axis. The steps advance to the -direction during growth. For simplicity, we forbid two-dimensional nucleation on terraces.
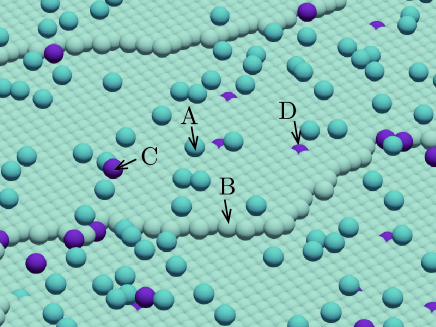
In our simulation, we choose adatoms, impurities on surface, or solid atoms having empty neighboring sites in the horizontal direction, and try surface diffusion of both adatoms and impurities, solidification of adatoms, or melting of solid atoms. When we choose either an adatom such as particle (A) in Fig. 1 or an impurity on the surface such as particle (C) in Fig. 1, we first try the evaporation of the chosen particle. If it does not evaporate, we next try its surface diffusion. As a surface diffusion trial of an adatom, we try to move an adatom to one of its four neighboring sites, where the moving probability is for each site. When the selected site is already occupied by an impurity or an adatom, we do not move the selected adatom and make it stay at the same site. Because we set the coefficient of diffusion for adatoms to unity, the time increase in a diffusion trial of an adatom is given by , where is the number of adatoms. We assume that the coefficient of the surface diffusion of impurities is smaller than . The rule for the surface diffusion of impurities is the same as that of adatoms except that we determine whether we try the surface diffusion of impurities with a probability . Because the steps are permeable in our model Sato-us00prb8452 , both adatoms and impurities can diffuse on the surface over the steps.
We solidify adatoms when they attach to a step after a diffusion trial. The solidification probability for adatoms is given by
| (1) |
where represents the change in the step energy, the change in the chemical potential by solidification per an adatom, the Boltzmann constant, and temperature. When an adatom attaches to solid atoms in the horizontal direction, is given by , where is the bonding energy per one bond. For simplicity, we forbid the formation of multi-height steps.
We do not solidify impurities but regard that impurities as incorporated into the solid phase when all their neighboring sites are occupied by solid atoms and impurities such as particle (D) in Fig. 1. The impurities incorporated into the solid phase cannot diffuse on a surface nor evaporate unless one or more of the neighboring sites get empty. We assume that the surface diffusion of both adatoms and impurities on the impurities incorporated into the solid phase is possible.
The lifetimes of adatoms and impurities on a vicinal face are given by and , respectively. They are related to the evaporation probability of adatoms and that of impurities as and . After some evaporation and diffusion trials, impurities and atoms impinge on the sites, which are not occupied by other particles, at random with the impingement rates and , respectively. When impurities are contained in raw materials, the ratio of to is probably kept constant even if changes. Therefore, we performed simulations keeping constant
We also try melting of solid atoms, for example particle (B) in Fig. 1, which is a solid atom having an empty neighboring site at least and no adatom on it. When a melting trial succeeds, the melted atom stays on the same site as an adatom. The melting probability is given by
| (2) |
The frequencies of solidification and melting trials are the same at kink sites, where in equilibrium. Because the equilibrium adatom density satisfies at the kink sites, is given by Saito-u94prb10677
| (3) |
For small step fluctuations, the step stiffness , which represents the increase in the step free energy by step fluctuation, can be estimated in our model. When we assume that the step position is a single function of because of a small step fluctuation, the difference in the step position between neighboring sites is related to the step stiffness as Saito-u94prb10677
| (4) |
where is the ensemble average of . Because is as large as the average kink density for small step fluctuations, small means the formation of many kinks.
III Results of simulations
We set the system size to and the number of steps to 16 in our simulations. Initially, the steps are straight and equidistant. The initial number of adatoms is roughly equal to that in equilibrium and impurities are not present on the vicinal face. We set and , which are the same as those used in our previous study ms2018pre . Because the capillary length, which is given by , is estimated to be , there are many kinks on the steps. The adatom density under an equilibrium condition is low in the simulation system because is set to . Other parameters, , , and are set to , , and , respectively.
III.1 Dependence of step bunching on the lifetime of impurities
In our previous study ms2018pre with large lifetimes of impurities, stable step bunches are formed and the separation of single steps from bunches, which occurs in other systems sato-u-prb11172_51_1995 ; sato-u-ss318_442_1999 ; sato-u-ss494_493_2001 , is not observed. We think that the separation of steps may repeatedly occur when is small. Hence, we neglect the surface diffusion of impurities for simplicity and study how behaviors of step bunches change by decreasing .
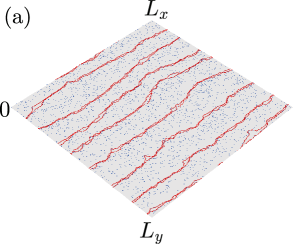
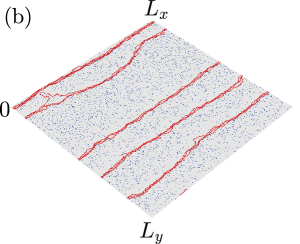
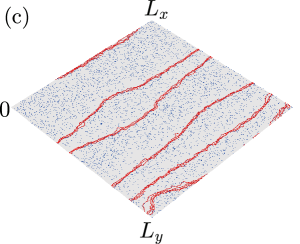
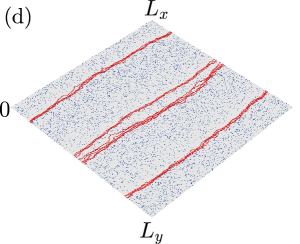
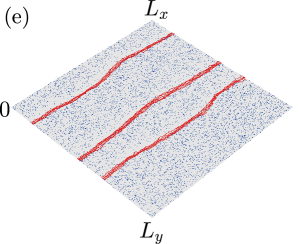
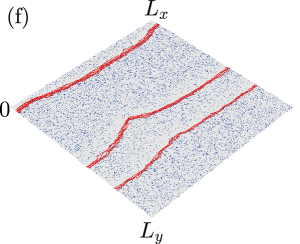
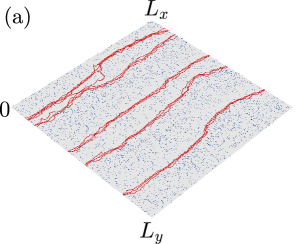
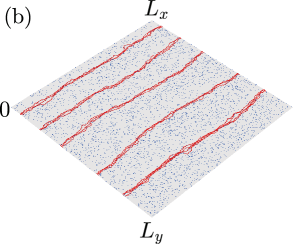
Figure 2 shows snapshots of surfaces in late stages of step bunching for various , where large bunches are formed and no single steps are seen on large terraces. The bunch size , which means the number of steps in a bunch, decreases with decreasing . As step bunches are straight in each case, we average the step positions in the -direction and see the time evolution of the average step positions.
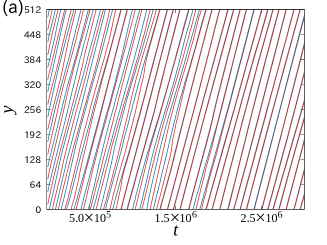
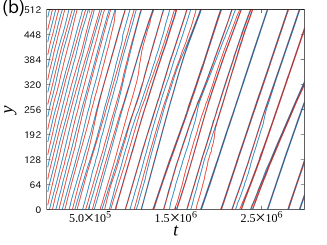
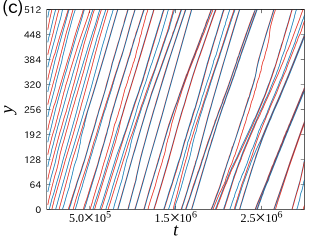
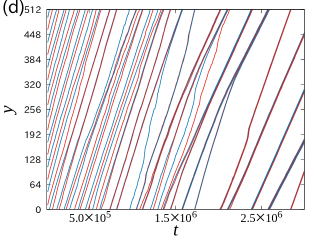
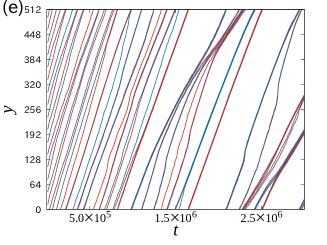
Figures 3(a)–(f) show the time evolution of average step positions for the samples used in Figs. 2(a)–(f), respectively. The initial equispaced steps are unstable against step fluctuations and small bunches form in the early stages. The bunch size increases with the collision of small bunches. Single steps temporarily appear because of the collisions of bunches in the early stages, but the single steps are rarely seen in the late stage. Because we might see rare cases in Figs. 2 and 3, we try ten individual runs for each and study how the number of isolated steps decreases and increases with time.
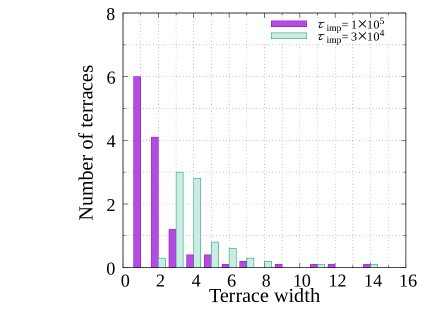
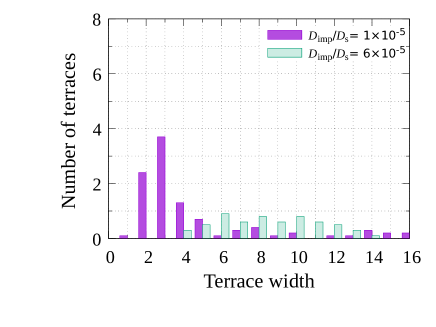
Figure 4 shows the distributions of terrace widths that are smaller than 16 for and . The number of small terraces increases with increasing As seems to increase with increasing in Fig 2, the bunch becomes tight with increasing . We regard steps as isolated when their upper side terrace and lower side terrace are longer than a critical width . Because the number of terraces for which the width is wider than six is small in Fig. 4, we set to six hereinafter.

When we use this criterion, the average step distance in bunches decreases with increasing (Fig. 5).
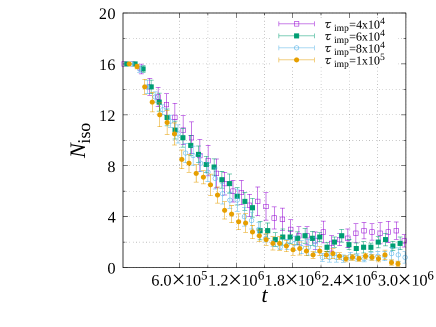
Figure 6 shows the time dependence of . With increasing time, decreases and is just one or two in the systems in the last stage.
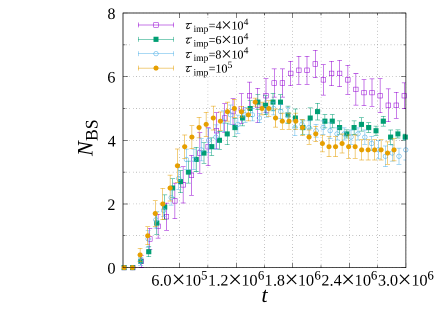
Figure 7 shows how the average number of bunches in systems depends on time. As single steps gather and small bunches forms, increases with time in the initial stages. However, decreases with time in the later stages because increases from the collision of bunches and seems to saturate in the last stage.
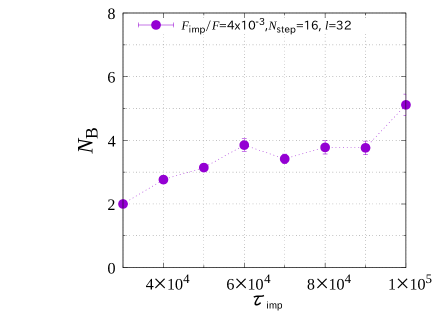
In Fig. 8, we show the dependence of in the last stage on . Although the change in is small in our simulation range of because of the limited system size, increases with increasing .


The adatom density on surface and the ratio of impurities incorporated into solid to solidified atoms in the last stage depend on ; see Figs. 9 and 10. Both and increase with increasing . In our previous paper ms2018pre , we supposed the impurity density obeys
| (5) |
We assumed that bunches with size are formed equidistantly and that the separation of steps from bunches does not occur. The incorporation of impurities in the solid phase occurs by advancing the lowest steps in bunches. When the distance between bunches is longer than the surface diffusion length, is given by
| (6) |
where is the atomic area, the step distance in a vicinal face, the surface diffusion length defined as , the lifetime of adatoms, and is given by . In our simulations, and , so that is estimated to be . The prefactor in front of the parenthesis mainly changes because the exponential term on the right-hand side of Eq. (6) is negligibly small. As the change in is small in our simulation, the change in mainly is caused by .
III.2 Dependence of step bunching on the coefficients of surface diffusion
Next, we changed and studied how surface diffusion of impurities affects the step bunching induced by impurities.

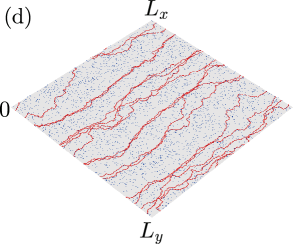
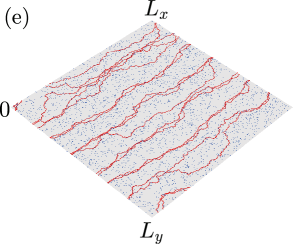
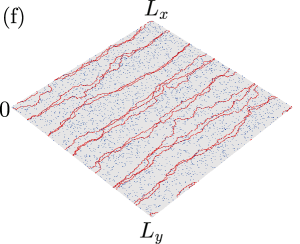
We set the diffusion of adatoms to be much faster than that of impurities and performed simulations. Figure 11 shows snapshots of the step bunches formed by impurities. The ratio is changed from to . seems to decrease with increasing . From the snapshots, step bunching without the surface diffusion of impurities is not much different from that with the surface diffusion of impurities. However, the difference in the process of step bunching between these two cases is obvious from the time evolution of average step positions (Fig. 12).
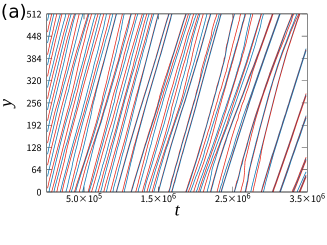
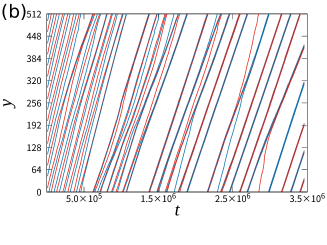
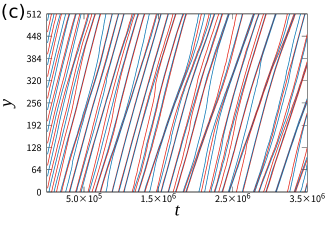
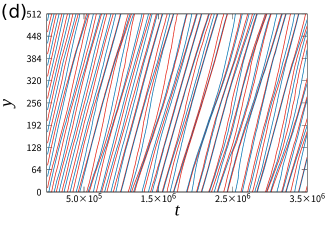
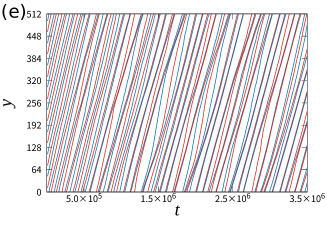
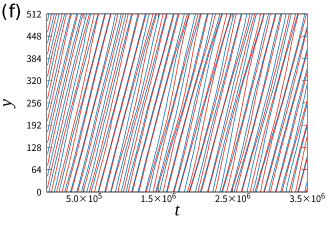
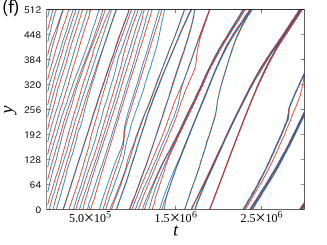
Figures 12(a)–(f) show the time evolution of the average step positions for the samples in obtaining Figs. 11(a)–(f), respectively. Small bunches are formed in an early stage in Figs. 12(a) and (b). The bunches gather and large bunches separated by large terraces are formed in the last stage. The process of forming large bunches seems to be almost the same as that observed in Fig. 3. However, the separation and collision of single steps occur in a later stage in Figs. 12(c)–(f). In particular, large bunches are not formed in Figs. 12 (e) and (f). The separation and collision between small bunches and single steps are frequently repeated.
They affect the distribution of terrace widths. Because of the separation and collision of steps, not only the average terrace width becomes large but also the distribution of terrace widths becomes broad (Fig. 13).

Figure 14 shows the dependence of on , where is the same as that used in Fig. 6. increases with increasing and seems to saturate in a large region, where the separation and collision of steps frequently occur. The saturated value of is larger than the maximum value of in Fig. 5.
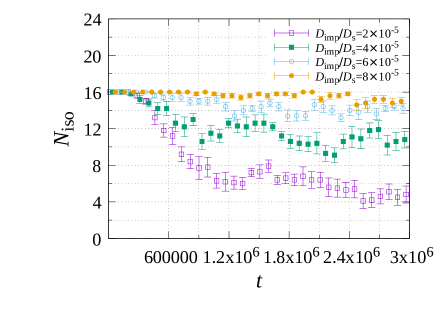
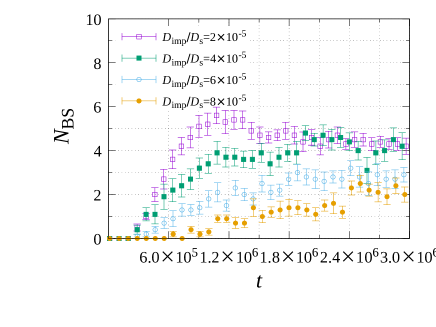
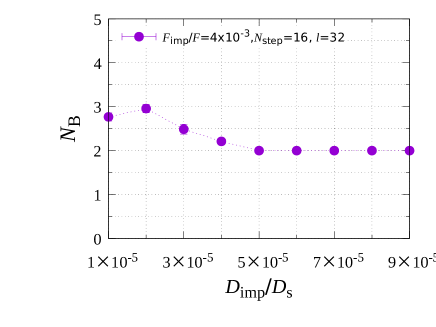
We analyze the properties of step bunches in more details. Figure 15 shows the time dependence of for some . decreases with increasing time due to the formation of step bunches but in the last stage increases with increasing . Almost all the steps are single steps when . The time evolution of is opposite to that of (Fig. 16): increases with increasing time and the saturated value in the last stage decreases with increasing (Fig. 17), in which the final value of is not more than three. From Figs. 15–17, we find that a few small bunches form and step separation frequently occurs when is large.


We show how , , and the growth rate of a vicinal face, , depend on in Figs. 18, 19, and 20, respectively. From Figs. 12(a) and (b), we find that the separation and collision of single steps hardly occur when and . The surface diffusion of impurities is slow in these cases, so that the impurities in front of the step bunches prevent the lowest steps in the step bunches from advancing faster than the other steps in the bunches. Therefore the separation of steps from bunches does not occur, and is large because almost all the impurities in front of the step bunches are incorporated into the solid when the step bunches advance. When is large, the impurities in front of the step bunches move away though surface diffusion before being incorporated into the solid. The effect that the impurities prevent the lowest steps from advancing is weakened. The impurities in front of the step bunches also move in the step bunches. These impurities prevent the steps in bunches from catching up to the lowest steps. Hence, separation of steps from step bunches becomes possible. When this separation, increases as separated steps move faster than step bunches, and decreases because the impurities swept by the separated steps increases. However, when increases further, so many impurities move away before being incorporated into solid at single steps. Therefore, increases again and decreases.
IV Summary
We performed Monte Carlo simulations and studied the effects of both the evaporation and diffusion of impurities on step bunching induced by impurities. When we take into account the evaporation of impurities and neglect the surface diffusion of impurities, the step bunching proceeds by the collision of small bunches. When the evaporation of impurities increases, the effect of impurities on forming bunches is weakened and the size of bunches decreases, but the separation of steps from bunches does not occur in this instance.
The surface diffusion of impurities also weakens the effect of impurities on the formation of large bunches, and the separation of single steps occurs. The front of a bunch is the dirtiest area with impurities because the area is exposed to the vapor phase for the longest time. If the lowest step in a bunch tries to escape from the step bunches in the system without surface diffusion of impurities, the second lowest step in the bunch easily catches up with the lowest step because there are few impurities in front of the second lowest step. However, impurities can move even in the step bunch when the surface diffusion of impurities occurs. The impurities coming in front of the second lowest step probably prevent the second lowest step from catching up with the lowest step. Therefore, the lowest step can separate from the step bunch if the surface diffusion of impurities is sufficiently fast. We do not have simulation results showing evidence for the above scenario directly. However, when we take into account Figs. 18–20, we believe the scenario we mentioned above is reasonable in explaining why the separation of steps occurs in the system with the surface diffusion of impurities.
Acknowledgements.
This work is supported by JSPS KAKENHI Grant Numbers JP16K05470, JP18H03839, 18K04960, and the Grant for Joint Research Program of the Institute of Low Temperature Science, Hokkaido University, Grant Number 19G020.References
- (1) N. Cabrera and D. A. Vermilyea, Growth and Perpection of Crystals,, Proceedings of the International Conference, Cooperstown, NY, Wiley, 393 (1958)
- (2) W. K. Burton, N. Cabrera, and F. C. Frank, Philos. Trans. R. Soc. London, Ser. A 243, 299 (1951).
- (3) J. P. v. d. Eerden and H. Müller-Krumbhaar, Phys. Rev. Lett. 57, 2431 (1986).
- (4) D. Kandel and J. D. Weeks, Phys. Rev. Lett. 69, 3758 (1992).
- (5) D. Kandel and J. D. Weeks, Phys. Rev. B 49, 5554 (1994).
- (6) J. Krug, Euro. Phys. Lett. 60, 788 (2002).
- (7) J. Vollmer, J. Hegedüs, F. Grosse, and J. Krug, New J. Phys. 10, 053017 (2008).
- (8) M. Ranganathan and J. D. Weeks, Phys. Rev. Lett. 110, 055503 (2013).
- (9) M. Ranganathan and J. D. Weeks, J. Cryst. Growth, 393, 35 (2014).
- (10) J. F. Lutsuko, N. Gonzáles-Segredo, M. A. Durán-Olivencia, A. E. S. Van Driessche, and M. Sleutel, Cryst. Growth Des. 14, 6129 (2014).
- (11) J. F. Lutsko, A. E. S. Van Driessche, and M. A. Durán-Olivencia, D. Maes, and M. Sleutel, Phys. Rev. Lett. 116, 015501 (2016).
- (12) M. Sleutel, J. Lutsko, and A. E. S. Van Driessche, Cryst. Growth Des. 18, 171 (2018).
- (13) M. Sato, J. Phys. Soc. Jpn. 86, 114603 (2017)
- (14) M. Sato, Phys. Rev. E 97, 062801 (2018) .
- (15) M. Sato and M. Uwaha, Phys. Rev B 51 11172 (1995).
- (16) M. Sato and M. Uwaha, Surf. Sci. 442 318 (1999).
- (17) M. Sato and M. Uwaha, Surf. Sci. 493 494 (2001).
- (18) M. Vladimirova, A. De Vita, and A. Pimpinelli, Phys. Rev. B 64, 245420 (2001).
- (19) G. Ehrlich and F. G. Hudda, J. Chem. Phys. 4, 1039 (1966).
- (20) R. L. Schwoebel, J. Appl. Phys. 40, 614 (1969).
- (21) M. Uwaha and Y. Saito, Phys. Rev. Lett. 68, 224 (1992).
- (22) M. Uwaha and Y. Saito, Surf. Sci. 283, 366 (1993).
- (23) Y. Saito, T. Sakiyama, and M. Uwaha, J. Cryst. Growth . 128, 82 (1993).
- (24) Y. Saito and M. Uwaha, Phys. Rev. B 49, 10677 (1994) .
- (25) M. Sato, M. Uwaha and Y. Saito, Phys. Rev. B 62 8452 (2000).