The Redshift Evolution of Rest-UV Spectroscopic Properties to z5
Abstract
We perform a comprehensive analysis of the redshift evolution of the rest-UV spectra of star-forming galaxies out to . We combine new measurements of HI Ly and low- and high-ionization interstellar metal absorption features with comparable measurements at . We measure the equivalent widths of interstellar absorption features using stacked spectra in bins of Ly equivalent width, performing corrections to Ly strengths based on a model for the transmission of the intergalactic medium. We find a strong correlation between decreasing low-ionization absorption strength and increasing Ly emission strength over the redshift range , suggesting that both of these quantities are fundamentally linked to neutral gas covering fraction. At the highest Ly equivalent widths, we observe evolution at towards greater Ly emission strength at fixed low-ionization absorption strength. If we interpret the non-evolving relationship of Ly emission strength and low-ionization line strength at as primarily reflecting the radiative transfer of Ly photons, this evolution at suggests a higher intrinsic production rate of Ly photons than at lower redshift. Our conclusion is supported by the joint evolution of the relationships among Ly emission strength, interstellar absorption strength, and dust reddening. We perform additional analysis in bins of stellar mass, star-formation rate, UV luminosity, and age, examining how the relationships between galaxy properties and Ly emission evolve towards higher redshift. We conclude that increasing intrinsic Ly photon production and strong detection of nebular C iv emission (signaling lower metallicity) at indicate an elevated ionized photon production efficiency ().
keywords:
galaxies: evolution – galaxies: high-redshift – galaxies: ISM1 Introduction
The rest-UV spectrum of a star-forming galaxy provides a uniquely rich probe of the properties of massive stars and the interstellar and circumgalactic medium (ISM and CGM; Shapley et al., 2003; Steidel et al., 2010, 2016; Leitherer et al., 2011; Senchyna et al., 2019). Understanding the interplay between these components is important for placing constraints on galaxy evolution across cosmic time. Furthermore, the gas in and around distant galaxies that is probed by rest-UV spectra also modulates the escape of ionization radiation. This gas provides important clues to the process of cosmic reionization, a key phase transition in which the intergalactic medium (IGM) transformed from neutral to ionized by roughly a billion years after the Big Bang at (Fan et al., 2006; Robertson et al., 2015; Planck Collaboration et al., 2016).
Measuring the rest-UV spectra of distant galaxies requires optical instrumentation and long integrations. Based on observations with instruments such as the Low Resolution Imager and Spectrometer (LRIS) on the Keck I telescope (Oke et al., 1995; Steidel et al., 2004), there have been several analyses of the relationships between rest-UV spectral features and other galaxy properties out to (e.g., Du et al., 2018; Jones et al., 2012; Marchi et al., 2019). Du et al. (2018) (hereafter, D18) performed a comprehensive evolutionary analysis of rest-UV spectral trends of star forming galaxies from . This analysis centred around the hydrogen Ly line and low- and high-ionization interstellar (LIS and HIS) metal absorption lines, which together probe the neutral gas covering fraction, gas kinematics, and ISM and CGM properties of galaxies. Both D18 and Jones et al. (2012) find a strong and non-evolving correlation between Ly equivalent width (EW) and low-ionization interstellar absorption EW, revealing the connection between escaping Ly photons (and, by extension, ionizing radiation; Reddy et al., 2016; Steidel et al., 2018; Chisholm et al., 2018) and the covering fraction of neutral gas in the CGM. Building on these earlier works, we now seek to probe the rest-UV properties of galaxies at redshifts even closer to the epoch of reionization.
Approaching reionization at , we must attempt to understand how the rest-UV spectrum reveals the changing properties of both massive stars and the ISM/CGM at higher redshift. The evolution of the relationship between Ly emission strength and LIS absorption strength sheds light on the intrinsic production rate of Ly photons in high-redshift galaxies, which in turn probes the intrinisic ionizing-photon production rate. Affecting observations near reionization, the IGM becomes more optically thick to Ly photons and attenuates the spectra of galaxies. We must correct for this attenuation to accurately determine the changing intrinsic production rate of Ly photons. As stated in D18, the Ly-LIS relationship also indicates the changing covering fraction of neutral gas in the CGM at higher redshift. Both intrinsic ionizing-photon production rate and neutral-gas covering fraction are key components of understanding the contribution of star-forming galaxies to the ionizing background during reionization (Robertson et al., 2015; Nakajima et al., 2018; Steidel et al., 2018; Trainor et al., 2019; Chisholm et al., 2018; Chisholm et al., 2019).
The DEIMOS 10K Spectroscopic Survey (Hasinger et al., 2018) provides an ideal dataset for performing this type of analysis, including thousands of galaxies ranging from to with deep, rest-UV spectroscopy. This survey was conducted in the COSMOS field (Scoville et al., 2007), which is covered by extensive broadband photometry enabling the measurement of integrated galaxy properties. In this work, we extend the analysis of D18 to higher redshift by carefully examining a sample of star-forming galaxies drawn from the DEIMOS 10K Spectroscopic Survey. We perform a joint analysis of the new sample with the samples of D18, using consistent methodology across all redshifts to remove any potential systematics.
In Section 2, we introduce our sample of galaxies and the galaxies of D18, and discuss sample completeness, redshift measurements, and spectral energy distribution (SED) fitting. In Section 3, we describe the methodology for measuring the equivalent widths of Ly and interstellar absorption features, and the binning of the sample and subsequent creation of composite spectra. In Section 4, we present the resulting trends of rest-UV spectral features at . In Section 5 we analyze the sample at a finer redshift sampling and discuss the implications of our results for quantifying the changing intrinsic Ly photon production and the contribution of star-forming galaxies to reionization. In Section 6, we summarize our key results and conclude.
Throughout this paper, we adopt a standard CDM cosmology with = 0.3, = 0.7 and = 70 .
2 Sample
2.1 Selection Criteria
We analyzed a sample of galaxies drawn from the DEIMOS 10K Spectroscopic Survey of the COSMOS field (Hasinger et al., 2018; Scoville et al., 2007). This survey provides deep optical spectroscopy taken with the DEep Imaging Multi-Object Spectrograph (DEIMOS) on the Keck II telescope on Mauna Kea. The COSMOS field is covered by a wealth of ancillary data, including multi-wavelength imaging from space-based and ground-based missions. Out of the 10,000 galaxies targeted in the DEIMOS 10K survey, we selected those identified as Lyman break galaxies (LBGs), dropping out in the and optical filters for , and or for . Also included were objects with photometric redshifts between . These criteria yielded a parent sample of 416 star-forming galaxies at high-redshift, 337 selected via dropout and 79 via photometric redshifts.
We further required objects to have high-confidence spectroscopically-confirmed redshifts. The DEIMOS 10K catalog provided a quality flag indicating the confidence level of the spectroscopic-redshift measurement based on the quality of the spectrum and the number of features in the redshift estimate (either Ly or LIS lines). We examined all objects with that satisfied the above photometric criteria, eliminating only those with unsuccessful redshift measurements. From this set of objects, we measured a redshift from the Ly line, LIS lines, or both. We successfully recovered redshifts for 196 objects at . For the purpose of our completeness calculations, from our parent photometric sample of 416 galaxies, we removed galaxies selected by photometric redshift that had measured spectroscopic redshifts , reducing the parent sample to 375.
2.2 Systemic Redshifts
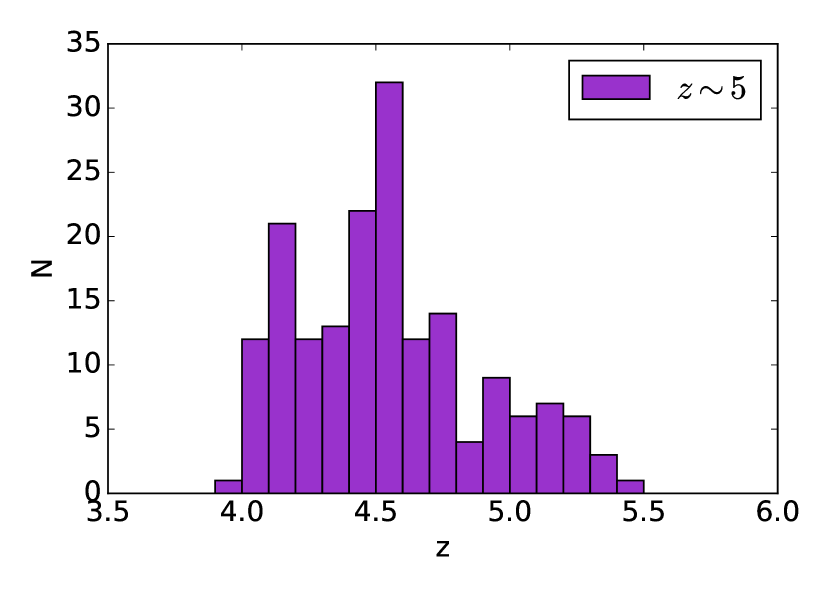
Ideally, rest-optical nebular emission lines would be used to estimate the systemic redshifts of high-redshift galaxies. As these lines are shifted into the thermal infrared at , we measure the redshifts of the spectra via the redshifts of the Ly emission line () and the three strongest LIS absorption features (): Si ii, O iSi ii, and C ii. Using the spectroscopic redshifts provided by DEIMOS 10K, we estimated the central wavelength of each non-resonant line and fit a Gaussian profile to the flux-calibrated spectrum. Each line was visually inspected to confirm the validity of the line detection and corresponding fit. The redshifts based on the central wavelengths of the well-fit Gaussian profiles of the three LIS lines were averaged with weights to calculate . Given the asymmetry of the Ly profile, we did not model it with a Gaussian, but rather calculated based on the wavelength at which the spectrum reached a maximum within the Ly profile. We then determined the systemic redshift using the method described in Rudie et al. (2012). was assumed to be offset from systemic by and by , with these offsets empirically determined by Steidel et al. (2010). While these rules are calculated at , we assume they hold to in the absence of other information. This calculation enabled an estimate of the systemic redshift based on a high-quality measurement of either or . If both and were measured, the systemic redshift was estimated as the average of the two. After combining 14 duplicate spectra, removing four spectra with poorly-fit lines and two spectra with background subtraction issues, we assembled a final sample of 176 objects between : 68 with only, 34 with only, and 74 with both types of redshift measurement. The redshift distribution of the sample is displayed in Figure 1. The median redshift of our sample is , with a 16th–84th percentile range of 4.172–4.930. The redshift uncertainty for each object was calculated using uncertainties on the assumed velocity offsets of Ly and LIS, empirically determined in Steidel et al. (2010). For galaxies with both and measured, we assumed = 175 and = 115 . For galaxies with only measured, we assumed = 165 . For galaxies with only measured, we assumed = 175 . The median of the sample redshifts was 0.002. We refer to this sample as the “ sample” for simplicity and keep this sample distinct from samples featured in D18 to signify a new dataset.
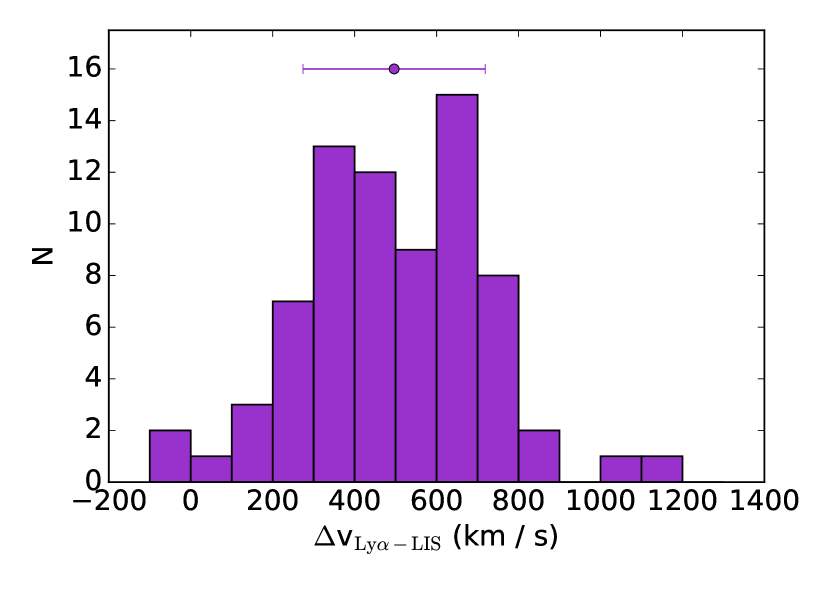
For the objects with both Ly and LIS absorption redshifts measured, we examined the distribution of velocity differences between Ly and LIS lines in Figure 2. This measurement was calculated as
| (1) |
The velocity differences are distributed about a with a standard deviation of 222 . This value is largely consistent with 600 of Steidel et al. (2010) at , and of Faisst et al. (2016) at , the latter using a similar sample drawn from the DEIMOS 10K survey. The distribution of velocity differences of Figure 2 has a similar shape to that of LBGs of Shapley et al. (2003), a sample which has been shown to have similar outflow kinematics to those of the Steidel et al. (2010) sample. This similarity lends credence to our assumption that the outflow velocities calculated at are applicable out to .
2.3 Completeness
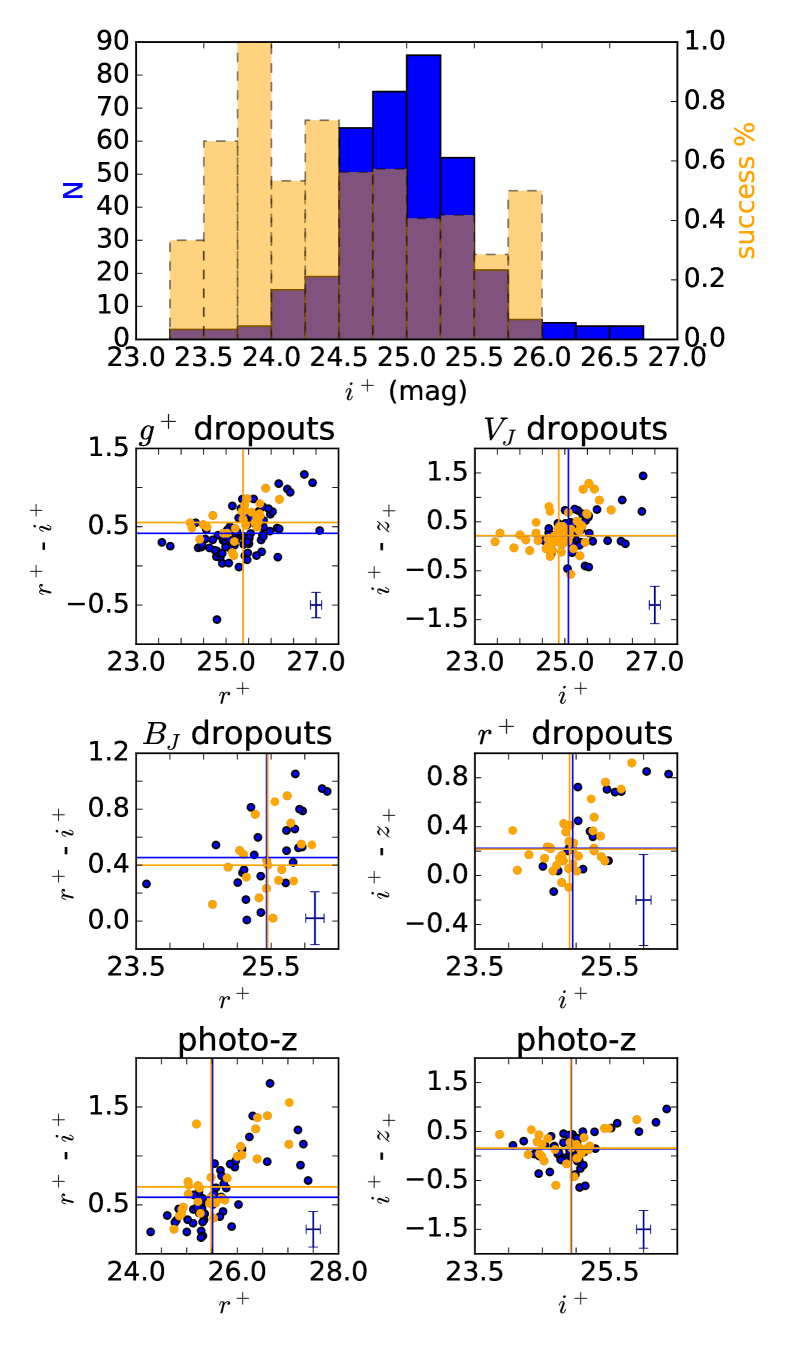
In order to explore the completeness of the COSMOS DEIMOS sample, we examined the number of galaxies in the parent sample that report a high-confidence redshift as a function of brightness. The results of this analysis are illustrated in the top panel of Figure 3, where the total number of galaxies in the parent sample and the percentage of successful redshift measurements are plotted as a function of -band magnitude. At mag, the sample completeness drops below per cent, thus a more careful examination of the sample completeness must be performed.
As described above, spectroscopic redshifts at high redshift are measured using a combination of HI Ly emission and LIS absorption lines of Si ii, O i+Si ii, and C ii. Measuring redshifts requires the robust detections of these lines. Since we explore the variation of the strengths of LIS and HIS absorption as a function of Ly emission strength, strong detections should not bias our results. It is more important to examine whether the galaxies in our spectroscopic sample are representative of the parent photometric sample of star-forming galaxies in terms of other galaxy properties, such as color and brightness. To investigate this issue, we plotted our sample and the parent photometric sample in color-magnitude space in the bottom panels of Figure 3. For the galaxies selected as dropouts, all filters chosen in the color-magnitude diagram are redward of the corresponding dropout filter. For both dropouts and photo-z selected samples, all but two of the deviations in median color are smaller than 0.06 mag, and all but one of the deviations in median magnitude are smaller than 0.05 mag. The lack of significant deviation in the median between our sample and the parent photometric sample demonstrates that the sample is not significantly biased in color and brightness. The most significant deviation (0.22 mag) is between the median -band magnitudes of the dropouts in our sample vs. the parent sample, thus we examined our sample as a function of brightness in detail in section 3.1. We conclude that our spectroscopic sample is not significantly biased towards certain types of star-forming galaxies with respect to the parent photometric sample in the same redshift range.
2.4 sample
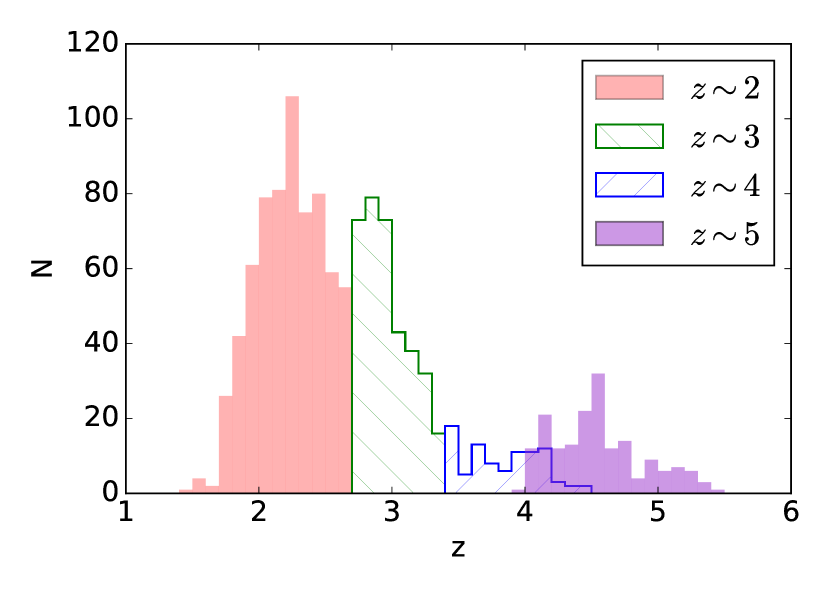
For a lower-redshift comparison sample, we used the LBGs described in D18. The sample consists of galaxies preselected using color cuts and followed up with LRIS on Keck I as part of the redshift surveys described in Steidel et al. (2003), Steidel et al. (2004), and Reddy et al. (2008). The sample was drawn from Jones et al. (2012) and consists of -band dropouts in the GOODS-S field, 42 of which were followed up with DEIMOS on Keck II. In addition, 28 had spectra from the FOcal Reducer and low dispersion Spectograph 2 (FORS2; Vanzella et al., 2005, 2006, 2008, 2009) archival catalog. The average spectral resolutions were 970 and 1280 for the and samples respectively, compared to 2700 for the sample. Systemic redshifts were measured in a similar method to that described above111There was a small difference in the method for estimating systemic redshifts in the case where both and were measured. D18 simply used with an assumed velocity offset instead of averaging the two redshift measurements. In practice, the two estimates are very similar and this small difference in approach does not affect our results., and the sample was divided into three bins of increasing redshift, with 671 objects defined at , 352 objects at , and 80 objects at . The full redshift distribution of the galaxies is displayed in Figure 4. Some overlap does exist between galaxies in the and samples, but they are largely distinct with median redshifts of 3.856 and 4.521, respectively. In Section 5, we search for evolution within the sample by dividing this sample into two distinct redshift bins with and 4.742. We note that the latter of these two more finely-sampled bins does not overlap in redshift space with the sample from Jones et al. (2012).
2.5 SED fits
As we aim to compare spectral trends across a range of redshifts, we wanted to make a controlled comparison between similar types of galaxies at each redshift. To this end, we first made measurements of the galaxy stellar-population properties in each redshift bin via stellar-population synthesis model fits to the galaxy SEDs. We used photometry from the publicly-available catalogs of COSMOS2015 (Laigle et al., 2016) for 171 of our objects, well matched in RA and Dec, and, for four objects, we used the photometric catalog of Capak et al. (2007). For one object, we used the COSMOS Intermediate and Broad Band Photometry Catalog 2008222Available at https://irsa.ipac.caltech.edu/data/COSMOS/ datasets.html, but, as this object did not have sufficient coverage redward of the Balmer break, we removed it from the sample, leaving us with 175 galaxies at .
In our SED fitting, we utilized the Bruzual and Charlot (2003) stellar-population templates and assumed a Chabrier (2003) initial mass function (IMF). As these models do not include emission lines, we omitted the IRAC channel 1 band from the SEDs of galaxies at and the IRAC channel 2 band from the SEDs of galaxies at . This correction removes potential SED contamination by the H and [O III] rest-optical lines. As in D18, we performed the SED fits using a combination of a fixed metallicity of 1.4 times the solar metallicity () and a Calzetti extinction curve (Calzetti et al., 2000), or else a fixed metallicity of 0.28 and an SMC extinction curve (Gordon et al., 2003). This method of SED fitting was initially described in Reddy et al. (2018). The star-formation history was set at either constant or exponentially increasing. The fits were performed with ages 10 Myr allowed, and then with only those 50 Myr. With these different assumptions, we fit for stellar mass (M∗), ages younger than the age of the universe, star-formation rate (SFR), and from 0.00 to 0.60. Given that the quality of the fits of each model was similar, we adopted the best-fitting parameters of 0.28 , SMC attenuation, constant star-formation history, and age 50 Myr models. This choice was motivated by the fact that a sub-solar metallicity with an SMC extinction curve has been demonstrated to fit the IRX- relationship better than other models at (Bouwens et al., 2016; Oesch et al., 2013). Ages were constrained to 50 Myr so as to not be shorter than the typical dynamical timescales of distant star-forming galaxies (assuming a relaxed disk and ignoring the timescsales of local gas motions, Reddy et al., 2012), and a constant SFR was assumed for consistency with past work (Du et al., 2018; Reddy et al., 2012; Steidel et al., 2014; Strom et al., 2017). The SED fitting of the sample in D18 was performed in a similar way. For the galaxies, the 1.4 +Calzetti model was used as they produced overall lower .
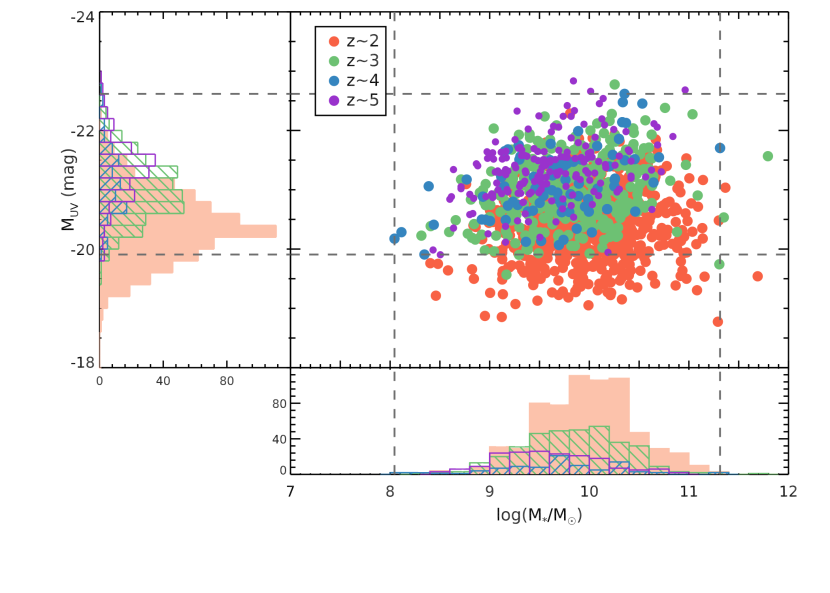
In order to perform a controlled study across redshift of galaxies with comparable properties, we restricted the , 3, 4, and 5 samples to span the same range in stellar mass and rest-UV luminosity. We examined the distribution of M∗ determined by the SED fits and the UV absolute magnitude (MUV) in Figure 5. The MMUV cuts performed in D18 of ( M) and ( log(M∗/M) are displayed as vertical and horizontal lines in the figure. These cuts remove low-luminosity objects in the sample. The M∗ and MUV of the sample span much of the same range as the sample. Since the samples were already truncated to match the sample, we perform no stricter MMUV cut on the and samples. The median MUV and M∗ of each sample within the D18 cuts are recorded in Table 1, along with other median sample properties from the SED fitting. The similarity of the MUV and M∗ medians further motivates that no additional cut is needed. After applying the D18 limits in M∗ and MUV, we find the number of objects in the , 3, 4 and 5 samples are 539, 309, 91 and 175, respectively.
| MUV | log(M∗/M⊙) | Sample Size | |||
|---|---|---|---|---|---|
| 2.267 | -20.51 | 10.00 | 0.09 | 539 | |
| 2.925 | -21.00 | 9.87 | 0.08 | 309 | |
| 3.856 | -21.06 | 9.72 | 0.04 | 91 | |
| 4.521 | -21.33 | 9.80 | 0.05 | 175 |
3 Methods
Our goal is to examine the properties of the rest-UV spectral features of our different samples, including Ly; LIS lines of Si ii, O iSi ii, C ii, and Si ii; and HIS lines of Si iv and C iv. While Ly can be well detected at due to its large typical EW, it is difficult to detect the full suite of LIS and HIS lines in individual spectra, given their typical EWs of Å. Thus, we rely on stacks of spectra in bins of various galaxy properties to reveal the characteristic strengths of the LIS and HIS lines. The Ly line is known to have an important role in a galaxy’s spectrum, strongly correlating with rest-UV spectral morphology (Shapley et al., 2003), motivating its choice as a sorting parameter and the creation of composites in bins of Ly EW. Ly EW, as opposed to Ly luminosity, is normalized to the UV continuum and probes the efficiency of Ly photon production and escape. The methods in this section broadly follow those described in D18. In addition, we consider here for the first time the increasing degree of IGM attenuation on average as a function of increasing redshift, quantifying this effect using the models of Laursen et al. (2011).
3.1 Ly Equivalent Width in Individual Spectra
In order to construct composite spectra spanning a range of Ly EWs, we required an individual measurement of Ly for each object. We used the fitting method of Kornei et al. (2010) to measure Ly EW. First, the rest-frame spectra were examined individually to determine whether the spectrum at 1216Å follows an “emission," “absorption," “combination," or “noise" profile. The large majority of our sample were fit using “emission" or “noise," representing either a positively-peaked, visible feature or no discernible one, with only one object following an “absorption" profile consisting of a trough at 1216Å and four objects following a “combination" profile of a blueside trough and redside peak.
The continuum level was then determined using the following procedure: the redside continuum was calculated as the average of the flux values of the spectrum between 1225Å–1255Å. If the spectrum had coverage blueward of 1120Å, the blueside continuum was estimated as the average of the flux between 1120Å–1180Å. If the spectrum only had coverage down to 1160Å, the blueside continuum was averaged between 1160Å–1180Å. If the spectrum did not have coverage to 1160Å, the blueside continuum value was estimated by multiplying the redside value by the mean ratio of blue-to-red of 0.260, as determined from the remaining 140 objects of the sample with blueside coverage. The blueside continuum is suppressed relative to the redside due to absorption by the IGM. For 14 of the objects, the redside continuum was not well detected, leading to a zero continuum value well within the 1 noise of the spectrum. In order to measure an equivalent width for these galaxies, we estimated the continuum flux photometrically. This estimate was obtained using the best-fitting SED of the object as described in Section 2.5, averaging in the same wavelength window of 1225Å–1255Å. These 14 spectra were also normalized over the wavelength interval 1300Å–1500Å so the continuum estimated from the spectra matched those from the photometry. For the objects with a well-detected continuum, this photometric estimation was also performed and compared to the spectroscopically-determined values to ensure consistency between the measurements.
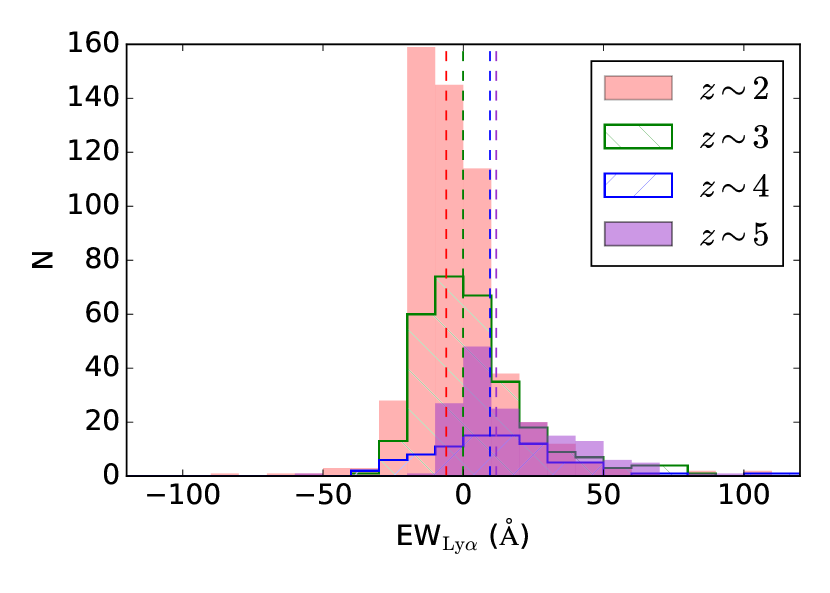
For spectra classified as “emission," “combination," or “absorption," the Ly flux was integrated between the wavelengths at which the full Ly profile intersected the blueside and redside continuum values. For “noise," the spectrum was integrated over a fixed window of 1210–1220 Å. Finally, the equivalent width was measured as the ratio of the integrated Ly flux and the redside-continuum flux density. The Ly EW distribution of the four redshift samples is shown in Figure 6. The median Ly EW of each sample is overplotted on the corresponding histogram as a vertical line, indicating the evolution of the strength of Ly within our four samples of increasing redshift. The sample median Ly EWs are Å, Å, 9.51Å, and 11.75Å for redshifts 2, 3, 4, and 5, respectively. This evolution must be interpreted in the context of the incompleteness of our sample. We find that 38.6 per cent of objects at had a systemic redshift measurement based only , compared to 56.3 per cent at . In past work, a weak evolution of Ly emitting fraction has been found at these redshifts (Stark et al., 2010). We do not find a significant tail in the EWLyα distribution at values less than 0 Å (i.e., absorption) at . However, we argue that, as the sample is not significantly biased in redshift measurement method or color-color space (Figure 3), it is also not significantly biased with respect to the underlying Ly EW distribution – at least compared with . See D18 for a discussion of sample completeness from to .
3.2 Composite Spectra
We first created composite spectra of the spectra in each redshift sample, and then split the samples into bins of various properties and generated composites of the spectra of the objects in each bin.
We generated composite spectra by performing a bootstrapping analysis of the objects in each sample. Based on the number of objects in the sample, we drew the same number of spectra from the bin with replacement. For each draw, we took each individual galaxy spectrum and normalized it to its photometric flux density. We then shifted it into the rest frame in units based on its measured systemic redshift. The rest-frame, spectrum of each object was then perturbed according to a Gaussian distribution with a standard deviation corresponding to the value of the error spectrum at that wavelength. These spectra were combined with the iraf tool using the combination mode “average," with rejection of the three highest and three lowest flux values at each wavelength increment. This bootstrapping was performed 100 times, generating 100 composites, each representing a different sampling of spectra in the bin and reflecting the statistical noise in each individual spectrum. The resulting 100 spectra were then combined into a final science composite and error spectrum by taking the average and standard deviation at each wavelength increment.
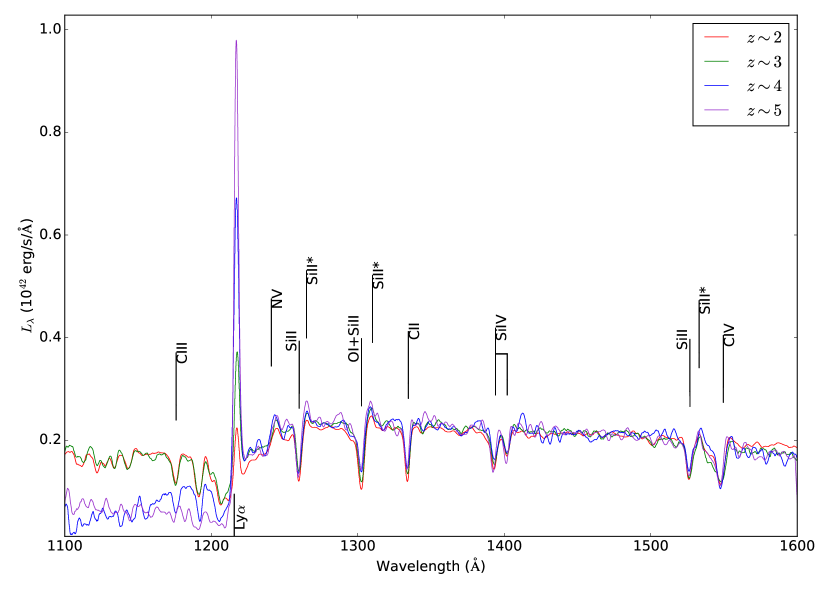
We can examine the overall spectral characteristics of each sample with this composite method. The four composites of increasing redshift are presented in Figure 7. The most striking difference in the spectrum is the strength of its Ly feature, reflecting the difference in median Ly EW of the sample. The properties of the absorption features are difficult to distinguish qualitatively and require further analysis.
We split our redshift sample into bins of various properties. In addition to Ly, these properties include and integrated galaxy properties such as M∗, SFR, age, and MUV. Depending on the property being examined, the set of objects comprising each bin change based on the spectral coverage of the objects. For examining LIS strength as a function of Ly EW, we required every object in the sample to have coverage out to the most redward LIS line, Si ii. This requirement slightly reduced our sample to 160 objects. We split this sample into four bins of increasing Ly EW with 40 objects per bin. Using an equal number of objects per bin provides a comparable S/N for each composite spectrum. To examine HIS strength as a function of Ly EW, we required coverage of the most redward HIS line, C iv. We divided the resulting sample of 154 objects into four bins of increasing Ly. Finally, we examined Ly and LIS strength as a function of integrated galaxy properties using four bins of the 160 objects with coverage of Si ii.
The four composite spectra binned by Ly EW are shown in Figure 8. The absorption features are clearly resolved in the composite spectra, and the variation of the Ly EW in each bin can be seen in the profile at 1216Å. From these composites, we can remeasure the Ly EW and measure the EW of interstellar absorption features. To determine the Ly EW of each bin, we applied the fitting technique described in Section 3.1 to each of the bootstrapped spectra, representing the variation in each composite bin of Figure 8. The final Ly EW and 1 error reported for each bin was the mean and standard deviation of these 100 measurements. This measured Ly EW from stacked spectra and the median Ly EW of the objects composing each bin were comparable within 1.
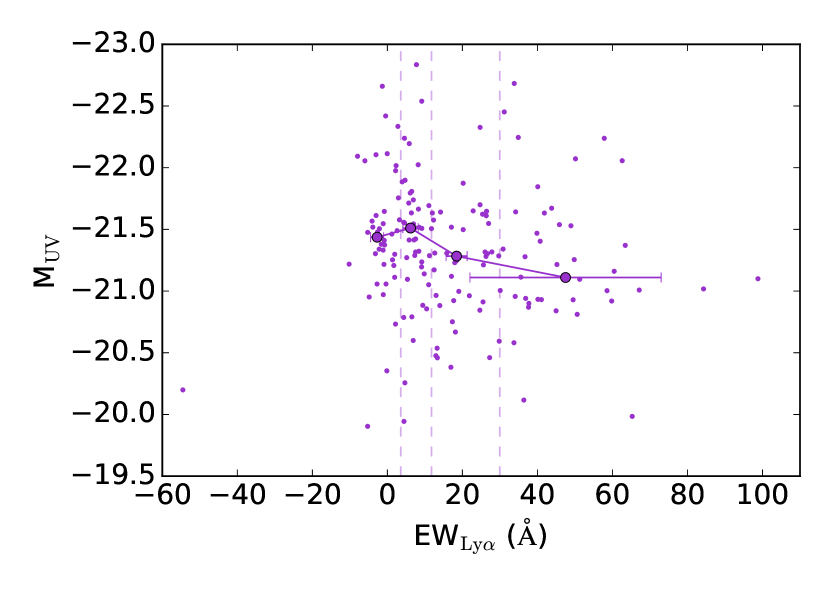
To understand how our analysis is affected by the changing intrinsic brightness of the galaxies, we examined the MUV of each galaxy as a function of its measured Ly EW. All the galaxies in our sample are plotted in MUV-EWLyα space in Figure 9. As Ly emission strength increases, the galaxies tend to be dimmer in the UV continuum. The objects are split into four bins of increasing Ly EW, and the median MUV and Ly EW are displayed. The median MUV of the lowest EWLyα bin is , while the highest bin has a median MUV of . While we observe a trend of fainter MUV with increasing EWLyα, just as that found within the samples of D18, this dependence is weak. Accordingly, it is reasonable to interpret differences in EWLyα as being dominated by variations in emergent Ly flux.
3.3 IGM Correction to Ly Equivalent Widths
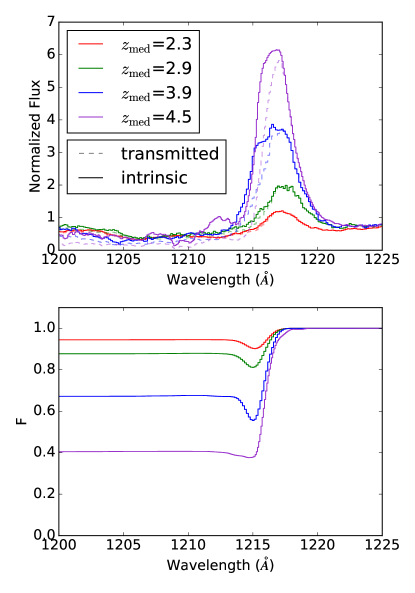
In order to obtain a more accurate measurement of the intrinsic Ly production and escape through the ISM, we attempted to remove the effects of IGM attenuation on the strength of the observed Ly line. The IGM transmission in the vicinity of the Lya feature decreases noticeably from to . To quantify this evolution, Laursen et al. (2011) generated sightlines through high-resolution cosmological simulations of galaxy formation, where the simulated sightlines originate in samples of galaxies at different redshifts ranging from to . These authors produced the mean IGM transmission profile in the vicinity of Ly at each redshift, showing how its shape and depth evolve towards stronger absorption at higher redshift. We interpolated the model of Laursen et al. (2011) to produce IGM transmission curves appropriate for the median redshift of each of our four redshift samples. 333We note that each IGM transmission curve has an associated uncertainty based on the range of sightline opacities found in the simulations of (Laursen et al., 2011). Given that this uncertainty for the average of 40 sightlines is subdominate compared to our other uncertainties, we did not take it into account.
We then degraded the curves in a manner that represented the process of observing our galaxy spectra at moderate resolution and combining them with uncertain systemic redshifts into composite spectra. Specifically, we smoothed the model IGM transmission curve by a Gaussian kernel to match the average spectral resolution of each composite: 970, 1280, and 2700 for the , , and samples respectively. The more important blurring effect arises from the fact that the estimates of systemic redshift from Ly and LIS features have associated systematic errors (i.e., they are based on mean relations between Ly or LIS redshifts and systemic redshifts, which have intrinsic scatter). In order to simulate the effect of stacking N spectra with uncertain systemic redshifts, we generated N individual IGM transmission curves and perturbed each curve by a small . The value was drawn from a normal distribution with zero mean and a standard deviation of Å. The redshift uncertainty was calculated through the method described in Section 2.2. The resulting N perturbed (in wavelength) transmission curves were then averaged together. The transmission curves calculated in this way for the samples are shown in the bottom panel of Figure 10. The fraction of photons transmitted by the IGM at 1215.67Å decreases substantially towards .
In order to convert the transmitted Ly profiles to those intrinsic to the galaxy, we divided the observed composite spectra by the associated degraded IGM transmission curve. Both the transmitted and intrinsic Ly profiles of the samples are shown in the top panel of Figure 10. The Ly profiles in composite spectra at higher redshift receive larger positive corrections for IGM absorption. This analysis was applied to the composites of the samples binned by Ly EW and galaxy properties, and the Ly EW of each composite was remeasured as described in section 3.2.
3.4 Absorption Line Equivalent Width
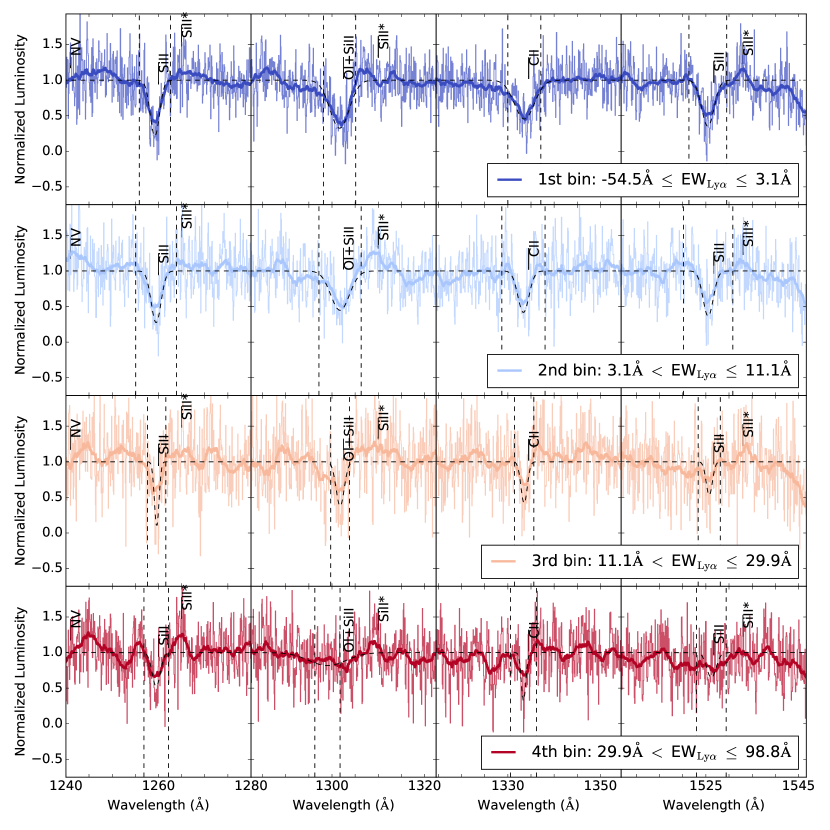
For each composite spectrum, we measured both LIS and HIS equivalent widths. First, we normalized the continua of the rest-frame, spectra using the IRAF tool , using a fourth-order spline fit with continuum regions that avoid the spectral features defined by Rix et al. (2004). From the normalized spectra, we then fit each absorption feature with a Gaussian profile using the scipy routine , with initial fit parameters corresponding to the rest-frame central wavelength of the line and a linewidth of Å, typical of composite LIS lines at . To calculate the flux of each line, we integrated the composite spectrum about the central wavelength of the Gaussian fit to the line using an integration window that spanned from to . Here, is defined as the standard deviation in velocity space of the average of the four key LIS profiles under consideration. In order to determine , we converted the four LIS profiles from rest-frame wavelength space to velocity space and averaged them at each velocity increment. We then fit a Gaussian function to the combined absorption profile in velocity space using the scipy routine , leading to an estimate of . This technique yielded an integration window for each LIS feature that was informed by the average width of the LIS lines in the composite spectrum. At the same time, averaging the four LIS features in velocity space mitigated the effects of low-quality individual profile fits. We finally calculated the EW of the absorption feature by dividing this flux by the normalized continuum value in the integration window. The error on the EW measurement was determined via propagation of errors from the error spectrum in the integration window. The continuum-normalized spectra in bins of increasing Ly EW are shown in Figure 11. The fits to the Gaussian profiles of the LIS lines of Si ii, O iSi ii, C ii, and Si ii are displayed in detail here. The integration windows of 5Å are also displayed, with the entirety of the line profiles fitting in these windows.
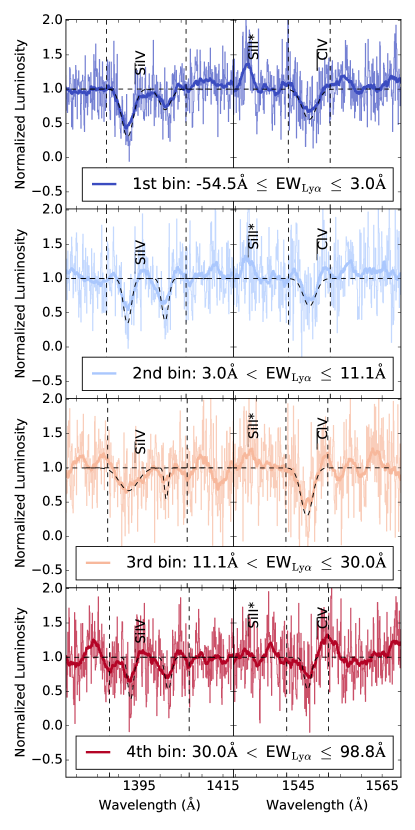
For the HIS doublet of Si iv, a double Gaussian profile was fit to the line in the same method described for the single profiles, above. Additionally, the central-wavelength ratio of the doublet members was fixed at the theoretical value of (1402.770/1393.755). The integration window was set to range from Å of the centre of the bluer profile up to +5Å of the centre of the redder profile. These Si iv fits in four bins of increasing EWLyα are shown in the left panels of Figure 12.
The C iv profile is more complex: on top of the blended absorption feature, there is a stellar component produced by high-velocity winds in O and B stars (Du et al., 2016, and references therein). This stellar component must be removed before the absorption from the interstellar gas can be measured. While a stellar P-Cygni component can appear on the Si iv absorption feature, the component is less significant within the mass ranges and corresponding metallicity ranges of our samples (Steidel et al., 2014; Sanders et al., 2018), thus does not require modeling and removal. We used the rest-frame UV model starburst spectra of Leitherer et al. (2010), smoothed to the resolution of our data, to represent the stellar component. We fit the templates, evaluated at 0.05 , 0.2 , 0.4 , , and 2 , and combined the two bracketing (or one adjacent for the lowest- and highest-metallicities) best-fitting models. This fit is performed on the blue wing of C iv between 1535 and 1544Å, and we refer readers to Figure 3 of Du et al. (2016) for an illustration of our fitting method. By dividing the continuum-normalized spectra by the best-fitting stellar template, we effectively removed the stellar component of C iv. We then measured the EW of the interstellar component of C iv using the method previously described for the single LIS lines, as the doublet is blended together into a single profile at our spectral resolution. The fits to the C iv interstellar profile after removing the stellar component are shown in the right panels of Figure 12.
4 Results
In this section, we examine the the properties of our sample as a function of binned properties of Ly EW, , stellar mass, MUV, age, and SFR.
4.1 Line Strength
We are motivated by a physical picture in which the strength of LIS absorption probes the covering fraction of neutral gas in a galaxy (Reddy et al., 2016). Thus, with the reasonable assuption of a roughly spherically symmetric gas distribution (e.g., Law et al., 2012), there will be a connection between the Ly photons, which are scattered by any neutral gas covering the galaxy (Steidel et al., 2010), and the resulting strength of the LIS absorption features. In contrast, there is evidence that the HIS lines exist in an ionized medium, physically distinct from the neutral gas (Shapley et al., 2003; Du et al., 2016; Du et al., 2018). HIS features have been found to have similar kinematics as LIS lines (Pettini et al., 2002; Heckman et al., 2015; Chisholm et al., 2016; Berg et al., 2018), however Du et al. (2016) finds that while the kinematics of HIS and LIS lines are similar, they correlate differently with galaxy properties, indicating they may exist in different ISM phases. A lack of relationship between Ly and HIS will support this picture.
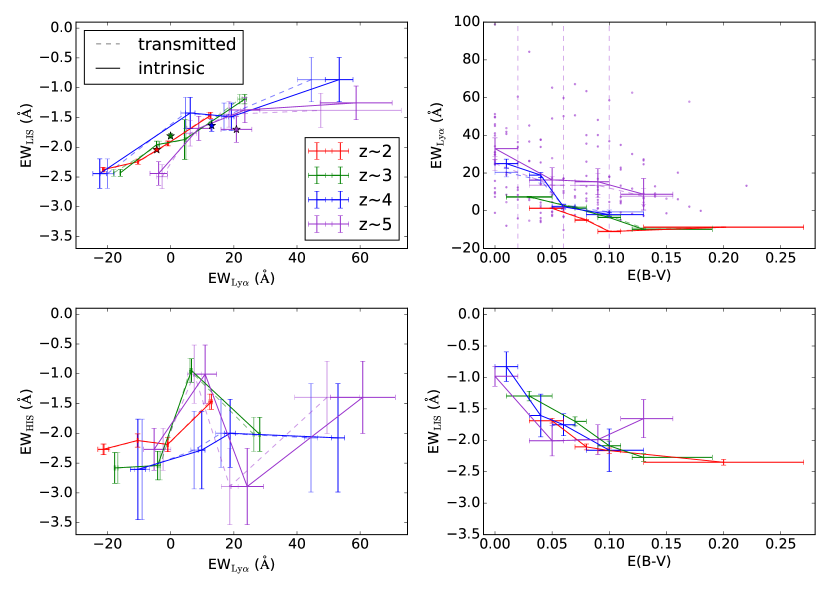
To quantify the strength of the LIS lines, we measure EWLIS as the weighted average of the Si ii, O iSi ii, C ii, and Si ii EWs and their associated errors. EWLIS is presented in the top left panel of Figure 13 as a function of increasing EWLyα. Here, the relationship between Ly and EWLIS is presented at using the sample from this work, while the data points are taken from D18. The Ly EWs uncorrected for IGM absorption are connected by dotted lines, while the intrinsic Ly EWs calculated by the method described in Section 3.3 are connected by solid lines. It can be seen that at the Ly EW range skews significantly higher than that at lower , with the lowest EW bin at Å. The trends at lower redshift are largely unchanged at . This result implies that the attenuation of Ly photons (i.e., due to scattering and dust absorption) and the strength of the LIS feature is intrinsically linked, and is fundamental across redshift. In the highest bin of EWLyα, EWLyα is greater at fixed EWLIS compared to lower redshift, though within 1. This deviation suggests intrinsically stronger Ly at fixed ISM covering fraction (but see e.g. McKinney et al., 2019). We further explore this result in Section 5.
As seen in Figure 11, the shape of the LIS profiles is not strongly dependent on Ly strength. The ratio of EW / EW can reflect the changing properties of the gas producing Si ii absorption: when the ratio approaches , the ratio of their oscillator strengths, Si ii is in the optically-thin regime. The ratio of EW / EW in all EWLyα bins is roughly unity, indicating that these Si ii features are in the optically-thick regime. This result is consistent with Si ii line ratios in the samples presented in D18.
We also examine the evolution of the average spectral properties of the composites after the IGM correction was applied, shown as stars in the top left panel of Figure 13. We see the overall composites following a similar linear relationship at , with the average Ly emission strength increasing and LIS absorption strength decreasing with increasing redshift. We see an evolution off this linear relationship at , with the overall composite having stronger Ly emission and similar LIS absorption properties as the sample. We will further examine the average and binned spectral properties in a subsample with higher median redshift in Section 5.
The EWHIS is defined as the weighted average of EW and EW. We display the relationship between EWHIS in bins of Ly line strength in the lower left panel of Figure 13. In D18, no significant relationship between HIS and Ly strength was found at . In the sample, we find similar strengths of EWHIS, showing no redshift evolution in the overall strengths of the features. We also find no trend of stronger EWHIS as a function of stronger EWLyα emission, similar to what is observed at lower redshift.
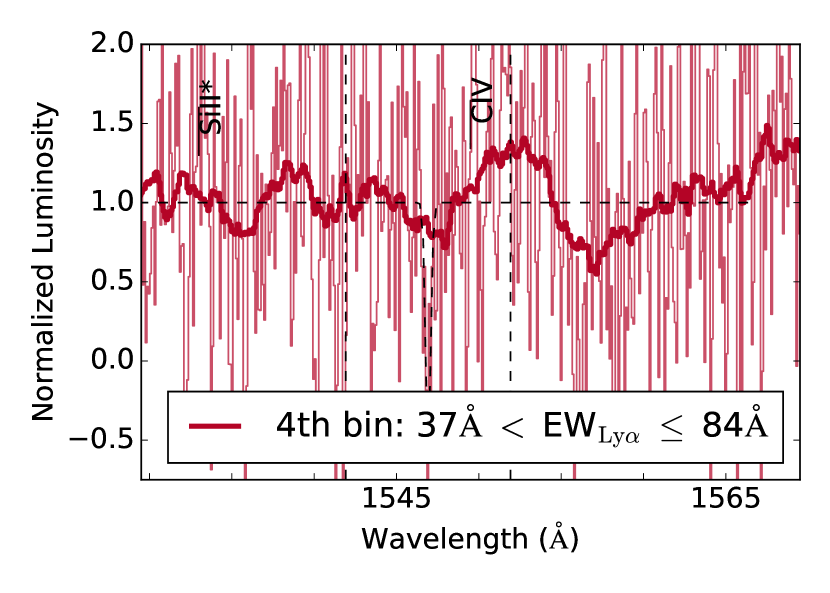
In the highest quartile of EWLyα emission strength, we find evidence for nebular C iv emission at . This detection is shown in the bottom panel of Figure 12. We discuss this spectral feature and its implications for the inferred metallicity of the sample in Section 5.3.
4.2
Of all the galaxy properties measured by SED fitting, dust attenuation is most directly tied to the makeup of the ISM and CGM. As dust grains preferentially scatter bluer light, the amount of reddening reflects the the amount of dust along the line-of-sight. The reddening of the SED of high-redshift sources by dust is typically measured in terms of the quantity . The relationship between Ly and has been well demonstrated: stronger Ly emission in galaxies correlates with a bluer SED (Shapley et al., 2003; Kornei et al., 2010; Vanzella et al., 2009; Pentericci et al., 2007). The scattering of Ly photons through neutral gas in the ISM implies greater path lengths to interact with the dust in the galaxy. Shapley et al. (2003) explored the possibility of dust existing in the same phase as the neutral gas itself, implying a direct correlation between the neutral-gas covering fraction and dust reddening for non-resonant radiation, although uncertainty exists between whether the dust lies in outflowing gas or HII regions.
We examine the strength of Ly in bins of increasing in top right panel of Figure 13. Individual detections of and EWLyα are overplotted as transparent points. The trends shown by the solid purple line, corresponding to measurements post-IGM correction at , are consistent with the well-established inverse-correlation between EWLyα and that pertains all the way down to (Hayes et al., 2014). The sample of D18 follows a similar decreasing trend, although the consistency breaks down at larger . Here, EWLyα is larger at fixed in the sample compared to lower redshift. We also calculate the correlation between the individual transmitted EWLyα and measurements in our sample. We perform a Spearman correlation test, with a null hypothesis that EWLyα and are uncorrelated in the sample. The Spearman test produces a correlation coefficient of with a p-value of 0.00045, strongly rejecting the null hypothesis. This test further supports that the inverse correlation between EWLyα and continues out to .
The strength of EWLIS in bins of increasing is presented in the lower right panel of Figure 13. The trend also follows the one at , with larger leading to a stronger LIS detection. This result supports the physical picture of dust grains existing in the same phase of gas as that attenuating Ly and strengthening the LIS absorption (Reddy et al., 2016). This trend also appears to be invariant out to . The question of which relation is most fundamental – LIS- or LIS-Ly – is difficult to surmise from these plots, but has important implications for the relationship between dust, neutral-phase gas, and escaping Ly radiation from a galaxy. In Section 5, we re-examine the evolution of the relationships among Ly, LIS, and using finer redshift divisions at , and gain further insights into this important question.
4.3 Other Galaxy Properties
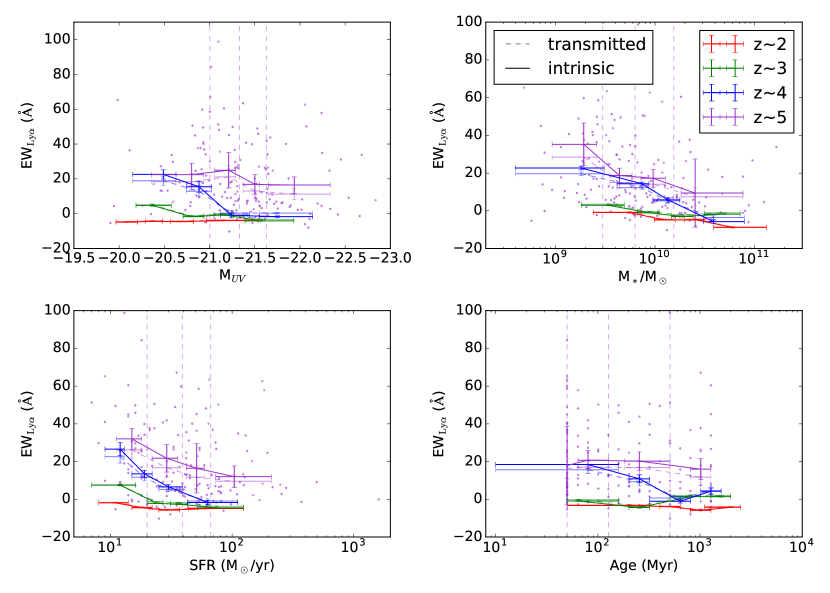
In addition to , we examine the strength of Ly binned in terms of galaxy properties of M∗, SFR, age, and MUV. These relationships out to are presented in Figure 14. Both the intrinsic and transmitted EWLyα are shown as solid and dashed lines, respectively, and the individual transmitted measurements for each object are shown as purple points.
Most of these relationships extend those that are present at . At , we find that stronger EWLyα emission occurs in fainter galaxies, albeit weakly, similar to the trend observed at . This trend is skewed towards stronger EWLyα emission at fixed brightness at . The relationship between MUV and EWLyα flattens in the lower redshift samples. We find a similiar behavior in SFR space, where we find greater EWLyα emission in galaxies with lower SFR, and greater EWLyα at fixed SFR at compared to . In stellar-mass space, we find stronger EWLyα emission in less-massive galaxies, but the trend does not appear to evolve beyond that at . Massive galaxies tend to be more dusty (McLure et al., 2018; Garn & Best, 2010; Whitaker et al., 2017), which would suppress their EWLyα. We find no trend between EWLyα and age at , consistent with results at . This lack of trend could be explained by EWLyα reaching equilibrium quickly after the onset of a starburst (50-100 Myr, see Verhamme et al., 2008).
We also examine the correlation between and EWLyα and recover the anti-correlation of Shapley et al. (2003), indicating that a Ly velocity peak closer to systemic indicates an easier pathway of escape for Ly photons. This anti-correlation is weak, with a Spearman correlation test producing a correlation coefficient of -0.17 and a p-value of 0.14.
In summary, at , we find similar trends to those at : galaxies with stronger Ly emission tend to have lower SFRs, less star formation, bluer UV continua, and less dust extinction. We also find stronger EWLyα emission at fixed galaxy property in the sample.
5 Discussion
Cosmic reionization is the phase change of neutral to ionized hydrogen in the IGM, which appears to be roughly finished by (Fan et al., 2006; McGreer et al., 2015). The leading theory is that reionization was caused by radiation from massive stars at Å escaping from galaxies and ionizing the surrounding IGM (Finkelstein et al., 2012, 2019; Robertson et al., 2015). Due to the high opacity of the IGM at to photons just below the Lyman limit, it is difficult to directly observe the fraction of leaking ionizing to non-ionizing radiation in high-redshift galaxies (Vanzella et al., 2012). However, the Ly feature is well detected out to redshifts near the end of the epoch of reionization (i.e., ; Stark et al., 2011; Schenker et al., 2014; De Barros et al., 2017) and while significantly more challenging, even into the epoch of reionization (e.g., Jung et al., 2018). By modeling the rest-UV spectra of LBGs to infer the intrinsic ionizing luminosity, Steidel et al. (2018) has shown that the fraction of escaping ionizing radiation in a galaxy at is an increasing function of EWLyα. This result supports a physical picture of both Ly photons and ionizing radiation escaping through “holes" in the neutral ISM, similar to that discussed in Reddy et al. (2016). This picture is empirically supported the Ly profile and Lyman continuum emission of Ion2 in Vanzella et al. (2019). Thus, understanding the intrinsic Ly strength of high-redshift galaxies can provide important clues to the evolution of leaking ionizing radiation, and consequently the epoch of reionization (Jung et al., 2018; Mason et al., 2018; Laursen et al., 2019).
5.1 Splitting sample into low- and high-redshift
Given the size of the sample (including over twice as many galaxies as in the sample from Jones et al. (2012)) and our desire to obtain finer redshift sampling with a high-redshift bin that approaches the epoch of reionization, we isolate high-redshift subsamples within our dataset. We divide the sample at its median redshift. Our “low-redshift" bin contains 87 galaxies with , and our “high-redshift" bin contains 88 galaxies with .
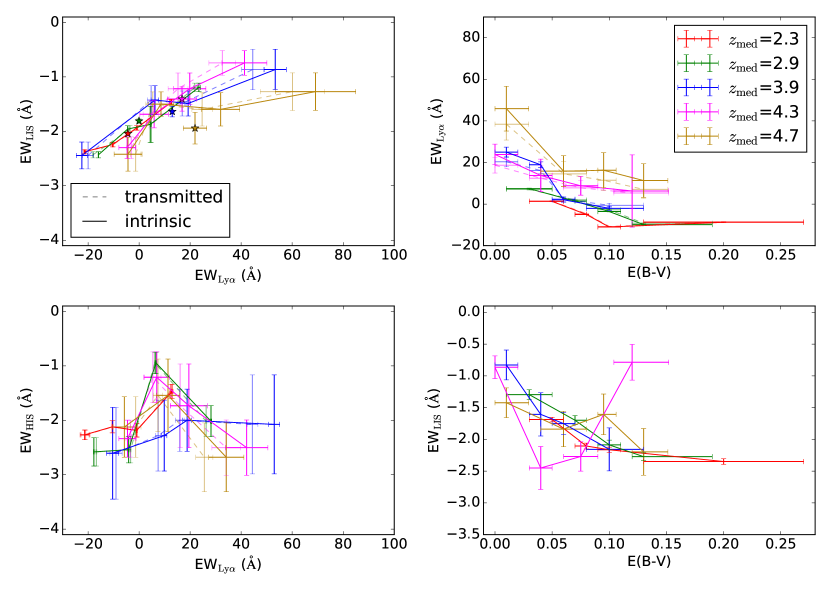
The strengths of interstellar metal lines and Ly in the lower- and higher-redshift subsamples are presented in the left panels of Figure 15. The purple line of Figure 13 at is replaced by a magenta curve for the sample and a gold curve for the sample. At , the positive correlation between EWLIS and EWLyα is preserved. This unchanging correlation reflects the fundamental connection between the amount of neutral gas and the attenuation of the Ly line. In the sample, the trend begins to evolve at EWÅ. We observe stronger Ly emission at fixed LIS absorption strength.
The average properties of the composite spectra out to are displayed as stars in the upper left panel of Figure 15. At , the average Ly emission strength increases and the average LIS absorption strength decreases with increasing redshift. This trend indicates that the neutral-gas covering fraction is decreasing with increasing redshift. This relationship appears to be different at , where the average properties of the sample are offset from the trend of decreasing EWLyα with increasing EWLIS established at . This result implies additional factors beyond neutral-gas covering fraction are influencing the average EWLyα and EWLIS of the subsample.
We further probe the state of the ISM near the epoch of reionization based on the mutual relationships among EWLyα, EWLIS, and . The upper right panel of Figure 15 shows stronger EWLyα emission in bluer galaxies, similar to that of Figure 13, with the two subsamples more clearly illustrating the evolution at . Galaxies at have stronger Ly emission at fixed . This evolution is not present in the relationship between EWLIS and shown in the lower right panel of Figure 15: stronger LIS absorption correlates with more reddening, invariant with redshift.
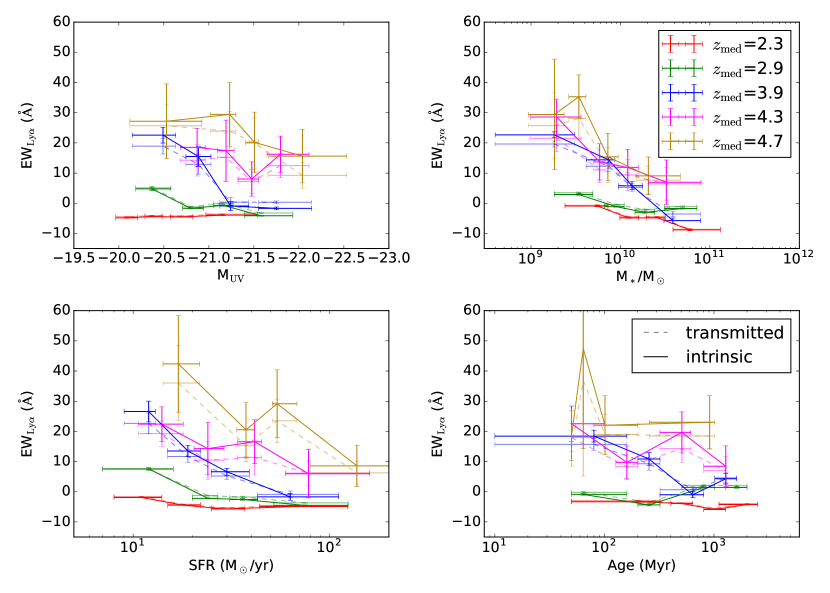
The redshift evolution of EWLyα and other galaxy properties of Figure 14 also sheds light on the physical differences of galaxies as we look back towards the epoch of reionization. The trends found in the single sample analysis are more strongly demonstrated in Figure 16, based on the lower- and higher-redshift subsamples. The pattern of lower EWLyα in brighter, more massive, highly star-forming galaxies is preserved across all redshift samples. This trend can also be seen down to (Hayes et al., 2014). Additionally, the evolution towards greater EWLyα at fixed MUV, SFR, and age with increasing redshift is shown more clearly with the and subsamples. While we don’t see a correlation of increased EWLyα with increased specific star-formation rate (sSFR), we note that EWLyα is elevated in the subsample compared to the subsample at fixed sSFR, indicating that there are other galaxy properties affecting the strength of Ly. On the other hand, the relationship between EWLyα and M∗ does not evolve in the three highest redshift subsamples. The trends of EWLyα and MUV, SFR, sSFR, and age reflect that EWLyα is increasing at fixed galaxy property, especially at . This is similar to the rest-UV spectral trends of Figure 15, where it is shown that EWLyα is increasing at fixed ISM/CGM property.
5.2 Intrinsic Ly Production Evolution
The three factors that affect the observed strength of Ly in a galaxy spectrum are (1) the intrinsic production rate of Ly photons in HII regions, which is set by the efficiency of ionizing photon production for a given SFR, (2) the radiative transfer of Ly photons through the ISM and CGM of the galaxy, and (3) the transfer of Ly photons through the IGM. We have corrected for IGM opacity through application of the theoretical transmission curves of Laursen et al. (2011), which, calculated as an average of many sight lines through the IGM, approximate the effects of the IGM on our stacked spectra composed of many galaxies. The anti-correlation between EWLyα and EWLIS, which remains roughly constant from to , can be seen as consequence of ISM and CGM radiative transfer. An increased covering fraction of neutral ISM and CGM gas both strengthens LIS absorption and weakens Ly emission. Based on the lack of evolution in the relationship between EWLyα and EWLIS, we argue that this correlation is driven by variations in covering fraction of interstellar and circumgalactic gas, and that the intrinsic typical Ly production efficiency of samples at these redshifts is similar. This is supported by the distinction in Trainor et al. (2019) between quantities related to Ly production and escape that jointly modulate observed Ly strength. The authors argue that EWLIS is strictly an escape-related quantity, supporting our conclusion that changing ISM/CGM properties should entirely define the EWLyα vs. EWLIS relationship assuming intrinsic Ly production is constant.
The invariance of the EWLyα vs. EWLIS relation breaks down in the highest-redshift bin at . In the highest bin of EWLyα, the sample differs significantly from the relationship defined at lower redshift. Additionally, at , the average EWLyα and EWLIS deviate strongly from the linear relationship between EWLyα and EWLIS defined by the lower redshift samples. These deviations, which are at , suggest the presence of additional factors modulating the strength of Ly emission, along with radiative transfer through the ISM, CGM, and IGM. Specifically, this difference suggests a significant increase in the intrinsic efficiency of Ly photon production, and, correspondingly, ionizing radiation.
A scenario of increased intrinsic Ly production efficiency among the strongest Ly emitters at is additionally favored by the joint consideration of the EWLyα vs. EWLIS and EWLyα vs. relations. The dust and neutral-gas content in the ISM of a galaxy is intimately connected, with both thought to exist in the same physical location in the galaxy. The relationship between EWLIS and is thus expected to be invariant across redshift, as it is entirely defined by the neutral-gas covering fraction (and consequently the amount of neutral-gas and dust) of the galaxy. The relationship in the bottom right panel of Figure 15 shows exactly this pattern. On the other hand, the redshift evolution towards stronger Ly emission at fixed shows that, in addition to the dust and neutral-gas content of the galaxy modulating the strength of Ly, the intrinsic production rate also increases across redshift (assuming all else being equal). While our results suggest that the dust and neutral-phase gas exist co-spatially, the dust may be present in many locations throughout the ISM/CGM. Fully disentangling the interplay between EWLyα, EWLIS, and will require further work (i.e., individual detections of EWLIS).
The observed difference in intrinsic Ly photon production rate has important implications for understanding the contribution of galaxies to the reionization of the Universe. The comoving ionizing emissivity of the Universe can be modeled as the cosmic SFR () multiplied by the number of LyC photons produced per unit SFR () multiplied by the escape fraction of LyC photons from the galaxy (). Physically, the EW of Ly describes the amount of escaping Ly emission relative to the non-ionizing UV continuum (analogous to when averaged). The production of these Ly photons in HII regions comes from recombination of protons and electrons, driven by LyC photons ionizing the hydrogen gas. Given that is directly connected to the properties of the ISM and CGM demonstrated by the relationships of EWLyα, EWLIS, and at low redshift, an evolving EWLyα at fixed EWLIS and indirectly measures the evolving with redshift. The evolution of is an important input into models of reionization (Bouwens et al., 2015; Stanway et al., 2016), and should not be taken as constant (e.g., Robertson et al., 2015).
5.3 Metallicity of the Sample
The relationship between UV slope and UV luminosity evolves towards bluer colors at fixed luminosity towards higher redshift (Bouwens et al., 2014). The observed evolution towards decreasing median from to in this work is consistent with these results. This evolution could reflect a fundamental change in dust and metal content of these galaxies, or could reflect a bluer intrinsic stellar population at higher redshift. Spectroscopic observations are required to distinguish among different scenarios of dust, metallicity, or stellar population evolution.
The detection of nebular C iv emission in the highest bin of EWLyα at provides independent evidence for significantly sub-solar metallicity. Nebular C iv emission is produced by extreme radiation fields in star-forming galaxies (Berg et al., 2019) and detections at lower redshift are typically found in metal-poor galaxies (Erb et al., 2010; Stark et al., 2014; Senchyna et al., 2017; Senchyna et al., 2019; Berg et al., 2019; Vanzella et al., 2016, 2017). Stark et al. (2015) detected nebular C iv in one galaxy at , out of a sample of four galaxies, whereas the typical C iv detection rate in UV-selected galaxies at is only 1 per cent (Steidel et al., 2002; Hainline et al., 2011). A single, strong C iv detection in a sample of four galaxies could imply a larger population of lower-metallicity, nebular C iv-emitting galaxies during the epoch of reionization. In our overall sample, we see strong nebular C iv emission in the highest EWLyα bin (near rest-frame 1549Å in the bottom panel of Figure 12). In the subsample, this feature is also prominent, as shown in Figure 17. A significant detection in a bin containing 25 per cent of the objects in the sample indicates a changing population of galaxies at with greater nebular C iv, harder ionizing fields, and lower metallicity. When compared to the highest EWLyα quartile of Steidel et al. (2002) at , we find an elevated nebular C iv to Ly flux ratio of per cent and per cent in the and samples respectively, compared to per cent at . The EW of this nebular C iv line was measured using the method in Section 3.4 as Å and Å in the and samples, respectively.
Systematically lower metallicity in galaxies near the epoch of reionization has important implications for . The connection between metallicity and ionizing photon production is more easily studied at lower redshift, where rest-optical metal lines can be observed with ground-based optical telescopes. Shivaei et al. (2018) measured photon production efficiencies in star-forming galaxies at and found galaxies with elevated have bluer UV spectral slopes, higher ionization parameters, and lower metallicities. Extreme galaxies at lower redshift with subsolar metallicity have also been demonstrated to have higher average EWLyα (Erb et al., 2010). These observations at lower redshift paint a physical picture of galaxies with lower metallicity producing an intrinsically harder ionizing spectra per unit star-formation rate, emitting Ly photons that are also less likely to be absorbed during multiple scatterings in less-dusty ISM/CGM. This picture is once again supported by the framing of Trainor et al. (2019), according to which the evolution of the average EWLyα vs. EWLIS properties across redshift reveals the changing escape-related properties of the ISM/CGM, while the evolving metallicity supports changing production-related parameters of the stellar population at high redshift. If these lower-metallicity, lower neutral-gas covering-fraction galaxies are more common at , as suggested by the evolving and nebular C iv emission in our sample, they will contribute more strongly to reionization because of increased and . Direct metallicity measurements at are vital to disentangle and quantify these effects.
6 Summary
The rest-UV spectra of star-forming galaxies contain important information on star formation, dust and metal content of the ISM and CGM, and gas kinematics. Interpreting this information provides clues into the changing galaxy properties closer to the epoch of reionization. These properties include those related to the escape of ionizing radiation, such as neutral-gas covering fraction, and properties related to production of ionizing radiation, such as intrinsic Ly production rate. To study these properties, we analyzed the relative strengths of Ly, LIS, and HIS lines in a sample of star-forming galaxies for the first time and compared them to similar analyses at performed in D18. We also performed corrections for IGM attenuation on the Ly profiles of sample composites using transmission curves of Laursen et al. (2011). The key results are as follows:
-
1.
We find that the redshift invariance of the relationship of EWLIS vs. EWLyα deviates at , and even more significantly at , implying an evolving intrinsic Ly photon production rate at (assuming all else being equal). The EWLIS vs. EWLyα relation illustrates the effects of the neutral-gas covering fraction on the rest-UV spectrum, and greater EWLyα at fixed EWLIS at implies a greater intrinsic Ly production rate.
-
2.
We find that the relationship of EWLyα vs. evolves at higher redshift, with increased EWLyα at fixed at , but no redshift evolution in the relationship of EWLIS vs. , suggesting greater intrinsic Ly production at fixed ISM/CGM properties using the non-evolution of EWLIS and EWLyα as a control. The invariance of EWLIS vs. reflects the fundamental connection between neutral-phase gas content and dust in the ISM and CGM of star-forming galaxies at high redshift. However, we find greater EWLyα at fixed at , implying for a given amount of dust and neutral gas, there are more Ly photons being produced.
-
3.
The robust detection of nebular C iv in the highest quartile of EWLyα objects within the and the higher-redshift subsample supports a scenario of significantly subsolar metallicity in per cent of our sample of star-forming galaxies near the epoch of reionization. Among non-AGNs, nebular C iv is typically found in a lower-metallicity population in galaxies from . Additionally, we find evolving UV slopes seen through the changing median from z, also consistent with a more metal-poor population of galaxies at higher-redshift.
-
4.
The relationship of EWHIS vs. EWLyα remains invariant with redshift out to , implying that ionized-phase and neutral-phase gas in the ISM and CGM remains in physically-distinct regions out to higher redshift.
-
5.
Higher EWLyα is correlated with fainter MUV, lower M∗, lower SFR, and younger age at , similar to the trends found at . We also see an evolution of greater EWLyα at fixed SFR, MUV, and age at . This evolution of greater EWLyα at fixed galaxy property is consistent with the conclusion that the intrinsic Ly production rate is increasing at .
These results have important implications for the understanding of the evolving galaxy population just after the completion of reionization. Higher intrinsic Ly photon production rate implies a greater at , a vital input parameter to models of reionization. The analyses performed here are especially revealing the epoch of reionization, in which the star-forming galaxies are thought to be the most significant contributers to the comoving ionizing emissivity of the universe. The upcoming launch of the James Webb Space Telescope, with its groundbreaking near-IR spectroscopic capabilities, will allow for the measurement of rest-UV spectral features out to , and we will discover whether the trends at continue into the epoch of reionziation.
AES, AJP, XD, and MWT acknowledge support for program GO-15287, provided by NASA through a grant from the Space Telescope Science Institute (STScI), which is operated by the Association of Universities for Research in Astronomy, Inc., under NASA contract NAS 5-26555. We also acknowledge a NASA contract supporting the “WFIRST Extragalactic Potential Observations (EXPO) Science Investigation Team" (15-WFIRST15-0004), administered by GSFC. We wish to extend special thanks to those of Hawaiian ancestry on whose sacred mountain we are privileged to be guests. Without their generous hospitality, most of the observations presented herein would not have been possible.
References
- Berg et al. (2018) Berg D. A., Erb D. K., Auger M. W., Pettini M., Brammer G. B., 2018, The Astrophysical Journal, 859, 164
- Berg et al. (2019) Berg D. A., Chisholm J., Erb D. K., Pogge R., Henry A., Olivier G. M., 2019, The Astrophysical Journal, 878, L3
- Bouwens et al. (2014) Bouwens R. J., et al., 2014, The Astrophysical Journal, 793, 115
- Bouwens et al. (2015) Bouwens R. J., Illingworth G. D., Oesch P. A., Caruana J., Holwerda B., Smit R., Wilkins S., 2015, The Astrophysical Journal, 811
- Bouwens et al. (2016) Bouwens R. J., et al., 2016, The Astrophysical Journal, 833, 72
- Bruzual & Charlot (2003) Bruzual G., Charlot S., 2003, Monthly Notices of the Royal Astronomical Society, 344, 1000
- Calzetti et al. (2000) Calzetti D., Armus L., Bohlin R. C., Kinney A. L., Koornneef J., Storchi-Bergmann T., 2000, The Astrophysical Journal, 533, 682
- Capak et al. (2007) Capak P., et al., 2007, The Astrophysical Journal Supplement Series, 172, 99
- Chabrier (2003) Chabrier G., 2003, Publications of the Astronomical Society of the Pacific, 115, 763
- Chisholm et al. (2016) Chisholm J., Tremonti Christy A., Leitherer C., Chen Y., 2016, Monthly Notices of the Royal Astronomical Society, 463, 541
- Chisholm et al. (2018) Chisholm J., et al., 2018, Astronomy and Astrophysics, 616, A30
- Chisholm et al. (2019) Chisholm J., Rigby J. R., Bayliss M., Berg D. A., Dahle H., Gladders M., Sharon K., 2019, The Astrophysical Journal, 882, 182
- De Barros et al. (2017) De Barros S., et al., 2017, Astronomy and Astrophysics, 608, A123
- Du et al. (2016) Du X., Shapley A. E., Martin C. L., Coil A. L., 2016, The Astrophysical Journal, 829, 64
- Du et al. (2018) Du X., et al., 2018, The Astrophysical Journal, 860, 75
- Erb et al. (2010) Erb D. K., Pettini M., Shapley A. E., Steidel C. C., Law D. R., Reddy N. A., 2010, The Astrophysical Journal, 719, 1168
- Faisst et al. (2016) Faisst A. L., et al., 2016, The Astrophysical Journal, 822, 29
- Fan et al. (2006) Fan X., Carilli C. L., Keating B., 2006, Annual Review of Astronomy & Astrophysics, 44, 415
- Finkelstein et al. (2012) Finkelstein S. L., et al., 2012, The Astrophysical Journal, 758
- Finkelstein et al. (2019) Finkelstein S. L., et al., 2019, The Astrophysical Journal, 879, 36
- Garn & Best (2010) Garn T., Best P. N., 2010, Monthly Notices of the Royal Astronomical Society, 409, 421
- Gordon et al. (2003) Gordon K. D., Clayton G. C., Misselt K. A., Landolt A. U., Wolff M. J., 2003, The Astrophysical Journal, 594, 279
- Hainline et al. (2011) Hainline K. N., Shapley A. E., Greene J. E., Steidel C. C., 2011, The Astrophysical Journal, 733, 31
- Hasinger et al. (2018) Hasinger G., et al., 2018, The Astrophysical Journal, 858, 77
- Hayes et al. (2014) Hayes M., et al., 2014, The Astrophysical Journal, 782, 6
- Heckman et al. (2015) Heckman T. M., Alexandroff R. M., Borthakur S., Overzier R., Leitherer C., 2015, The Astrophysical Journal, 809
- Jones et al. (2012) Jones T., Stark D. P., Ellis R. S., 2012, The Astrophysical Journal, 751
- Jung et al. (2018) Jung I., et al., 2018, The Astrophysical Journal, 864, 103
- Kornei et al. (2010) Kornei K. A., Shapley A. E., Erb D. K., Steidel C. C., Reddy N. A., Pettini M., Bogosavljević M., 2010, The Astrophysical Journal, 711, 693
- Laigle et al. (2016) Laigle C., et al., 2016, The Astrophysical Journal Supplement Series, 224, 24
- Laursen et al. (2011) Laursen P., Sommer-Larsen J., Razoumov A. O., 2011, The Astrophysical Journal, 728
- Laursen et al. (2019) Laursen P., Sommer-Larsen J., Milvang-Jensen B., Fynbo J. P. U., Razoumov A. O., 2019, Astronomy & Astrophysics, 627, A84
- Law et al. (2012) Law D. R., Steidel C. C., Shapley A. E., Nagy S. R., Reddy N. A., Erb D. K., 2012, The Astrophysical Journal, 759
- Leitherer et al. (2010) Leitherer C., Otálvaro P. A., Bresolin F., Kudritzki R. P., Lo Faro B., Pauldrach A. W., Pettini M., Rix S. A., 2010, Astrophysical Journal, Supplement Series, 189, 309
- Leitherer et al. (2011) Leitherer C., Tremonti C. A., Heckman T. M., Calzetti D., 2011, The Astronomical Journal, 141
- Marchi et al. (2019) Marchi F., et al., 2019, Astronomy & Astrophysics
- Mason et al. (2018) Mason C. A., Treu T., Dijkstra M., Mesinger A., Trenti M., Pentericci L., de Barros S., Vanzella E., 2018, The Astrophysical Journal, 856, 2
- McGreer et al. (2015) McGreer I. D., Mesinger A., D’Odorico V., 2015, Monthly Notices of the Royal Astronomical Society, 447, 499
- McKinney et al. (2019) McKinney J. H., Jaskot A. E., Oey M. S., Yun M. S., Dowd T., Lowenthal J. D., 2019, The Astrophysical Journal, 874, 52
- McLure et al. (2018) McLure R. J., et al., 2018, Monthly Notices of the Royal Astronomical Society, 476, 3991
- Nakajima et al. (2018) Nakajima K., Fletcher T., Ellis R. S., Robertson B. E., Iwata I., 2018, Monthly Notices of the Royal Astronomical Society, 477, 2098
- Oesch et al. (2013) Oesch P. A., et al., 2013, The Astrophysical Journal, 772
- Oke et al. (1995) Oke J. B., et al., 1995, Publications of the Astronomical Society of the Pacific, 107, 375
- Pentericci et al. (2007) Pentericci L., Grazian A., Fontana A., Salimbeni S., Santini P., De Santis C., Gallozzi S., Giallongo E., 2007, Astronomy and Astrophysics, 471, 433
- Pettini et al. (2002) Pettini M., Rix S. A., Steidel C. C., Adelberger K. L., Hunt M. P., Shapley A. E., 2002, The Astrophysical Journal, 569, 742
- Planck Collaboration et al. (2016) Planck Collaboration et al., 2016, Astronomy and Astrophysics, 594
- Reddy et al. (2008) Reddy N. A., Steidel C. C., Pettini M., Adelberger K. L., Shapley A. E., Erb D. K., Dickinson M., 2008, The Astrophysical Journal Supplement Series, 175, 48
- Reddy et al. (2012) Reddy N. A., Pettini M., Steidel C. C., Shapley A. E., Erb D. K., Law D. R., 2012, The Astrophysical Journal, 754
- Reddy et al. (2016) Reddy N. A., Steidel C. C., Pettini M., Bogosavljević M., Shapley A. E., 2016, The Astrophysical Journal, 828, 108
- Reddy et al. (2018) Reddy N. A., et al., 2018, The Astrophysical Journal, 853, 56
- Rix et al. (2004) Rix S. A., Pettini M., Leitherer C., Bresolin F., Kudritzki R., Steidel C. C., 2004, The Astrophysical Journal, 615, 98
- Robertson et al. (2015) Robertson B. E., Ellis R. S., Furlanetto S. R., Dunlop J. S., 2015, The Astrophysical Journal Letters, 802, L19
- Rudie et al. (2012) Rudie G. C., et al., 2012, The Astrophysical Journal, 750, 67
- Sanders et al. (2018) Sanders R. L., et al., 2018, The Astrophysical Journal, 858, 99
- Schenker et al. (2014) Schenker M. A., Ellis R. S., Konidaris N. P., Stark D. P., 2014, The Astrophysical Journal, 795
- Scoville et al. (2007) Scoville N., et al., 2007, The Astrophysical Journal Supplement Series, 172, 1
- Senchyna et al. (2017) Senchyna P., et al., 2017, Monthly Notices of the Royal Astronomical Society, 472, 2608
- Senchyna et al. (2019) Senchyna P., Stark D. P., Chevallard J., Charlot S., Jones T., Vidal-García A., 2019, Monthly Notices of the Royal Astronomical Society, 488, 3492
- Shapley et al. (2003) Shapley A. E., Steidel C. C., Pettini M., Adelberger K. L., 2003, The Astrophysical Journal, 588, 65
- Shivaei et al. (2018) Shivaei I., et al., 2018, The Astrophysical Journal, 855, 42
- Stanway et al. (2016) Stanway E. R., Eldridge J. J., Becker G. D., 2016, Monthly Notices of the Royal Astronomical Society, 456, 485
- Stark et al. (2010) Stark D. P., Ellis R. S., Chiu K., Ouchi M., Bunker A., 2010, Monthly Notices of the Royal Astronomical Society, 408, 1628
- Stark et al. (2011) Stark D. P., Ellis R. S., Ouchi M., 2011, The Astrophysical Journal Letters, 728
- Stark et al. (2014) Stark D. P., et al., 2014, Monthly Notices of the Royal Astronomical Society, 445, 3200
- Stark et al. (2015) Stark D. P., et al., 2015, Monthly Notices of the Royal Astronomical Society, 454, 1393
- Steidel et al. (2002) Steidel C. C., Hunt M. P., Shapley A. E., Adelberger K. L., Pettini M., Dickinson M., Giavalisco M., 2002, The Astrophysical Journal, 576, 653
- Steidel et al. (2003) Steidel C. C., Adelberger K. L., Shapley A. E., Pettini M., Dickinson M., Giavalisco M., 2003, The Astrophysical Journal, 592, 728
- Steidel et al. (2004) Steidel C. C., Shapley A. E., Pettini M., Adelberger K. L., Erb D. K., Reddy N. A., Hunt M. P., 2004, The Astrophysical Journal, 604, 534
- Steidel et al. (2010) Steidel C. C., Erb D. K., Shapley A. E., Pettini M., Reddy N., Bogosavljević M., Rudie G. C., Rakic O., 2010, The Astrophysical Journal, 717, 289
- Steidel et al. (2014) Steidel C. C., et al., 2014, The Astrophysical Journal, 795, 165
- Steidel et al. (2016) Steidel C. C., Strom A. L., Pettini M., Rudie G. C., Reddy N. A., Trainor R. F., 2016, The Astrophysical Journal, 826, 159
- Steidel et al. (2018) Steidel C. C., Bogosavljević M., Shapley A. E., Reddy N. A., Rudie G. C., Pettini M., Trainor R. F., Strom A. L., 2018, The Astrophysical Journal, 869, 123
- Strom et al. (2017) Strom A. L., Steidel C. C., Rudie G. C., Trainor R. F., Pettini M., Reddy N. A., 2017, The Astrophysical Journal, 836, 164
- Trainor et al. (2019) Trainor R. F., Strom A. L., Steidel C. C., Rudie G. C., Chen Y., Theios R. L., 2019, The Astrophysical Journal, 887, 85
- Vanzella et al. (2005) Vanzella E., et al., 2005, Astronomy and Astrophysics, 434, 53
- Vanzella et al. (2006) Vanzella E., et al., 2006, Astronomy and Astrophysics, 454, 423
- Vanzella et al. (2008) Vanzella E., et al., 2008, Astronomy and Astrophysics, 478, 83
- Vanzella et al. (2009) Vanzella E., et al., 2009, The Astrophysical Journal, 695, 1163
- Vanzella et al. (2012) Vanzella E., et al., 2012, The Astrophysical Journal, 751, 70
- Vanzella et al. (2016) Vanzella E., et al., 2016, The Astrophysical Journal, 821, L27
- Vanzella et al. (2017) Vanzella E., et al., 2017, The Astrophysical Journal, 842, 47
- Vanzella et al. (2019) Vanzella E., et al., 2019, Monthly Notices of the Royal Astronomical Society
- Verhamme et al. (2008) Verhamme A., Schaerer D., Atek H., Tapken C., 2008, Astronomy and Astrophysics, 491, 89
- Whitaker et al. (2017) Whitaker K. E., Pope A., Cybulski R., Casey C. M., Popping G., Yun M. S., 2017, The Astrophysical Journal, 850, 208