A Black Hole X-ray Binary at 100 Hz: Multiwavelength Timing of MAXI J1820+070 with HiPERCAM and NICER
Abstract
We report on simultaneous sub-second optical and X-ray timing observations of the low mass X-ray binary black hole candidate MAXI J1820+070. The bright 2018 outburst rise allowed simultaneous photometry in five optical bands () with HiPERCAM/GTC (Optical) at frame rates over 100 Hz, together with NICER/ISS observations (X-rays). Intense (factor of two) red flaring activity in the optical is seen over a broad range of timescales down to 10 ms. Cross-correlating the bands reveals a prominent anti-correlation on timescales of seconds, and a narrow sub-second correlation at a lag of +165 ms (optical lagging X-rays). This lag increases with optical wavelength, and is approximately constant over Fourier frequencies of 0.3–10 Hz. These features are consistent with an origin in the inner accretion flow and jet base within 5000 Gravitational radii. An additional +5 s lag feature may be ascribable to disc reprocessing. MAXI J1820+070 is the third black hole transient to display a clear 0.1 s optical lag, which may be common feature in such objects. The sub-second lag variation with wavelength is novel, and may allow constraints on internal shock jet stratification models.
keywords:
accretion, accretion discs – X-rays: binaries – X-rays: individual: MAXI J1820+070 – stars: optical: variable – black holes1 Introduction
Accreting black holes in binary systems are unrivalled laboratories for astrophysical conditions far beyond what can be reproduced on Earth. However, their small apparent angular sizes, prohibitively short time scales of flux variations, and unpredictable ‘outbursts’ of enhanced accretion activity have historically made their study difficult. This is now beginning to change; the advent of a new generation of observatories, and using modes not possible before, allows us to probe them deeper than ever.
ASASSN-18ey was first discovered on 2018 March 6 in the optical (Tucker et al., 2018), and then on March 11 classified as X-ray transient MAXI J1820+070 by Kawamuro et al. (2018). The source (hereafter ‘J1820’) quickly reached a flux of 4 Crab, making it one of the brightest X-ray transients ever (Corral-Santana et al. 2016, Shidatsu et al. 2019). Analysis of its optical/X-ray luminosity (Baglio et al., 2018), X-ray power-law spectrum, measured disc blackbody temperature, and broadband timing power spectrum (Uttley et al., 2018) concluded that this source is a Low Mass X-ray Binary (LMXB). Torres et al. (2019) dynamically confirmed a black hole (mass function 5.18 0.15 M⊙ and mass of 7.2 M with system inclination of 75∘), and its distance has been found to be kpc (Gandhi et al., 2019).
The origin of optical emission in LMXBs is generally considered to be a mixture of processes, including, e.g., X-ray reprocessing (King & Ritter, 1998), synchrotron radiation from a jet (Markoff et al., 2001; Malzac, 2018), and/or an accretion flow (Fabian et al. 1982, Veledina et al. 2011). Fast timing observations can probe the interactions between these components and give important insight into the structure of the accretion flows. But such observations are challenging and only a handful of sources have been observed using strictly simultaneous rapid multiwavelength timing.
To this end, we present simultaneous optical/X-ray timing results of J1820 from 2018 April 17 during its hard state (Homan et al., 2018), carried out by the new HiPERCAM and NICER detectors at an unprecedented time resolution.
2 Observations
2.1 HiPERCAM/GTC – Fast Optical Timing
High-speed multi-colour photometry of J1820 was carried out using HiPERCAM (Dhillon et al., 2018) on the 10.4 m Gran Telescopio Canarias. HiPERCAM uses 4 dichroic beamsplitters to image simultaneously 5 optical channels covering the -bands (respectively, wavelengths 3526, 4732, 6199, 7711 and 9156 Å). The CCDs were binned by a factor of 8 and used in drift mode. We orientated the instrument (PA = 58∘) and used two windows (96x72 pixels each), one centered on J1820, and another on a comparison star, APASS–34569459 (Henden et al., 2015). The observations discussed here were taken on 2018 April 17, from 03:26–06:11 UT, coordinated with NICER. The exposure time was 2 ms, the cadence 2.9 ms, the median seeing 2.″2. The sky was affected by mild cirrus, but was reasonably photometric.
We used the HiPERCAM pipeline software111https://github.com/HiPERCAM/hipercam to de-bias, flat-field and extract the target count rates using aperture photometry with a seeing-dependent circular aperture tracking the centroid of the source. Sky background was removed using the clipped mean of an annular region around the target. The target was brighter than all stars in the field. We thus used the raw target counts for the analyses presented herein; note that our primary results are not affected when using photometry relative to the comparison star.
2.2 NICER – X-ray
NICER (Neutron star Interior Composition ExploreR) is a new X-ray instrument aboard the International Space Station (ISS). It comprises 52 functioning X-ray concentrator optics and silicon drift detector pairs, arranged in seven groups of eight. Individual photons between 0.2-12 keV, and their energies, can be detected to a time resolution of 40 ns.
Data reduction of ObsID 1200120131 was completed using nicerdas, a collection of NICER-specific tools, and part of HEASARC. Full Level2 calibration and screening was conducted with nicerl2, which calibrated, checked the time intervals, merged, and cleaned the data. Barycentric correction was carried out using barycorr, then the photon events (all between 0.2-12 keV) were binned to the times of the optical light-curve, and Poissonian errors were applied.
3 Results
3.1 Lightcurves & Discrete Correlation Functions
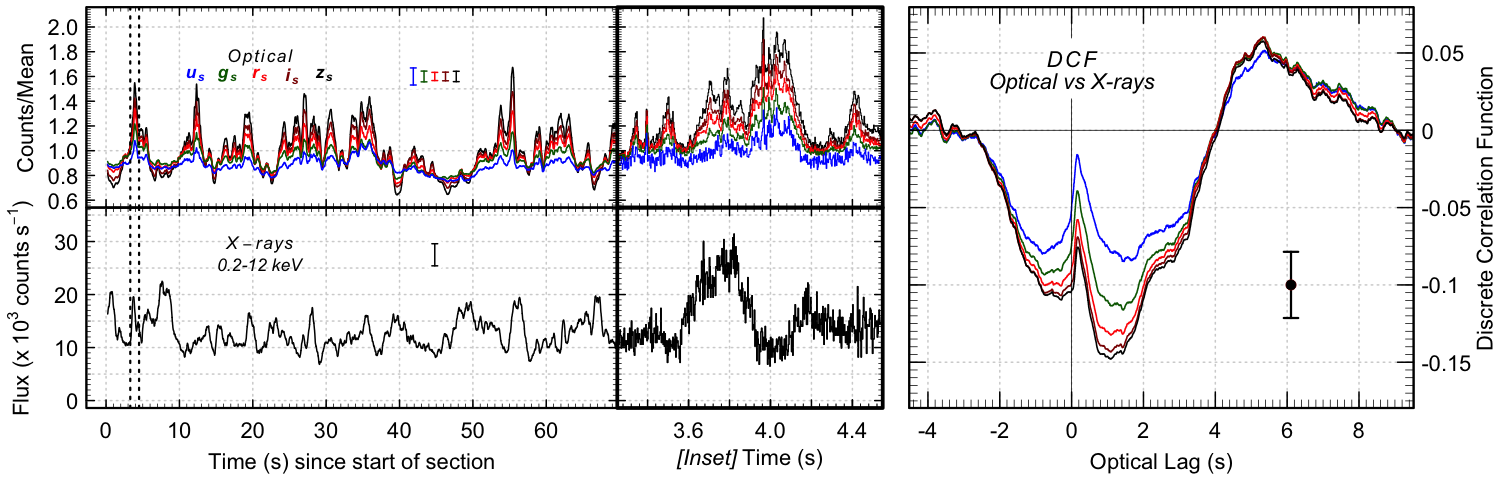
J1820 varied rapidly through the course of the night. Sub-second flares were frequent in all bands, of a factor of 2 in optical and 3 in X-ray. Calibrating the flux using HiPERCAM zero points, we found these variations to be up to one magnitude in scale, stronger at longer wavelengths. Some flares were as short as a few bins across (10 ms). A representative lightcurve segment can be seen in Figure 1.
The simultaneous nature of the observations also allowed us to create Discrete Correlation Functions (DCFs) measuring the correlation between the optical and X-ray lightcurves as a function of time lag. We split the data into 52 segments, each 30s in duration. After pre-whitening the data to remove any red noise trend (Welsh, 1999), we computed the DCF for each segment (Edelson & Krolik, 1988), and the median result was found. Bootstrapping with 10,000 iterations was carried out to find the uncertainties.
The resultant DCFs seen in Figure 1 clearly show three main features: an anti-correlation between -3 – +4 seconds (stronger at longer wavelengths); a positive correlation feature at a lag of +165ms in every band; and a hump between +4–9 seconds (positive time lags denote optical lagging X-rays). Each band closely follows the same pattern. Incredibly, analysis of the sub-second peak found it to vary with wavelength; shorter wavelengths peak earlier than longer ones. These shall be discussed in Section 4.
3.2 Fourier Analysis
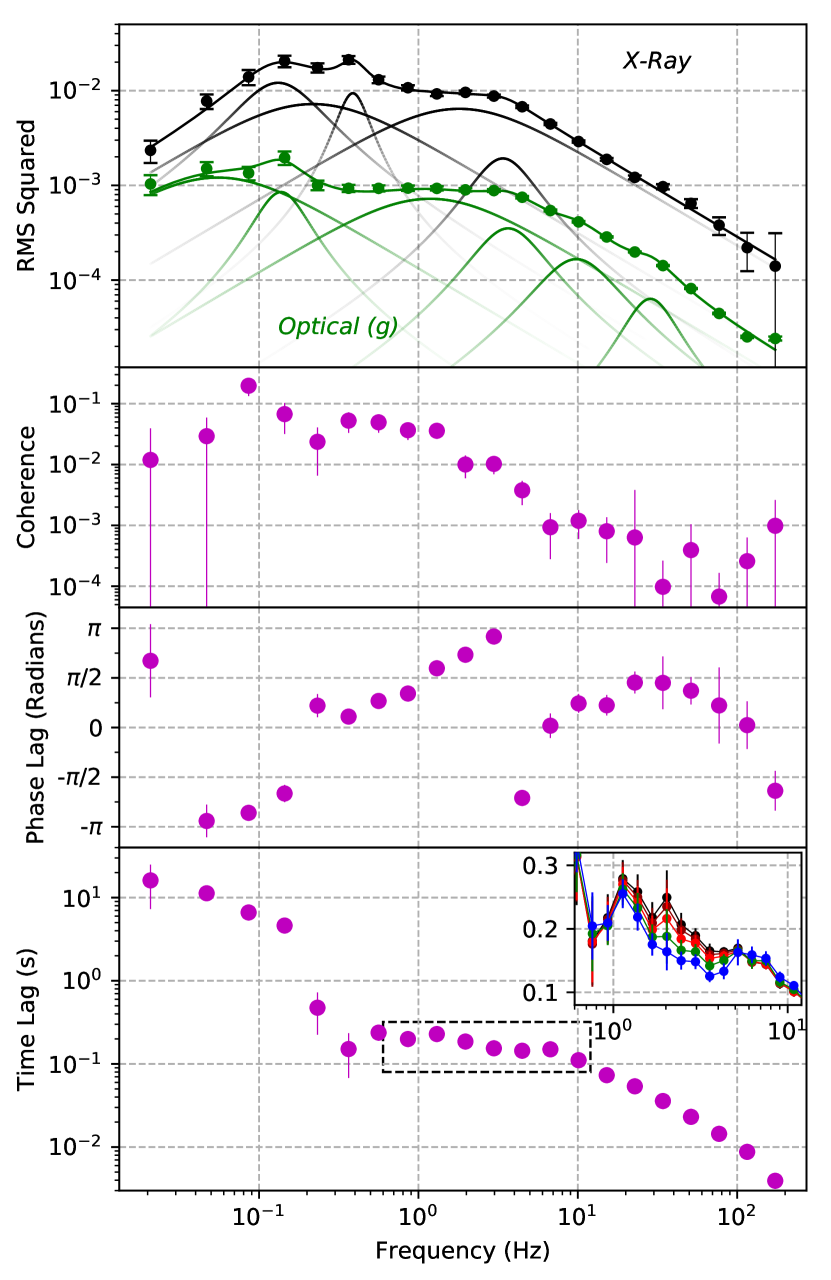
Figure 2 shows the power spectra, coherence, and phase and time lags between and X-rays. The coherence and phase lags represent the relative magnitude and the phase angle of the complex-valued cross spectrum respectively. This analysis made use of the Stingray222https://github.com/StingraySoftware/stingray python package (Huppenkothen et al., 2019), with errors determined using methods described by Vaughan & Nowak (1997). Good Time Intervals (GTIs) were used based on the individual epochs of X-ray observation, then cross spectra were computed over 31 independent lightcurve segments of equal length (16384 bins, 48s) and averaged. RMS squared normalisation was applied to the power spectra (Belloni & Hasinger, 1990). White noise was fit and removed from the power spectra before calculating the cross spectra. Each optical band showed broadly similar features; the band is shown due to its highest signal-to-noise ratio. Our results don’t notably change with different X-ray bands.
For the time lags ( = /2f, where = phase lag and f = frequency), we assume a continuous lag spectrum, and thus allow phase lags outside the range [-,+]. We first determined that the phase lag around 1 Hz is within [-,+] (since the time lags shown there are equivalent to those shown in the DCF), and removed the discontinuities by adding 2 to the phase lags between 0.03–0.2 Hz and above 4 Hz before calculating the time lags - note that this results in only positive time lag values. We also note that the first four points are ambiguous, and could instead be close to - (and thus correspond to negative time lags).
The power spectra (PSDs) for both and X-ray bands show striking similarities. Lorentzian fitting in both bands found a feature at roughly 0.11 Hz, and similar features between 1–3 Hz. Each of these are associated with significant cross-band coherence. The broad feature seems to dominate the PSDs as they decline at higher frequencies. Note that we see significant optical power up beyond 100 Hz.
There are three significant features of the time lags. The first is between 0.02–0.2 Hz, where phase lags of close to + indicate that there is some optical component strongly delayed with respect to the X-rays, or, if they are instead -, that variations at this frequency are mainly anti-correlated. Following that, there is a significant plateau between 0.5–8 Hz at +165 ms, corresponding to the peak sub-second lag found in the DCFs. Beyond 8 Hz, the time lag drops with increasing frequency, consistent with the breaking of the upwards trend in the phase lags.
There are a number of sharp, sudden drops in the coherence; a particular one at 0.2 Hz corresponds to a curious spike in the phase lags and the first discontinuity in the time lags. This frequency, along with frequencies that also feature drops in coherence, tend to coincide with a change in the dominant PSD Lorentzians in both bands. As noted in Vaughan & Nowak (1997), this change can cause a loss of coherence; this is especially true if the origins of the Lorentzians are independent (Wilkinson & Uttley, 2009).
3.3 Wavelength Dependence of sub-second lags
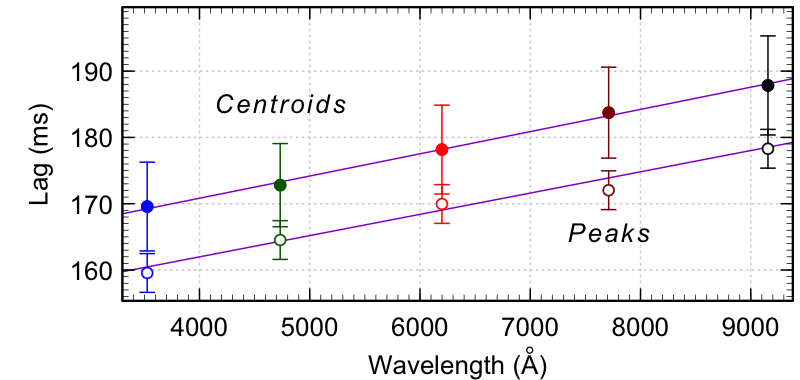
This is the first time that a wavelength dependence has been seen on very short sub-second timescales. To quantify this, we created DCFs using 2s segments of the lightcurve. We then implemented bootstrapping, taking (with replacement) 10,000 samples of segments (with the same sample of segments used for each band). For each iteration, we calculated a mean DCF, and recorded the peak of the sub-second lag (half a lag bin, i.e. 3 ms).
A linear trend was then fitted between peak lag and wavelength for each iteration, and the mean, 16%, and 84% values were calculated to be s Å-1. Centroids were calculated using methods similar to Koratkar & Gaskell (1991) and Gandhi et al. (2017); for each iteration, we summed over all lags where the DCF coefficients were 80% of peak value. The standard deviation was calculated for the entire distribution. A linear fit gave a slope of 3.35 3.03 s Å-1. The results are shown in Figure 3.
When we plot time lags for each optical band, this same qualitative wavelength dependence is present between Fourier frequencies of 1–5 Hz. This can be seen in Figure 2.
4 Discussion
Our observations have highlighted several intriguing features that any interpretation needs to explain. These include: The sub-second lag; the wavelength dependence of this lag; the broad anti-correlation; the slow +5 s positive correlation; the phase lags; and the red flares seen in the lightcurve.
Many of these features have been seen before in LMXBs; sub-second correlations have previously been found in XTE J1118+480 (Kanbach et al., 2001), GX 339-4 (Gandhi et al., 2008; Vincentelli et al., 2018), V404 Cyg (Gandhi et al., 2017), and Swift J1357.2-0933 (Paice et al., 2019). XTE J1118+480 also showed the wavelength-dependence of such a feature, albeit on longer timescales (Hynes et al., 2003) and between the UV and X-ray. Meanwhile, broad anti-correlations are common in LMXBs (Kanbach et al., 2001; Durant et al., 2008; Pahari et al., 2017) as well as red flares (Gandhi et al., 2008, 2016). The very rapid times associated with these features allow direct optical probes of processes very close in to the central engines in LMXBs. The high time resolution and wavelength coverage offered by HiPERCAM/GTC, together with the X-ray bright-source throughput of NICER, is unprecedented, and allows us to investigate the models suggested for these earlier sources at a greater resolution than before.
A scenario that explains many of the observed features is synchrotron emission from internal shocks within a relativistic compact jet. In this model, infalling matter emits X-rays close to the black hole, and plasma shells are accelerated along a jet. These shells, with speeds dependent on the variable inflow of matter, would then collide and shocked material would emit in the optical and infrared (Malzac, 2013). The +165 ms lag would thus be the average travel time for the material between the X-ray corona (analogous to the jet base, Markoff et al. 2005) and the optical emitting regions of the jet; assuming material travelling at light speed, this corresponds to a maximum distance of roughly 4650 RG ( GM/c2) for a 7 M☉ black hole (Torres et al., 2019). An optical lag of 0.1 light-seconds appears, in fact, to be common in LMXBs in the hard state (modulo factors of related to plasma velocity and viewing geometry), and is likely to be constraining the elevation of the first plasma acceleration zone above the black hole (Gandhi et al., 2017).
What can the wavelength dependence tell us? A linear dependence of characteristic emission wavelength with distance from the central compact object (hence, time lag) is far from a novel result, and is in fact a key prediction for the optically-thick emitting zones in compact jet theory (Blandford & Königl, 1979); however, our data only show a roughly 12 % change in lag over the probed optical wavelength range; this is too shallow to be explained by such a linear dependence. Similarly, our slope of 3.25 s Å-1 is a factor of 50 smaller from that found in XTE J1118+480 by Hynes et al. (2003, 160 s Å-1). This is too great a difference to be due to simple length (and thus mass) scaling, and is consistent with the idea that there are other factors that affect these lags, such as inner accretion disc radius and magnetic field strength (Russell et al. 2013).
Instead, we may be seeing the first signs of stratification within the innermost jet emitting zones. Emission here is expected to be optically-thin (e.g. Markoff et al., 2001; Russell et al., 2018), but this is likely only true on average; colliding shocks would create a distribution of velocity shears (Malzac, 2013), with faster shocks peaking at higher spectral frequencies (due to self-absorption) and at slightly shorter lags than slower shocks – in qualitative agreement with the wavelength dependent trends shown in Figs. 2 & 3. This ‘first shock dissipation zone’ has been modelled before (Ceccobello et al. 2018 and references), but the precise time-resolved dissection of data that we present is new, and further specific modelling of the physics behind these lags is needed.
Our low-frequency phase lags support multiple models. The phase lags encompass a range of absolute values between /2 and , and are likely to comprise a mix of components. The magnitudes of the corresponding time lags of few–10 s are associated with both the anti-correlation seen in the DCFs as well as the slower positive correlation at +5 s. A phase lag magnitude of corresponds to the observed anti-correlation. This could arise from Doppler Boosting within the jet; for a given inclination, as the jet Lorentz factor increases, the apparent luminosity of a jet decreases due to relativistic beaming (see Malzac et al. 2018). This leads to apparently less jet optical and infrared flux along the line of sight. Both a high inclination angle or a high jet Lorentz factor could play roles here. Alternatively, a hot flow scenario could also provide a self-consistent explanation (Narayan & Yi, 1994); this is suggested to be present in this source by both Veledina et al. (2019) and Kajava et al. (2019). Here, an increase in mass accretion rate would lead to increased X-ray flux, and a higher level of synchrotron self-absorption. The latter would then lead to a drop in the optical emission (Veledina et al., 2013). Finally, the long positive correlation on optical lags of +5–15 s could originate in disc reprocessing, suggested by both Paice et al. (2018) and Kajava et al. (2019). Multiwavelength modeling and assessment of this scenario will help to constrain the disc extension, and should be carried out in future work.
In Sec. 1, we noted that LMXB emission is considered to be a mixture of processes. The data is not only consistent with elements of each of those, but implies multiple components; from the Fourier analysis, features above 0.2 Hz would be caused by a jet, while those below would be related to accretion variability from the hot flow and disc (Wilkinson & Uttley 2009, Churazov et al. 2001, Done et al. 2007).
MAXI J1820+070 was the brightest LMXB transient in 2018, and studies of its multiwavelength emission will undoubtedly continue to prove valuable. Here, we have presented a first look in the richness of information available on millisecond timescales. We find a novel multiband time-lag trend with wavelength, but also noted that many results echo similar findings in systems like GX 339-4 and V404 Cyg. Indeed, it increasingly seems that time and length scales are similar across LMXBs. Testing this trend through analysis of future LMXB sources should prove most interesting; tests that, with this newest generation of telescopes, we now have the ability to carry out better than ever before.
Acknowledgements
We acknowledge support from STFC and a UGC-UKIERI Thematic Partnership. JAP is part supported by a University of Southampton Central VC Scholarship, and thanks D Ashton for spectral timing help. Observations were made with the GTC telescope (Spanish Observatorio del Roque de los Muchachos, Instituto de Astrofísica de Canarias), under Director’s Discretionary Time. JM acknowleges financial support from PNHE in France, OCEVU Labex (ANR-11-LABX-0060), and the A*MIDEX project (ANR-11-IDEX-0001-02) funded by the “Investissements d’Avenir” French government program managed by the ANR. TS thanks the Spanish Ministry of Economy and Competitiveness (MINECO; grant AYA2017-83216). AV acknowledges the Academy of Finland grant 309308. HiPERCAM and VSD funded by the European Research Council (FP/2007–2013) under ERC-2013-ADG grant agreement no. 340040. SMARTNet helped to coordinate observations. We also thank the referee for their valuable comments. We have made use of software and web tools from the High Energy Astrophysics Science Archive Research Center (HEASARC).
References
- Baglio et al. (2018) Baglio M. C., Russell D. M., Lewis F., 2018, The Astronomer’s Telegram, 11418
- Belloni & Hasinger (1990) Belloni T., Hasinger G., 1990, A&A, 230, 103
- Blandford & Königl (1979) Blandford R. D., Königl A., 1979, ApJ, 232, 34
- Ceccobello et al. (2018) Ceccobello C., et al., 2018, MNRAS, 473, 4417
- Churazov et al. (2001) Churazov E., Gilfanov M., Revnivtsev M., 2001, MNRAS, 321, 759
- Corral-Santana et al. (2016) Corral-Santana J. M., et al., 2016, A&A, 587, A61
- Dhillon et al. (2018) Dhillon V., et al., 2018, in Ground-based and Airborne Instrumentation for Astronomy VII. p. 107020L (arXiv:1807.00557), doi:10.1117/12.2312041
- Done et al. (2007) Done C., Gierliński M., Kubota A., 2007, The Astronomy and Astrophysics Review, 15, 1
- Durant et al. (2008) Durant M., et al., 2008, The Astrophysical Journal Letters, 682, L45
- Edelson & Krolik (1988) Edelson R. A., Krolik J. H., 1988, ApJ, 333, 646
- Fabian et al. (1982) Fabian A. C., et al., 1982, A&A, 111, L9
- Gandhi et al. (2008) Gandhi P., et al., 2008, MNRAS, 390, L29
- Gandhi et al. (2016) Gandhi P., et al., 2016, Monthly Notices of the Royal Astronomical Society, 459, 554
- Gandhi et al. (2017) Gandhi P., et al., 2017, Nature Astronomy, 1, 859
- Gandhi et al. (2019) Gandhi P., Rao A., Johnson M. A. C., Paice J. A., Maccarone T. J., 2019, MNRAS, 485, 2642
- Henden et al. (2015) Henden A. A., Levine S., Terrell D., Welch D. L., 2015, in American Astronomical Society Meeting Abstracts #225. p. 336.16
- Homan et al. (2018) Homan J., et al., 2018, The Astronomer’s Telegram, 11576
- Huppenkothen et al. (2019) Huppenkothen D., et al., 2019, p. arXiv:1901.07681
- Hynes et al. (2003) Hynes R. I., et al., 2003, MNRAS, 345, 292
- Kajava et al. (2019) Kajava J. J. E., et al., 2019, arXiv e-prints, p. arXiv:1906.06519
- Kanbach et al. (2001) Kanbach G., et al., 2001, Nature, 414, 180
- Kawamuro et al. (2018) Kawamuro T., et al., 2018, The Astronomer’s Telegram, 11399
- King & Ritter (1998) King A. R., Ritter H., 1998, MNRAS, 293, L42
- Koratkar & Gaskell (1991) Koratkar A. P., Gaskell C. M., 1991, ApJS, 75, 719
- Malzac (2013) Malzac J., 2013, MNRAS, 429, L20
- Malzac (2018) Malzac J., 2018, p. arXiv:1804.03451
- Malzac et al. (2018) Malzac J., et al., 2018, MNRAS, 480, 2054
- Markoff et al. (2001) Markoff S., Falcke H., Fender R., 2001, A&A, 372, L25
- Markoff et al. (2005) Markoff S., Nowak M. A., Wilms J., 2005, ApJ, 635, 1203
- Narayan & Yi (1994) Narayan R., Yi I., 1994, ApJ, 428, L13
- Pahari et al. (2017) Pahari M., et al., 2017, MNRAS, 469, 193
- Paice et al. (2018) Paice J. A., et al., 2018, The Astronomer’s Telegram, 11432, 1
- Paice et al. (2019) Paice J. A., et al., 2019, MNRAS, 488, 512
- Russell et al. (2013) Russell D. M., et al., 2013, ApJ, 768, L35
- Russell et al. (2018) Russell D. M., et al., 2018, The Astronomer’s Telegram, 11533
- Shidatsu et al. (2019) Shidatsu M., et al., 2019, ApJ, 874, 183
- Torres et al. (2019) Torres M. A. P., et al., 2019, arXiv e-prints, p. arXiv:1907.00938
- Tucker et al. (2018) Tucker M. A., et al., 2018, ApJ, 867, L9
- Uttley et al. (2018) Uttley P., et al., 2018, The Astronomer’s Telegram, 11423
- Vaughan & Nowak (1997) Vaughan B. A., Nowak M. A., 1997, ApJ, 474, L43
- Veledina et al. (2011) Veledina A., Poutanen J., Vurm I., 2011, The Astrophysical Journal Letters, 737, L17
- Veledina et al. (2013) Veledina A., Poutanen J., Vurm I., 2013, MNRAS, 430, 3196
- Veledina et al. (2019) Veledina et al., 2019, A&A, 623, A75
- Vincentelli et al. (2018) Vincentelli F. M., et al., 2018, MNRAS, 477, 4524
- Welsh (1999) Welsh W. F., 1999, PASP, 111, 1347
- Wilkinson & Uttley (2009) Wilkinson T., Uttley P., 2009, MNRAS, 397, 666