X-ray properties of quasars
Abstract
We present XMM-Newton X-ray observations and analysis of three DES quasars (VDES J00203653 at , VDES J02445008 at and VDES J02244711 at ) and six other quasars with from the XMM-Newton public archive. Two of the nine quasars are detected at a high (4) significance level: VDES J02244711(z=6.53) at and PSO J15902 () at . They have a photon index of and respectively, which is consistent with the mean value of found for quasars at all redshifts. The rest-frame keV luminosity of VDES J02244711, is , which makes this quasar one of the most X-ray luminous quasars at and the most X-ray luminous quasar at , with a luminosity 6 times and 2.5 times larger than ULAS J1120+0641 () and ULAS J1342+0928 () respectively. The X-ray-to-optical power-law slopes of the nine quasars are consistent with the previously observed anti-correlation of with UV luminosity . We find no evidence for evolution of with redshift when the anti-correlation with UV luminosity is taken into account. Similar to previous studies at z6 we have found remarkably consistent X-ray spectral properties between low (z1) and high-redshift quasars. Our results add further evidence to the picture that the observable properties of high luminosity quasars over the UV to X-ray spectral region have not evolved significantly from to the present day and that quasars comparable to local versions existed 800 million years after the big bang.
keywords:
dark ages – reionisation – galaxies: active – galaxies: high redshift – X-rays: galaxies1 Introduction
| Object | R.A. | Dec | Obs. Date | a | XMM | PI | Refb | ||
|---|---|---|---|---|---|---|---|---|---|
| () | (ks) | OBSID | |||||||
| VDES J00203653 | 5.13113 | -36.89494 | 6.834 | 1.53 | 2018 May 14 | 24.8 | 0824400101 | Pons E. | 2/2 |
| VDES J02445008 | 41.00425 | -50.14825 | 6.724 | 2.55 | 2018 May 16 | 17.0 | 0824400201 | Pons E. | 2/2 |
| VDES J02244711 | 36.11058 | -47.19149 | 6.526 | 1.66 | 2018 May 25 | 26.1 | 0824400301 | Pons E. | 1/2 |
| PSO J338.2298+29.5089 | 338.22975 | 29.50897 | 6.658 | 6.17 | 2017 Nov. 26 | 23.7 | 0803160301 | Schartel N. | 4/4 |
| VIK J01093047 | 17.47138 | -30.79064 | 6.747 | 2.32 | 2017 Dec. 06 | 6.0 | 0803160201 | Schartel N. | 3/8 |
| PSO J159.225702.5438 | 159.22579 | -2.54386 | 6.38 | 4.74 | 2017 Dec. 22 | 19.9 | 0803161101 | Schartel N. | 5/5 |
| VIK J03053150 | 46.32050 | -31.84886 | 6.605 | 1.42 | 2018 Jan. 05 | 22.0 | 0803160401 | Schartel N. | 3/8 |
| PSO J036.5078+03.0498 | 36.50779 | 3.04983 | 6.541 | 3.04 | 2018 Jan. 16 | 16.8 | 0803160501 | Schartel N. | 4/4 |
| CFHQS J02100456 | 32.55496 | -4.93914 | 6.438 | 1.88 | 2018 Feb. 02 | 8.4 | 0803160701 | Schartel N. | 6/7 |
-
a
EPIC net exposure times after high particle background filtering. Mean between the pn and MOS detectors.
- b
High-redshift quasars with are important probes of the Universe during the epoch of Reionization providing information about the formation, growth and evolution of supermassive black holes (SMBH) and their host galaxies: indeed the presence of at , 800 million years after the big bang is a challenge for models of black-hole formation and growth (Volonteri, 2010; Alexander & Natarajan, 2014; Trakhtenbrot et al., 2017). In the last decade, about 30 quasars have been discovered mainly from large-area optical and near-infrared imaging survey such as the CFHT Legacy Survey (CFHTLS; Willott et al., 2010a), Pan-STARRS (Venemans et al., 2015; Tang et al., 2017; Mazzucchelli et al., 2017), the Dark Energy Survey (DES; Reed et al., 2017, 2019; Yang et al., 2019), the Dark Energy Spectroscopic Instrument Legacy Imaging Surveys (DELS; Wang et al., 2017, 2018b, 2018a), the Subaru HSC-SSP survey (Matsuoka et al., 2016, 2018a, 2018b, 2019), VISTA (Venemans et al., 2013; Pons et al., 2019) and the UKIRT InfraRed Deep Sky Surveys-Large Area Survey (ULAS; Mortlock et al., 2011; Bañados et al., 2018a).
X-ray observations are a very powerful tool to understand quasars providing information on the region close to the central SMBH. However only two quasars have published observation at X-rays; ULAS J1120+0641 at Page et al. (2014) and ULAS J1342+0928 at Bañados et al. (2018b). X-ray studies of high-redshift () quasars have shown that their optical and X-ray properties are similar to those of low redshift quasars with similar average X-ray spectral photon index (see for example Farrah et al., 2004; Page et al., 2005; Nanni et al., 2017) and comparable luminosity at . Also, no dependence of the optical-to-X-ray slope () with redshift have been found up to (Brandt et al., 2002; Steffen et al., 2006) - the apparent correlation being only an artifact from the dependence of with the redshift (Steffen et al., 2006; Lusso et al., 2010) - suggesting that the central X-ray energy source of quasars does not evolve strongly over cosmic time. Furthermore, previous work (Steffen et al., 2006; Lusso et al., 2010) has found evidence that anti-correlates with the quasar UV luminosity , with more luminous quasars having more negative values of (i.e. i.e. relativle less X-ray emission as increases). This indicates that for powerful quasars the X-ray emission produced by the hot corona is weaker relative to the UV and optical emission from the disk.
In order to improve our knowledge of the X-ray properties of quasars, in this paper we report XMM-Newton observations and analysis of a sample of nine quasars with ; three quasars from the Dark Energy Survey (DES) at , VDES J00203653 (), VDES J02445008 () VDES J02244711 () and of six other quasars with from the XMM-Newton public archive in Section 2. The data analysis of these sources is presented in Section 3 and and finally in Section 4, we discuss the X-ray and optical properties of the nine quasars in our sample compared to previous X-ray observations of high-redshift quasars. We assume a flat cosmology with , and .
2 XMM observations and data reduction
In this paper we present the XMM-Newton of three spectroscopically confirmed high-redshift () quasars recently discovered using observations from the Dark Energy Survey (DES) Reed et al. (2017, 2019) though colour selection and spectral energy distribution fitting of DES optical, VISTA near-infrared and WISE mid-infrared photometry. XMM-Newton observing time were allocated through the call of proposal for period AO-17, and they were observed in 2018 May with 28.3ks, 28.0ks and 35.9ks exposure for VDES J00203653, VDES J02445008 and VDES J02244711 respectively. In addition we present the analysis of six other quasars with with X-ray observations in the XMM-Newton public archive. These six quasars were also selected from wide field optical and near-IR surveys i.e. CFHTLS (Willott et al., 2010a), Pan-STARRS1 (Bañados et al., 2016; Venemans et al., 2015) and VISTA VIKING (Venemans et al., 2013). They have been observed between 2017 November and 2018 February for a total observing time of 23 to 33ks. The redshifts as well as the X-ray observations log for the full sample of 9 z6.4 quasars are reported in Table 1 and J-band continuum magnitudes are given in Table 4.
The X-ray observational data were obtained with the European Photon Imaging Camera (EPIC; Strüder et al., 2001; Turner et al., 2001), which consists of one pn and two MOS cameras, and was operated in full-frame mode with thin filters for all the observations. The data were processed using the standard XMM-Newton Science Analysis Software (SAS) with version 17.0.0. We excluded time intervals affected by high particle background through inspection of the light curves in the 1012 keV energy range, resulting of net exposure times between 17.0 and 26ks (see Table 1). To construct events files we used the standard EPIC events pattern selection; i.e. 012 and 04 for MOS and pn respectively. We then produced images in five energy bands: 0.210, 0.20.5, 0.52.0, 2.05.0 and 5.010.0 keV.
To check if the sources were detected and measure the X-ray flux, we performed a simultaneous EPIC (pn+MOS) sources detection in each band using the SAS task edetect_chain with a detection likelihood threshold of 10 (corresponding to ). We also used the SAS task eregionanalyse to compute fluxes or perform upper limit estimations in each energy bands on the pn and MOS images, by extracting the number of counts in a circular region of 10 radius. To get an accurate estimation of the number of counts, we used the exposure map created by the edetect_chain task and we selected a background circular region adjacent to the target and on the same chip, free of sources, with a larger radius.
In order to convert the count rates to flux for our different energy ranges and detectors, we computed energy conversion factors (ecf) using WebPIMMS, converting from a XMM-MOS/pn thin count rate to a flux assuming a power-law spectral shape with a slope of 1.9 modified by galactic absorption. The EPIC parameters (i.e. source counts, count rates and fluxes, HR) correspond to the weighted mean of the values obtained for the pn, MOS1 and MOS2 cameras. When the resulting flux values are smaller than their 3 errors the upper limits are given.
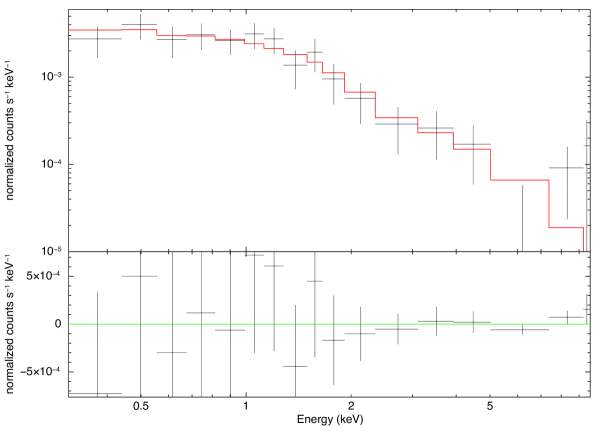
In the case where an X-ray source is detected at greater than (i.e. VDES J02244711 and PSO J15902, see Section 3), we extracted a spectrum from a 15/11 radius region around the target position in the pn/MOS detectors. The background spectrum was extracted on the same region that the one used by the eregionanalyse task. We then combined the pn and MOS spectra into a single EPIC spectrum using the epicspeccombine, with corresponding background spectra and response matrix also combined. For the resulting EPIC spectra, we grouped the data with only one count per bin, due to low number of counts.
3 Results
From our three DES targets, only one has been clearly detected in the X-rays: VDES J02244711. Its detected net counts in the full 0.210 keV energy range is 174, corresponding to a flux of with a detection significance of ; the X-ray source is clearly visible on the image Figure 1. It is also detected individually in the 0.52.0 keV energy range with 118 net counts and a detection significance of (see Table 2). The separation between the optical position of this quasar and the XMM detection is only 2.52, with the uncertainty on the X-ray position beeing less than 1 ().
The two other DES quasars, VDES J02445008 and VDES J00203653, are not detected using the edetect_chain task. From the eregionanalyse task, VDES J00203653 have about 100 net counts in the 0.210keV energy range, corresponding to a flux of . Finally, VDES J02445008 have only 45 counts in the full energy range and a flux of .
The EPIC spectrum for VDES J02244711 is shown in Figure 2. We fit it using XSPEC with a single power-law model (zpo) modified by Galactic absorption (tbabs). Due to the low number of counts, we used the Cash statistic Cash (1979). With the Galaxy absorption component kept fix, we found a photon index on with for 161 degrees of freedom and get a flux in the 210keV energy range of . Such a value of is consistent with what is observed for quasars in the low (Page et al., 2005; Piconcelli et al., 2005; Just et al., 2007) and high (Shemmer et al., 2005; Nanni et al., 2017) redshift Universe.
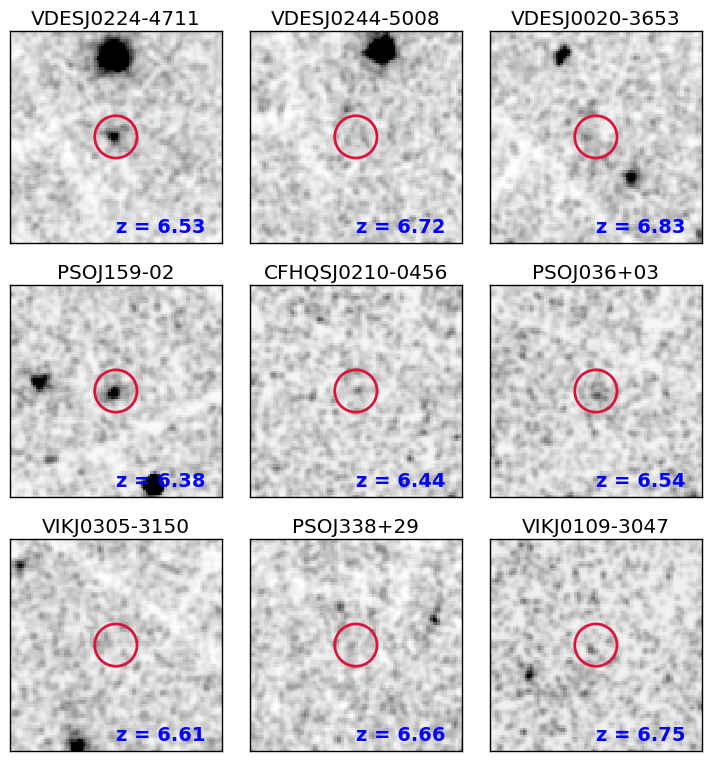
For the three DES quasars, the EPIC net source counts (i.e. after background subtraction) and fluxes in the full (0.210 keV) energy range in in the 0.20.5, 0.52.0, 2.05.0 and 5.010.0 keV energy ranges are given in Table 2. The full band XMM 100 EPIC mosaic of the DES quasars are shown in Figure 1 (top row).
| Energy range | Net counts | Flux | Det. |
|---|---|---|---|
| () | |||
| VDES J02244711 () | |||
| 0.2 - 10 keV | |||
| 0.2 - 0.5 keV | |||
| 0.5 - 2.0 keV | |||
| 2.0 - 5.0 keV | |||
| 5.0 - 10 keV | |||
| VDES J02445008 () | |||
| 0.2 - 10 keV | |||
| 0.2 - 0.5 keV | |||
| 0.5 - 2.0 keV | |||
| 2.0 - 5.0 keV | |||
| 5.0 - 10 keV | |||
| VDES J00203653 () | |||
| 0.2 - 10 keV | |||
| 0.2 - 0.5 keV | |||
| 0.5 - 2.0 keV | |||
| 2.0 - 5.0 keV | |||
| 5.0 - 10 keV | |||
Note: The upper limits quoted in this table correspond to the upper limits and are used only if the nets counts or fluxes are smaller than their error. But only the quasars with a given value in the ”Det” column have an X-ray detection.
Among the six other quasars, only PSO J159.225702.5438 () has been detected with 127 counts in the 0.210 keV band, corresponding to a flux of , and a detection significance of . It is also detected individually in the 0.52.0 keV and 2.05.0 keV energy bands with 84 counts ( significance) and 27 counts ( significance) respectively. As for VDES J0224-4711, the separation between the optical and X-ray positions is quite small () and the error on the XMM position is only . From fitting its spectrum with a single power-law modified by Galactic absorption, we get a photon index of ( for 115 degrees of freedom), similar to what we found for VDES J02244711, and we obtained a 210 keV flux of . For the undetected 5 other quasars we provide estimation of the net source counts and fluxes from the eregionanalyse task. They have less than 35 counts in the full band, for three of them we even only get upper limits. The EPIC net source counts and fluxes in the full (0.210 keV) energy range in in the 0.20.5, 0.52.0, 2.05.0 and 5.010.0 keV energy ranges obtained for these quasars are summarised in Table 3. The full band XMM 100 EPIC mosaic of these 6 quasars are shown in Figure 1 (rows 2 and 3).
For the two X-ray detected quasars in this work, the source counts and fluxes presented in Tables 2 and 3 are from the edetect_chain task.
| Energy range | Net counts | Flux | Det. |
|---|---|---|---|
| () | |||
| PSO J159.225702.5438 () | |||
| 0.2 - 10 keV | |||
| 0.2 - 0.5 keV | |||
| 0.5 - 2.0 keV | |||
| 2.0 - 5.0 keV | |||
| 5.0 - 10 keV | |||
| CFHQS J02100456 () | |||
| 0.2 - 10 keV | |||
| 0.2 - 0.5 keV | |||
| 0.5 - 2.0 keV | |||
| 2.0 - 5.0 keV | |||
| 5.0 - 10 keV | |||
| PSO J036.5078+03.0498 () | |||
| 0.2 - 10 keV | |||
| 0.2 - 0.5 keV | |||
| 0.5 - 2.0 keV | |||
| 2.0 - 5.0 keV | |||
| 5.0 - 10 keV | |||
| VIK J03053150 () | |||
| 0.2 - 10 keV | |||
| 0.2 - 0.5 keV | |||
| 0.5 - 2.0 keV | |||
| 2.0 - 5.0 keV | |||
| 5.0 - 10 keV | |||
| PSO J338.2298+29.5089 () | |||
| 0.2 - 10 keV | |||
| 0.2 - 0.5 keV | |||
| 0.5 - 2.0 keV | |||
| 2.0 - 5.0 keV | |||
| 5.0 - 10 keV | |||
| VIK J01093047 () | |||
| 0.2 - 10 keV | |||
| 0.2 - 0.5 keV | |||
| 0.5 - 2.0 keV | |||
| 2.0 - 5.0 keV | |||
| 5.0 - 10 keV | |||
Note: The upper limits quoted in this table correspond to the upper limits and are used only if the nets counts or fluxes are smaller than their error. But only the quasars with a given value in the ”Det” column have an X-ray detection.
4 Discussion
For the full sample of nine quasars we derived a set of optical and X-ray properties (see Table 4):
-
–
The absolute magnitude at the rest-frame wavelength of () was computed by extrapolating the J-band magnitude to the monochromatic magnitude at () assuming a power-law fit of the continuum in the UV-optical with (Selsing et al., 2016).
-
–
The monochromatic flux at the rest-frame wavelength of () was derived from assuming also a power-law slope of .
-
–
The X-ray luminosity in the rest-frame 2-10 keV band was computed from the count rate obtained by the eregionanalyse task on the 2-10 keV image (as done in Section 2 for the other energy ranges) and then K-correction was applied assuming a photon index . For the two detected quasars VDES J0224-4711 and PSO J159.2257-02.5438 the flux was obtained directly from their X-ray spectrum. Upper limits are used if the luminosity is smaller than three times its error (which is the case for all the non-detected sources) and are at the level.
-
–
The hardness ratio is defined as where S and H are the number of counts in the soft (0.5-2.0 keV) and hard (2.0-5.0 keV) bands.
-
–
The optical-to-X-ray slope () is defined as
(1) where is the monochromatic flux at the rest-frame wavelength of as defined above and the rest-frame monochromatic flux at 2 keV () was inferred from the flux in the 0.2-10 keV range assuming a photon index Upper-limits for are used if the flux at 2 keV is smaller than three times its error.
| Object | z | HR | a | ||||
|---|---|---|---|---|---|---|---|
| () | () | ||||||
| VDES J02244711 | 6.526 | ||||||
| VDES J02445008 | 6.724 | ||||||
| VDES J00203653 | 6.834 | ||||||
| PSO J15902 | 6.38 | ||||||
| CFHQS J02100456 | 6.438 | ||||||
| PSO J036+03 | 6.541 | ||||||
| VIK J03053150 | 6.605 | ||||||
| PSO J338+29 | 6.658 | ||||||
| VIK J01093047 | 6.747 |
-
a
Reminder: A non-upper limt on the slope does not imply a significant detection. Only VDES J0224-4711 and PSO J159-02 are detected in the X-rays. Upper-limits are used only if the flux at 2keV is smaller that its 3 error.
 |
 |
We used the compilation of X-ray observations of quasars at by Nanni et al. (2017) plus the new analysis by Nanni et al. (2018) for SDSS J1030+0524 (z=6.28) and the observation of ULAS J1342+0928 (z=7.54) by Bañados et al. (2018b) to compare with the properties of our new sample. This new sample allows us to fill the gap between of observed high-redshift quasars in the X-rays.
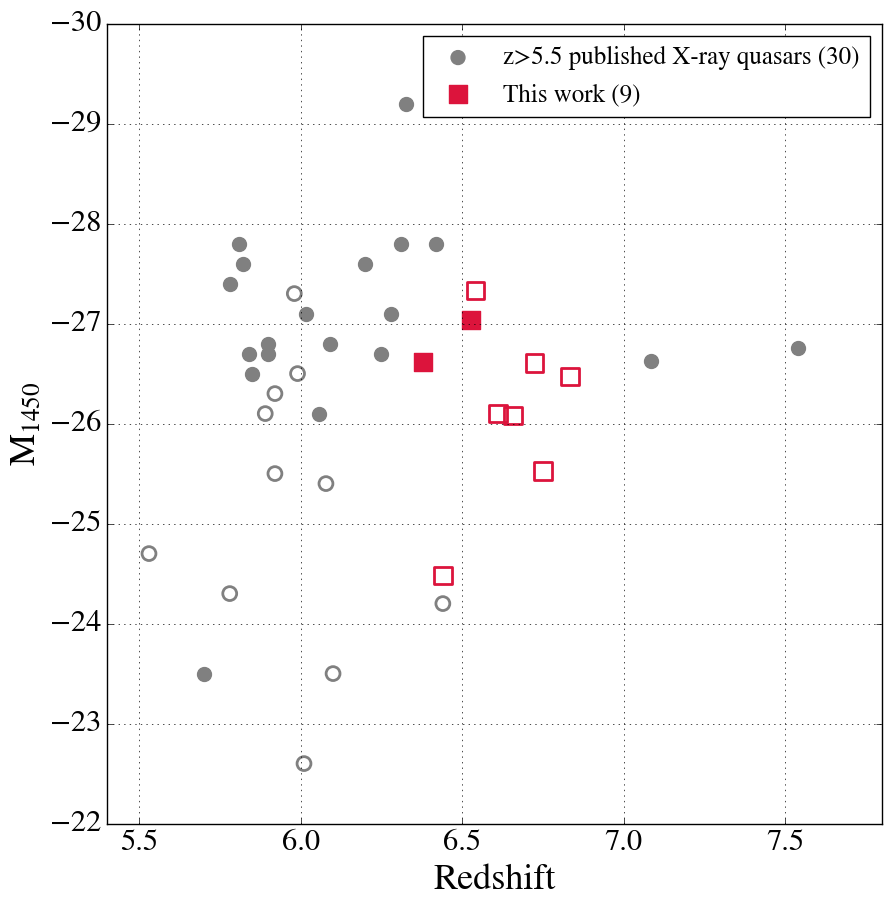
The magnitude versus redshift distribution of the X-ray observed quasars is shown in Figure 3. The median absolute magnitude at is for the nine newly observed quasars, which is similar to the median value () for the sample of previously known quasars including the two quasars at . Only one quasar with has been previously detected in the X-rays (RD J1148+5253, ; Gallerani et al., 2017). This quasar was a serendipitous detection in the 78ks Chandra observation of the quasar SDSSJ1148+5251. It has about 4 times more exposure time than the other X-ray detected high-redshift quasars, and only counts were detected. For comparison, the lowest UV luminosity source in our sample, CFHQS J02100456 (), has an upper limit of 14 counts in the 0.2-10 keV band.
For the two X-ray detected quasars, we found that their X-ray spectra are well fitted with a standard AGN model which consists of a power-law modified by Galactic absorption. The power-law has a photon index which is consistent with value observed at quasars by Nanni et al. (2017) and also with lower redshift quasars, as firstly observed by Nandra et al. (1997). Another indicator of the X-ra spectral shape is the hardness ratio. In the absence of obscuration low and high redshift quasars should appear soft in the X-rays and are expected to have a low hardness ration with (Wang et al., 2004). For the sources with enough counts we obtained an hardness ratio (see Table 4), similar to what is expected for high-redshift quasars and also what have been observed in quasars Nanni et al. (2017).
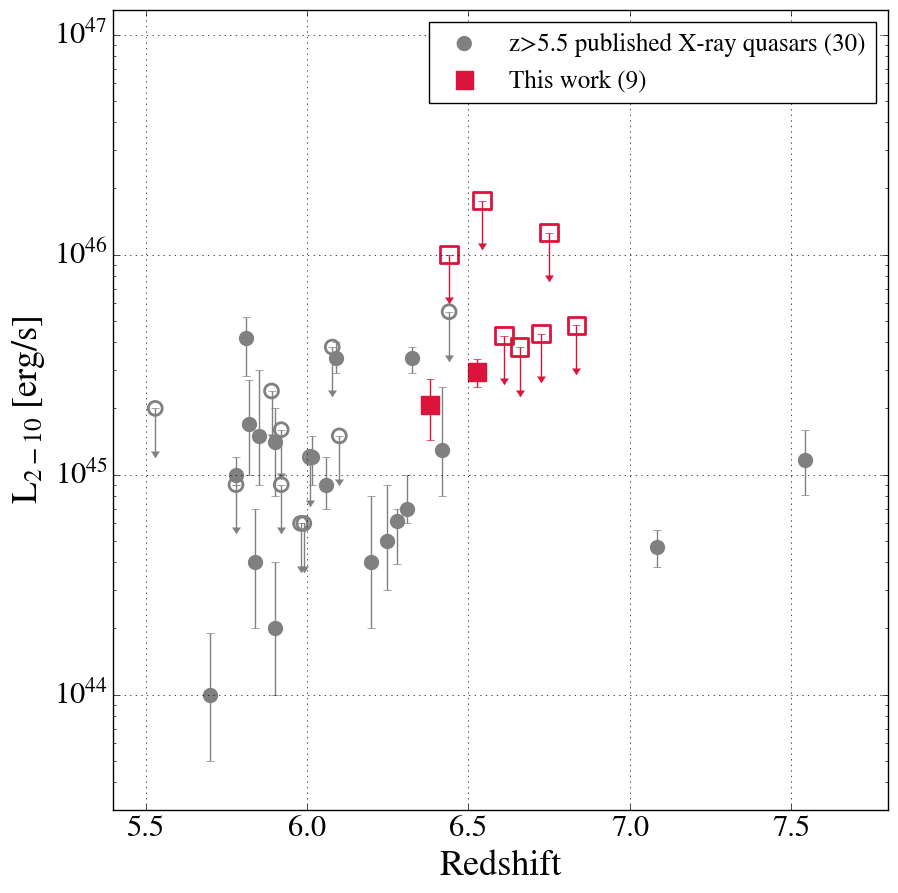
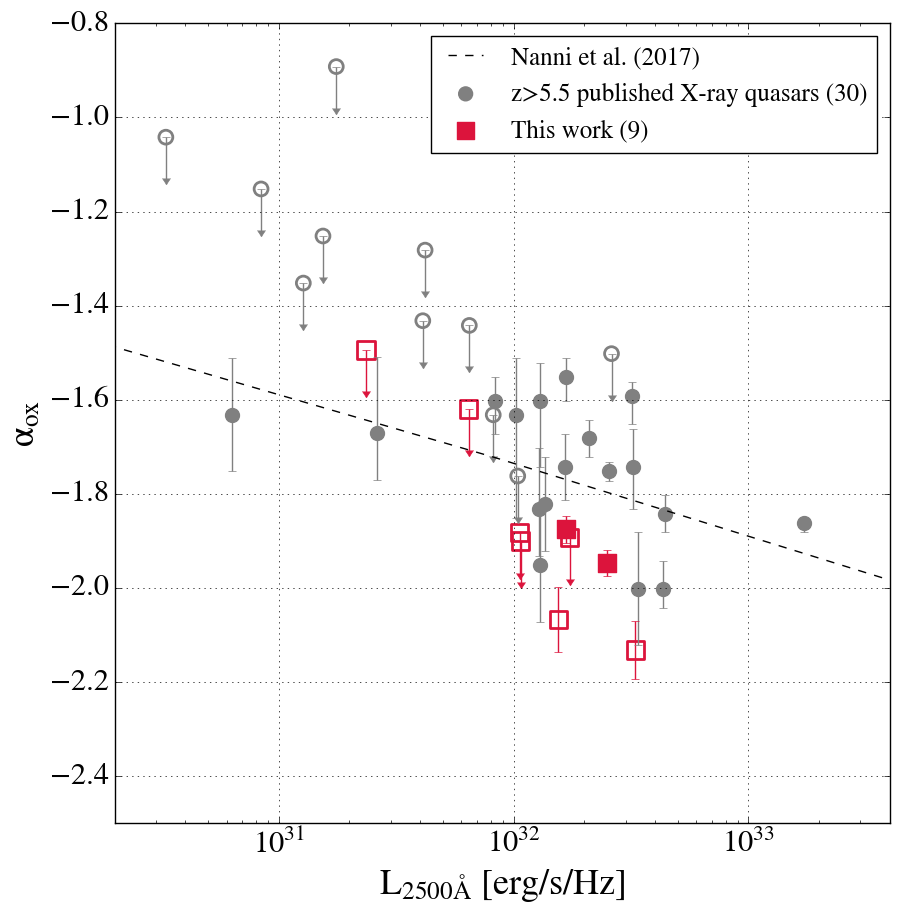
On the left panel of Figure 4 we show the X-ray luminosity in the rest-frame 2-10 keV band (). The new detected sources in our work are amongst the most luminous X-ray quasars at with . VDES J02244711 which is the only DES quasar detected in the X-rays has a rest-frame keV luminosity of , 6 times and 2.5 times larger than the ULAS J1120+0641 () and ULAS J1342+0928 () respectively. The only other quasar detected is PSO J15902 with , i.e. a value similar to VDES J02244711. The other quasars have upper limits in their X-ray luminosity with .
The optical-to-X-ray slope computed for the quasars in our sample is consistent with the observed correlation inferred by Nanni et al. (2017) who added 29 quasars with to the a sample of a thousand lower redshift quasars (see the right panel of Figure 4). These luminous quasars at follow the trend of decreasing as increases, as found in previous studies (Steffen et al., 2006; Lusso et al., 2010) for quasars at lower redshift. To be consistent we re-computed the and from Nanni et al. (2017) assuming a power-law slope in the UV-optical of (while is used by Nanni et al. (2017)). Changing the slope only has a small effect, as increases by and is larger by 0.018.
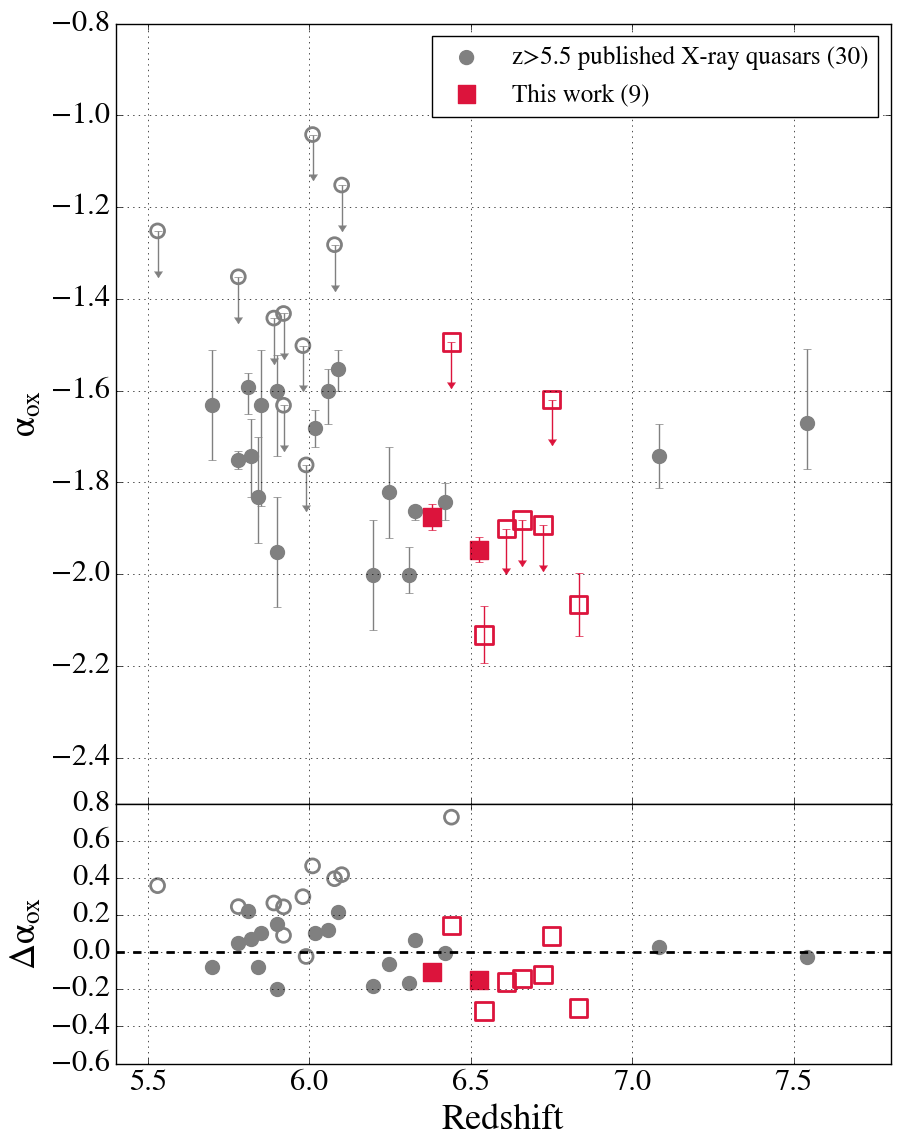
Previous studies of in quasars (Strateva et al., 2005; Shemmer et al., 2005; Just et al., 2007; Lusso et al., 2010) have tested for possible redshift dependence of but they did not find any significant correlation between the two. The apparent correlation between and the redshift (i.e. seems to decrease as the redshift increases from up to ) for quasars with broad range of luminosity is in fact only an artifact due to the effect of the optical luminosity. The X-ray quasars at span a narrower range of optical luminosity () and we do not observe any obvious evolution of with redshift (see Figure 5; top panel), especially when correcting for the effect of the luminosity (see Figure 5; bottom panel).
5 Conclusion
We present XMM-Newton X-ray observations and analysis of three quasars previously discovered in the Dark Energy Survey and the X-ray analysis of six other quasars with from the XMM-Newton public archive. The analysis of these sources show that two quasars VDES J02244711 () and PSO J15902 () are detected in the X-rays 0.2-10 keV energy band. VDES J02244711 is detected with a significance of and net counts corresponding to a flux of . PSO J15902 is detected with a significance of , and net counts, corresponding to a flux of .
VDES J02244711 is also detected individually in the 0.52.0 keV soft band and PSO J15902 has individual detection in both the 0.52.0 keV and 2.05.0 keV bands. The X-ray spectra are well fitted with a power-law with a photon index and respectively, similarly to what is observed in other quasars at lower redshifts (Nanni et al., 2017). For the seven other quasars undetected in the X-ray (i.e. detection significance ) we were still able to estimate X-ray fluxes (or upper limits) by extracting the number of counts in a circular region around the source position.
The X-ray observations of these 9 quasars allow us to fill the gap in the redshift distribution of high redshift quasars observed in the X-rays for . Prior to this work, only two quasars ULAS J1120+0641 and ULAS J1342+0928 had X-ray observations among the known quasars at . We find that the quasars in our sample have similar magnitudes compared to X-ray observed quasars at with the exception of CFHQS J02100456 which has one the faintest magnitude (). Furthermore, for the quasars with discrete measurements of , we find that they are among the brightest X-ray quasars at with , with VDES J02244711 and PSO J15902 - the two quasars with clear X-ray detections - being 6 times an 2.5 times larger than the ULAS J1120+0641 () and ULAS J1342+0928 (). Finally the optical-to-X-ray slope we get for the quasars in our sample is consistent with the anti-correlation inferred by Nanni et al. (2017) based on low and high-redshift quasars.
Acknowledgements
EP, RGM acknowledge the support of UK Science and Technology research Council (STFC). RGM also acknowledges support by ERC Advanced Grant 320596 The Emergence of Structure during the Epoch of reionization. This work was made possible thanks to observations obtained with XMM-Newton, an ESA science mission with instruments and contributions directly funded by ESA Member States and NASA.
References
- Alexander & Natarajan (2014) Alexander T., Natarajan P., 2014, Science, 345, 1330
- Bañados et al. (2016) Bañados E., et al., 2016, ApJS, 227, 11
- Bañados et al. (2018a) Bañados E., et al., 2018a, Nature, 553, 473
- Bañados et al. (2018b) Bañados E., et al., 2018b, ApJ, 856, L25
- Brandt et al. (2002) Brandt W. N., et al., 2002, ApJ, 569, L5
- Cash (1979) Cash W., 1979, ApJ, 228, 939
- De Rosa et al. (2014) De Rosa G., et al., 2014, ApJ, 790, 145
- Farrah et al. (2004) Farrah D., Priddey R., Wilman R., Haehnelt M., McMahon R., 2004, ApJ, 611, L13
- Gallerani et al. (2017) Gallerani S., et al., 2017, MNRAS, 467, 3590
- Just et al. (2007) Just D. W., Brandt W. N., Shemmer O., Steffen A. T., Schneider D. P., Chartas G., Garmire G. P., 2007, ApJ, 665, 1004
- Lusso et al. (2010) Lusso E., et al., 2010, A&A, 512, A34
- Matsuoka et al. (2016) Matsuoka Y., et al., 2016, ApJ, 828, 26
- Matsuoka et al. (2018a) Matsuoka Y., et al., 2018a, PASJ, 70, S35
- Matsuoka et al. (2018b) Matsuoka Y., et al., 2018b, ApJ, 869, 150
- Matsuoka et al. (2019) Matsuoka Y., et al., 2019, ApJ, 872, L2
- Mazzucchelli et al. (2017) Mazzucchelli C., et al., 2017, ApJ, 849, 91
- Mortlock et al. (2011) Mortlock D. J., et al., 2011, Nature, 474, 616
- Nandra et al. (1997) Nandra K., George I. M., Mushotzky R. F., Turner T. J., Yaqoob T., 1997, ApJ, 477, 602
- Nanni et al. (2017) Nanni R., Vignali C., Gilli R., Moretti A., Brandt W. N., 2017, A&A, 603, A128
- Nanni et al. (2018) Nanni R., et al., 2018, A&A, 614, A121
- Page et al. (2005) Page K. L., Reeves J. N., O’Brien P. T., Turner M. J. L., 2005, MNRAS, 364, 195
- Page et al. (2014) Page M. J., Simpson C., Mortlock D. J., Warren S. J., Hewett P. C., Venemans B. P., McMahon R. G., 2014, MNRAS, 440, L91
- Piconcelli et al. (2005) Piconcelli E., Jimenez-Bailón E., Guainazzi M., Schartel N., Rodríguez-Pascual P. M., Santos-Lleó M., 2005, A&A, 432, 15
- Pons et al. (2019) Pons E., McMahon R. G., Simcoe R. A., Banerji M., Hewett P. C., Reed S. L., 2019, MNRAS, 484, 5142
- Reed et al. (2017) Reed S. L., et al., 2017, MNRAS, 468, 4702
- Reed et al. (2019) Reed S. L., et al., 2019, MNRAS, 487, 1874
- Selsing et al. (2016) Selsing J., Fynbo J. P. U., Christensen L., Krogager J. K., 2016, A&A, 585, A87
- Shemmer et al. (2005) Shemmer O., Brandt W. N., Vignali C., Schneider D. P., Fan X., Richards G. T., Strauss M. A., 2005, ApJ, 630, 729
- Steffen et al. (2006) Steffen A. T., Strateva I., Brandt W. N., Alexand er D. M., Koekemoer A. M., Lehmer B. D., Schneider D. P., Vignali C., 2006, AJ, 131, 2826
- Strateva et al. (2005) Strateva I. V., Brandt W. N., Schneider D. P., Vanden Berk D. G., Vignali C., 2005, AJ, 130, 387
- Strüder et al. (2001) Strüder L., et al., 2001, A&A, 365, L18
- Tang et al. (2017) Tang J.-J., et al., 2017, MNRAS, 466, 4568
- Trakhtenbrot et al. (2017) Trakhtenbrot B., Volonteri M., Natarajan P., 2017, ApJ, 836, L1
- Turner et al. (2001) Turner M. J. L., et al., 2001, A&A, 365, L27
- Venemans et al. (2013) Venemans B. P., et al., 2013, ApJ, 779, 24
- Venemans et al. (2015) Venemans B. P., et al., 2015, ApJ, 801, L11
- Volonteri (2010) Volonteri M., 2010, Astronomy and Astrophysics Review, 18, 279
- Wang et al. (2004) Wang J. X., Malhotra S., Rhoads J. E., Norman C. A., 2004, ApJ, 612, L109
- Wang et al. (2017) Wang F., et al., 2017, ApJ, 839, 27
- Wang et al. (2018a) Wang F., et al., 2018a, arXiv e-prints, p. arXiv:1810.11926
- Wang et al. (2018b) Wang F., et al., 2018b, ApJ, 869, L9
- Willott et al. (2010a) Willott C. J., et al., 2010a, AJ, 139, 906
- Willott et al. (2010b) Willott C. J., et al., 2010b, AJ, 140, 546
- Yang et al. (2019) Yang J., et al., 2019, AJ, 157, 236