Stability of Nitrogen in Planetary Atmospheres in Contact with Liquid Water1112019. California Institute of Technology. Government sponsorship acknowledged.
Abstract
Molecular nitrogen is the most commonly assumed background gas that supports habitability on rocky planets. Despite its chemical inertness, nitrogen molecule is broken by lightning, hot volcanic vents, and bolide impacts, and can be converted into soluble nitrogen compounds and then sequestered in the ocean. The very stability of nitrogen, and that of nitrogen-based habitability, is thus called into question. Here we determine the lifetime of molecular nitrogen vis-à-vis aqueous sequestration, by developing a novel model that couples atmospheric photochemistry and oceanic chemistry. We find that \ceHNO, the dominant nitrogen compounds produced in anoxic atmospheres, is converted to \ceN2O in the ocean, rather than oxidized to nitrites or nitrates as previously assumed. This \ceN2O is then released back into the atmosphere and quickly converted to \ceN2. We also find that the deposition rate of \ceNO is severely limited by the kinetics of the aqueous-phase reaction that converts \ceNO to nitrites in the ocean. Putting these insights together, we conclude that the atmosphere must produce nitrogen species at least as oxidized as \ceNO2 and \ceHNO2 to enable aqueous sequestration. The lifetime of molecular nitrogen in anoxic atmospheres is determined to be billion years on temperate planets of both Sun-like and M dwarf stars. This result upholds the validity of molecular nitrogen as a universal background gas on rocky planets.
1 Introduction
Nitrogen is the bulk constituent of Earth’s atmosphere and a common constituent of the atmospheres of rocky planets in the Solar System. The universality of nitrogen has been extended to extrasolar rocky worlds, as molecular nitrogen (\ceN2) is generally assumed as the background gas in the atmosphere. The standard picture of habitable planets of stars (Kasting et al., 1993) posits that climate and geologic processes on rocky planets regulate the abundance of atmospheric \ceCO2 to maintain a surface temperature that is consistent with liquid water oceans – but an often overlooked ingredient of this picture is a constant, approximately 1 bar, \ceN2-dominated background atmosphere.
The climate-maintaining effect of \ceN2 primarily stems from its higher volatility than \ceCO2 or \ceH2O. As the partial pressure of \ceCO2 is controlled by the silicate weathering cycle (Walker et al., 1981), and that of \ceH2O is controlled by the surface temperature, the partial pressure of \ceN2 is not a direct function of any climatological parameters. Having a sizable \ceN2 atmosphere, therefore, alleviates the sensitivity of the planetary climate to subtle changes in forcings, and thus widens the semi-major axis ranges in which the planet can be habitable (Vladilo et al., 2013). No habitable climate can be found if the partial pressure of \ceN2 is less than 0.015 bar (Vladilo et al., 2013). The actual lower-limit may be even higher, as it is later found that \ceN2 as a non-condensable gas maintains the cold trap of the middle atmosphere and prevents water from loss to space (Wordsworth & Pierrehumbert, 2013). While \ceN2 is not a greenhouse gas, it causes a warming effect on climate via pressure broadening of \ceCO2 and \ceH2O absorption features (Goldblatt et al., 2009).
Due to its strong triple bond, \ceN2 is very close to being chemically inert in the atmosphere. The processes that can break \ceN2 are peculiar (Mancinelli & McKay, 1988): on today’s Earth it is primarily performed by microbes, and before the rise of nitrogen-fixation microbes it is done in energetic events including lightning (Yung & McElroy, 1979; Kasting & Walker, 1981; Navarro-González et al., 1998; Wong et al., 2017), bolide impact (McKay et al., 1988), and also hot volcanic vents (Mather et al., 2004). The immediate product of the “atmospheric nitrogen fixation” is \ceNO, and the \ceNO is then converted to \ceHNO3 in oxygen-rich atmospheres and to \ceHNO in oxygen-poor ones (Kasting & Walker, 1981; Wong et al., 2017). It has been suggested that the \ceHNO is then converted to \ceNO2- and \ceNO3- in the ocean (Mancinelli & McKay, 1988; Summers & Khare, 2007). As such, \ceNO produced in the atmosphere eventually becomes nitrites and nitrates. The entire 1-bar \ceN2-dominated atmosphere could be sequestered in the ocean as nitrites and nitrates – thus creating a potential problem for the stability of a nitrogen-dominated atmosphere in contact with liquid water oceans.
We are therefore motivated to determine the lifetime of \ceN2 – and thus that of \ceN2-based habitability – on a habitable exoplanet. We focus on anoxic planets without life, because microbes would be able to harvest the nitrites and nitrates in the oceans, reduce them to \ceN2 or \ceN2O, and restore the \ceN2 stability. Without life, the formation of nitrites and nitrates may well be mostly one-way and become long-term losses of nitrogen. In this paper we calculate the kinetic timescale of this process. We first study the fate of \ceHNO, the dominant nitrogen compound produced in anoxic atmospheres, when it is deposited into the ocean. We show that \ceHNO does not lead to nitrogen sequestration but rather formation of \ceN2O (Section 2). We then present a novel model that couples an atmosphere photochemistry model (Hu et al., 2012, 2013) and an ocean aqueous-chemistry model, so that the rates of transfer between the atmosphere and the ocean can be self-consistently calculated (Section 3). Using the coupled model we determine the lifetime of \ceN2 in anoxic atmospheres on temperate planets of Sun-like and M dwarf stars (Section 4). We discuss the implications of our findings in Section 5 and conclude in Section 6.
2 Aqueous Chemistry of \ceHNO on Planets
2.1 Aqueous-Phase Reactions and Kinetic Rates
HNO is the main atmospheric product of nitrogen compounds under anoxic conditions, and its fate in the ocean has not been clarified. The aqueous chemistry of \ceHNO, and its conjugate base \ceNO-, is peculiar because the ground state of \ceHNO is a singlet while that of \ceNO- is a triplet. This makes the deprotonation reaction to proceed as the forward direction of
| (R1) |
a slow, second-order reaction (Miranda, 2005). Under the pH conditions relevant to planets, most of the dissolved \ceHNO exists in the form of \ceHNO. We note that the excited state \ceHNO is a triplet and it quickly dissociates to \ceNO-. The transition to the excited state, however, is spin forbidden and has not been observed in experiments.
Dissolved \ceHNO can be removed by rapid dehydrative dimerization
| (R2) |
with its rate constant determined by the flash photolysis technique (Shafirovich & Lymar, 2002).
NO- is rapidly oxidized to nitrate when free oxygen is available
| (R3) |
or polymerized by NO via
| (R4) |
| (R5) |
| (R6) |
The polymerization can also start from \ceHNO
| (R7) |
| (R8) |
| (R9) |
Both polymerization reactions eventually form \ceN2O and nitrite, and their rate constants have been measured using pulse radiolysis and NO-rich fluids (Gratzel et al., 1970; Seddon et al., 1973). These polymerization pathways have been adopted as the pathway to convert \ceHNO to nitrite and nitrate in planetary oceans (Mancinelli & McKay, 1988; Summers & Khare, 2007; Wong et al., 2017).
In summary, the removal pathways of \ceHNO in the aqueous phase are dehydrative dimerization (Reaction R2), deprotonation (Reaction R1) followed by either oxidation (Reaction R3) or polymerization (Reactions R4-R6), and direct polymerization (Reactions R7-R9). Relevant rate constants are tabulated in Table 1.
| Reaction | Rate Constant |
|---|---|
| R1 forward | M-1 s-1 |
| R1 reverse | s-1 |
| R2 | M-1 s-1 |
| R3 | M-1 s-1 |
| R4 forward | M-1 s-1 |
| R4 reverse | s-1 |
| R5 | M-1 s-1 |
| R7 forward | M-1 s-1 |
| R7 reverse | s-1 |
| R8 | M-1 s-1 |
| R10 | M-1 s-1 |
| R11 | M-1 s-1 |
2.2 Reaction Rates under Planetary Conditions
Using the kinetic constants from experiments, we calculate the reaction rates of the \ceHNO removal pathways under typical planetary conditions.
After deprotonation, \ceNO- can be either oxidized (Reaction R3) or polymerized (Reactions R4-R6). We first compare the two sub-pathways. The rate of Reaction (R3) is
| (1) |
and the overall rate of Reactions (R4-R6) is
| (2) |
where the additional and in the subscript denote the rate constant of the forward and the reverse directions, respectively, and quantities in \ce[X] denote the concentration of the species \ceX in the aqueous phase, usually in the unit of M (i.e., mole per liter). The reaction rate has the unit of M s-1.
| Species | Typical | Upper Limit |
|---|---|---|
| \ce[NO] | M | M |
| \ce[O2] | M | M |
| \ce[HNO] | M | M |
For a typical anoxic condition, M and M (Table 2). These quantities are from the atmospheric photochemistry models under terrestrial lightning rates (Section 4) and have factored in the Henry’s law constants for respective gases. When the lightning rate is very high (i.e., the terrestrial rate), the upper limits are M and M. Note that these upper limits do not include the oxygen-rich scenarios that would be produced on planets of M dwarf stars (see Section 4).
Based on these concentrations, M s-1 and M s-1. Therefore, even under the anoxic conditions, , and the same is true for oxygen-rich conditions. The overall rate of the removal path starting with deprotonation (Reaction R1) is thus
| (3) |
The rate of dehydrative dimerization (Reaction R2) is
| (4) |
and the overall rate of direct polymerization (Reactions R7-R9) is
| (5) |
Under typical and limiting anoxic conditions, M (Section 4). For a neutral pH, we estimate M s-1, M s-1, and M s-1. Comparing the three rates, we have . is proportional to the concentration of \ceOH- in the ocean, and for to be greater than , the ocean must be highly alkaline with pH ¿ 11. Such a pH value is well higher than the pH of Earth’s ocean currently or in the Archean (Halevy & Bachan, 2017; Krissansen-Totton et al., 2018). Therefore, under anoxic conditions relevant for planetary atmospheres, dehydrative dimerization (Reaction R2) is the dominant removal pathway of \ceHNO deposited in the ocean.
Under oxygen-rich conditions, including in the oxygen-rich atmospheres produced by \ceCO2 photolysis on planets of M dwarf stars (see Section 4), little \ceHNO is produced in the atmosphere, and thus the dissolved concentration is very small. In this case, the rate of Reaction (R2) is very small, and deprotonation followed by oxidation (Reactions R1 and R3) dominates. However, that \ceHNO oxidation pathway is still not important to the overall removal flux of nitrogen, because little \ceHNO is produced in the atmosphere in the first place.
2.3 Consistency with Summers & Khare (2007)
The main finding of this section is that under planetary conditions the deposited \ceHNO in the ocean does not mainly become nitrite or nitrate. This finding might be perceived as contradictory to the experimental result of Summers & Khare (2007), where a gas mixture of \ceCO2 and \ceN2 with 1% \ceNO and 1% \ceCO in contact with liquid water was irradiated by ultraviolet light. Summers & Khare (2007) found that nitrate and nitrite to a lesser extent were formed and the \ceNO was depleted in approximately 1 hour. A smaller amount of \ceN2O was also produced. The interpretation was that \ceHNO was formed and dissolved, and Reactions (R4-R6) or Reactions (R7-R9) took place dominantly in the system.
The experimental result of Summers & Khare (2007) is consistent with our model of the kinetics of \ceHNO aqueous chemistry, as it showcases the outcome from a \ceNO-rich fluid. The experimental vessel was filled to a pressure of approximately 1 bar, which means that in equilibrium M. Therefore, the fluid was more \ceNO-rich than planetary oceans by orders of magnitude. Applying this concentration and re-evaluating all reaction rates in this section, we find that the rate of Reaction (R1) followed by Reactions (R4-R6) is M s-1, the rate of Reactions (R7-R9) is M s-1, and the rate of Reaction (R2) is M s-1. The concentration of \ceHNO in the system is unknown, but \ceNO has a lifetime of 1 hour and yet [\ceHNO] has a lifetime of at most s. As an upper limit, we assume that \ceHNO is the only intermediary in the removal of \ceNO and that all \ceHNO in the system (a 110-ml gas cell) is in the aqueous phase (15-ml water, Summers & Khare (2007)). We estimate M. Together, we find that even at this upper limit, the reaction rate of direct polymerization (Reactions R7-R9) is on the same order of magnitude as the reaction rate of dehydrative dimerization (Reaction R2). In reality, the concentration of \ceHNO should be smaller and polymerization becomes the dominant pathway, with the \ceN2O-producing dimerization the secondary pathway. This is what was seen in the experiment, and our kinetic model is thus consistent with the experiment.
2.4 The Fate of \ceHNO in Planetary Oceans
To summarize, the analysis in this section shows that under planetary conditions most of the deposited \ceHNO undergoes dehydrative dimerization, and becomes \ceN2O. The dehydrative dimerization is kinetically favored over oxidization to nitrate or polymerization to nitrite by at least four orders of magnitude under anoxic conditions, and in most cases, by ten orders of magnitude.
The insight we obtain here by evaluating the kinetic rates of \ceHNO removal pathways clarifies the fate of \ceHNO produced in anoxic atmospheres and deposited in the oceans. Models of the atmospheric evolution for Earth and planets have assumed that the \ceHNO would quickly become nitrite and nitrate in the ocean (Mancinelli & McKay, 1988; Wong et al., 2017; Laneuville et al., 2018; Ranjan et al., 2019). The experimental basis for this early assumption was the pulse radiolysis experiments for Reactions R4-R6 and R7-R9 (Gratzel et al., 1970; Seddon et al., 1973) and the experiment of Summers & Khare (2007). These experiments used \ceNO-rich fluids, and thus to apply their results one must evaluate the implied kinetic rates for reasonable planetary conditions and compare with other potential reaction pathways. Here we show that for anoxic atmospheres, dehydrative dimerization is the dominant pathway, and for oxygen-rich atmospheres, deprotonation followed by oxidation is the dominant pathway. These results are also testable by experiments in the laboratory.
It is therefore reasonable to consider Reaction (R2) the sole reaction of \ceHNO in the aqueous phase. The produced \ceN2O, because of its low solubility, is released to the atmosphere and eventually photolyzed to become \ceN2. The formation of \ceHNO in the atmosphere is thus not an effective path toward nitrite or nitrate, and does not lead to sequestration of molecular nitrogen in the aqueous phase.
3 Coupled Atmosphere-Ocean Model
We develop an ocean chemistry module and couple it with the atmospheric photochemistry model of Hu et al. (2012, 2013) to determine the lifetime of \ceN2 in anoxic atmospheres in contact with liquid-water oceans. The photochemistry model has been validated by computing the atmospheric compositions of present-day Earth and Mars, as the outputs agreed with the observations of major trace gases in Earth’s and Mars’ atmospheres (Hu, 2013). The model includes a comprehensive reaction network for O, H, C, N, and S species including sulfur and sulfuric acid aerosols, and its applications to simulating anoxic atmospheres and maintaining the redox flux balance of the atmosphere and the ocean have been well-documented (James & Hu, 2018) and compare well with other photochemical models (Gao et al., 2015; Harman et al., 2018).
For this work, we choose to simulate a 1-bar atmosphere of 95% \ceN2 and 5% \ceCO2, as this kind of anoxic atmosphere is akin to the \ceO2-poor and \ceCO2-rich environment of the Archean Earth, and is often adopted as the archetype for anoxic exoplanet atmospheres (e.g., Tian et al., 2014; Domagal-Goldman et al., 2014; Harman et al., 2015). We assume a surface temperature of 288 K and a stratospheric temperature of 200 K and include volcanic outgassing of \ceCO, \ceH2, \ceSO2, and \ceH2S in the same way as in James & Hu (2018). We use the entire reaction network of the atmospheric photochemistry model of Hu et al. (2012, 2013), except the organic compounds that have more than two carbon atoms and their reactions. The outgassing rate adopted here is not high enough to produce a \ceH2SO4 aerosol layer in the atmosphere.
We include both a Sun-like star and an M dwarf star as the parent star. For the M dwarf star, we use GJ 876 as the representing case and apply its measured spectrum in the ultraviolet (France et al., 2016) in the photochemistry model.
To simulate the effect of atmospheric nitrogen fixation, we start from the terrestrial production rate of \ceNO by lightning, cm-2 s-1 (Schumann & Huntrieser, 2007). Changing the main oxygen donor from \ceO2 to \ceCO2 and \ceH2O would lead to approximately one-order-of-magnitude less \ceNO, but the lightning rate also depends on how convective the atmosphere is (Wong et al., 2017; Harman et al., 2018). Besides, bolide impacts and hot volcanic vents may also contribute substantially to the source of \ceNO (McKay et al., 1988; Mather et al., 2004). We therefore explore the effect of changing \ceNO flux by three orders of magnitude from the terrestrial lightning value to cover these varied scenarios. Also, assuming the oxygen comes from \ceCO2, each molecule of \ceNO produced is accompanied by another molecule of \ceCO. We include this conjugate \ceCO source in the model, and in this way, no net redox change is introduced to the atmosphere.
3.1 Ocean Chemistry and Deposition Velocities of Nitrogen Species
Chemical reactions in the ocean affect the atmospheric photochemistry model by adjusting the rate of gas exchange between the atmosphere and the ocean. Conceptually, the transfer flux from the atmosphere to the ocean can be expressed as where is the maximum deposition velocity and is the effective deposition velocity, is the number density at the bottom of the atmosphere, is the concentration at the surface ocean, is Henry’s law constant, and is a unit conversion factor depending on the definition of Henry’s law constant (Kharecha et al., 2005). The effective deposition velocity depends on how fast the ocean can “process” the deposited gas: if the ocean removes the gas quickly, then , and ; whereas if the ocean cannot remove the gas, Henry’s law equilibrium could be established, and in this case, and . can be approximated by the speed for the gas to diffuse through laminar layers at the interface between the atmosphere and the ocean, aka. the two-film model (Broecker & Peng, 1982) and is sensitive to the solubility of the gas, the wind speed, and the temperature (Domagal-Goldman et al., 2014; Harman et al., 2015). For highly soluble species cm s-1 and for weakly soluble ones, cm s-1.
| Species | Deposition velocity |
|---|---|
| cm s-1 | |
| \ceN2O | 0 |
| \ceNO | calculated iteratively |
| \ceNO2 | calculated iteratively |
| \ceNO3 | 1 |
| \ceN2O5 | 1 |
| \ceHNO | calculated iteratively |
| \ceHNO2 | 1 |
| \ceHNO3 | 1 |
| \ceHNO4 | 1 |
Table 3 lists the effective deposition velocities for nitrogen species. We do not include any process that removes \ceN2O in the ocean, and thus its deposition velocity is zero. For \ceHNO2 and \ceHNO3, the ocean’s capacity to store them is vast, and thus we assume that they are permanently lost to the ocean once deposited, and their deposition velocities approach . \ceNO3, \ceN2O5, and \ceHNO4 quickly react or decomposes to \ceNO3-, and thus they are also considered permanently lost once deposited. Over geologic timescales the dissolved \ceNO2- and \ceNO3- can be reduced to \ceNH4+, or to \ceNO, \ceN2O, and \ceN2 and released back to the atmosphere, by cycling through hydrothermal vents (Wong et al., 2017; Laneuville et al., 2018), and ultraviolet photolysis and reduction by \ceFe^2+ (e.g., Stanton et al., 2018; Ranjan et al., 2019). This potential source of gaseous \ceNO and \ceN2O is not included in the current model since we explore a wide range of NO flux as the boundary condition, and the \ceN2O is readily photodissociated in the atmosphere.
For \ceNO, \ceNO2, and \ceHNO, we solve for their concentrations in the ocean, using the rates of Reaction (R2) and the following reactions in the aqueous phase:
| (R10) |
| (R11) |
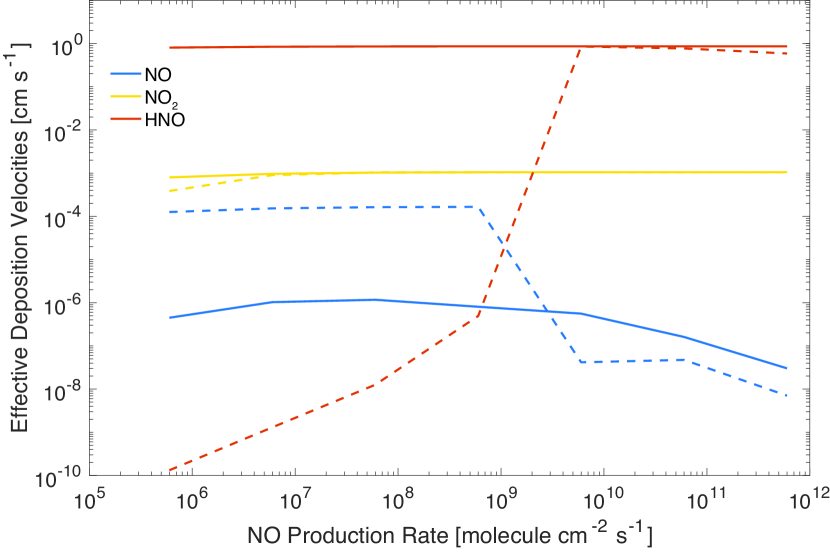
The rate constants of Reactions (R10) and (R11) are from Lee (1984) and tabulated in Table 1. For each mixing ratio (or partial pressure) of \ceNO, \ceNO2, and \ceHNO at the bottom of the atmosphere, their steady-state concentrations in the ocean can be calculated, assuming homogeneous distribution in the ocean. The results are then expressed in the effective deposition velocities and are shown in Figure 1.
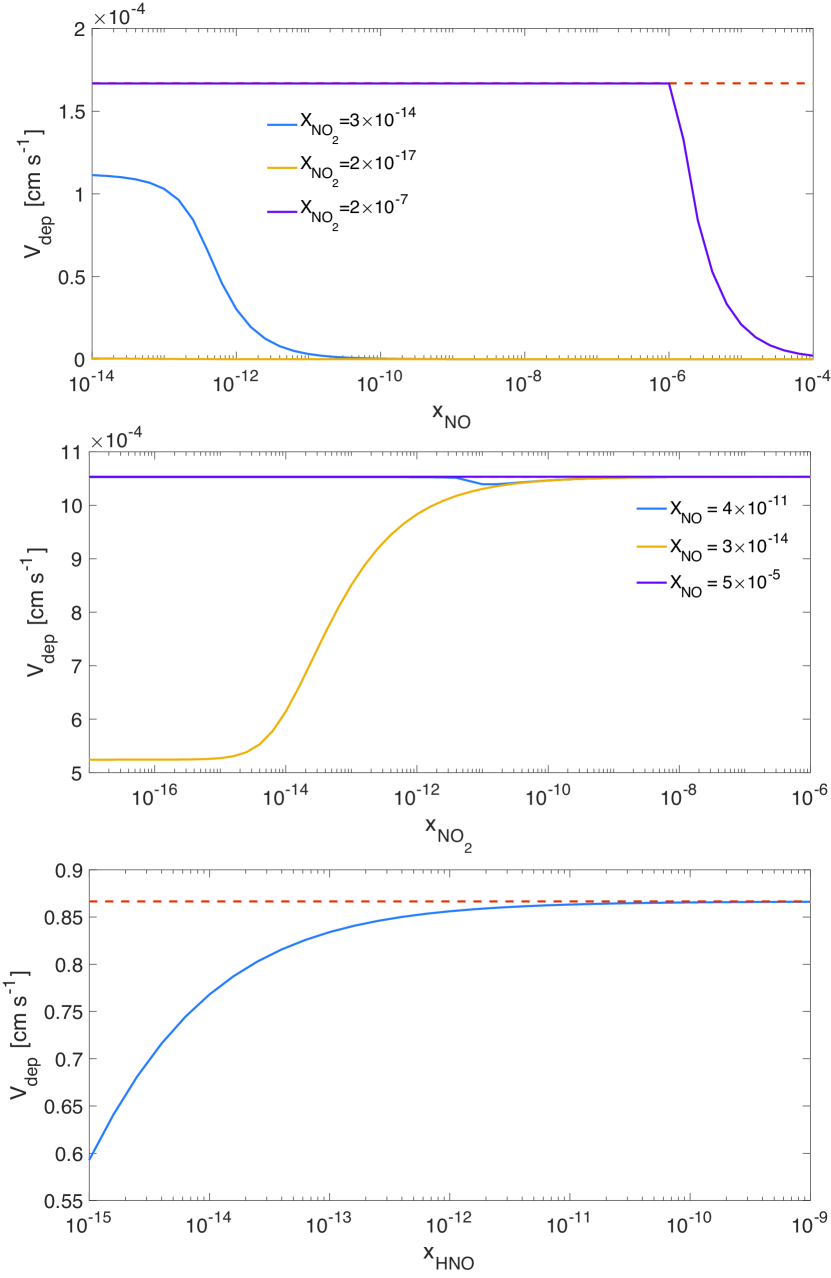
Several important observations can be drawn from Figure 1. (1) \ceNO does not substantially transfer to the ocean unless the mixing ratio of \ceNO2 is approaching 1 ppm. This is because the removal of \ceNO by Reaction (R10) requires another \ceNO2. The conditions for such a large abundance of \ceNO2 at the surface is rarely achieved. The effective deposition velocity of \ceNO can be large when the mixing ratio of \ceNO is very small. This however does not imply a substantial transfer flux because the flux is the product of the deposition velocity and the mixing ratio. The deposition flux of \ceNO is thus severely limited by the kinetic rate of Reaction (R10). (2) \ceNO2 practically deposits at . Unless the lightning rate is very small, the partial pressure of \ceNO is always high enough to effectively remove \ceNO2 via Reaction (R10). Even when the mixing ratio of \ceNO is indeed very small (see Figure 1, middle panel, yellow line), Reaction (R11) can efficiently remove the dissolved \ceNO2 and make the deposition velocity to approach for a mixing ratio of \ceNO2 greater than . Since the deposition flux would always be small at the low end of the lightning rate, Figure 1 indicates that in practice the deposition of \ceNO2 is always efficient. (3) The deposition of \ceHNO is generally quite efficient, with close to . But as shown in Section 2, this deposition leads to a return flux of \ceN2O to the atmosphere.
Because the effective deposition velocities depend on the partial pressure at the bottom of the atmosphere, we need to solve the coupled atmosphere-ocean chemistry model iteratively. For each scenario, we typically start with . Once a steady-state solution is found for the atmospheric chemistry, we use the mixing ratio of \ceNO, \ceNO2, and \ceHNO at the bottom of the atmosphere to calculate their effective deposition velocities. We also add the corresponding return flux of \ceN2O as part of the revised boundary conditions. We then relaunch the atmospheric chemistry calculation and find a new steady-state solution. This procedure is repeated until the steady-state mixing ratios of \ceNO, \ceNO2, and \ceHNO no longer change. Typically only a handful of iterations are required. As such, we can found self-consistent solutions that satisfy both the atmosphere and ocean chemistry.
To summarize, the analysis presented so far indicates that the deposition of \ceNO or \ceHNO cannot be a net sink for molecular nitrogen in the atmosphere, because \ceNO does not deposit efficiently and \ceHNO deposition leads to a return flux of \ceN2O. Therefore, to sequester nitrogen in the ocean, the atmosphere must oxidize nitrogen compounds to at least as oxidized as \ceNO2 and \ceHNO2. With this insight, we will show in Section 4 that this required oxidization is quite slow in anoxic atmospheres and molecular nitrogen is therefore kinetically stable.
4 Results
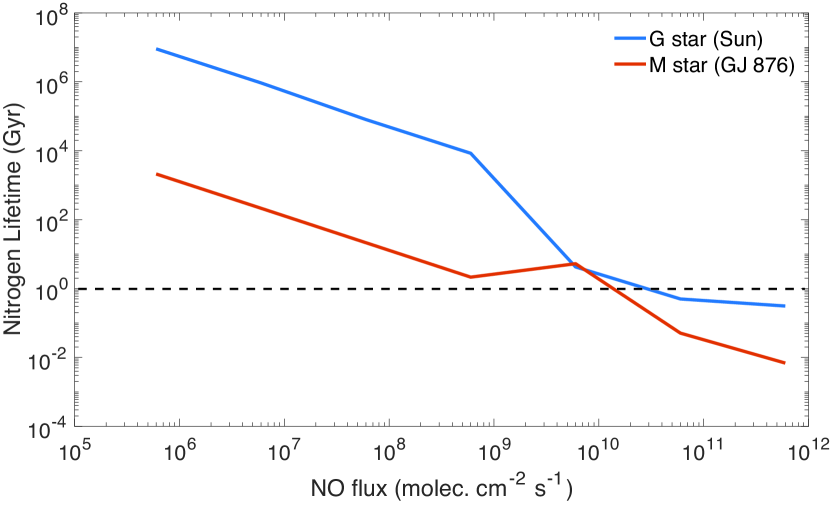
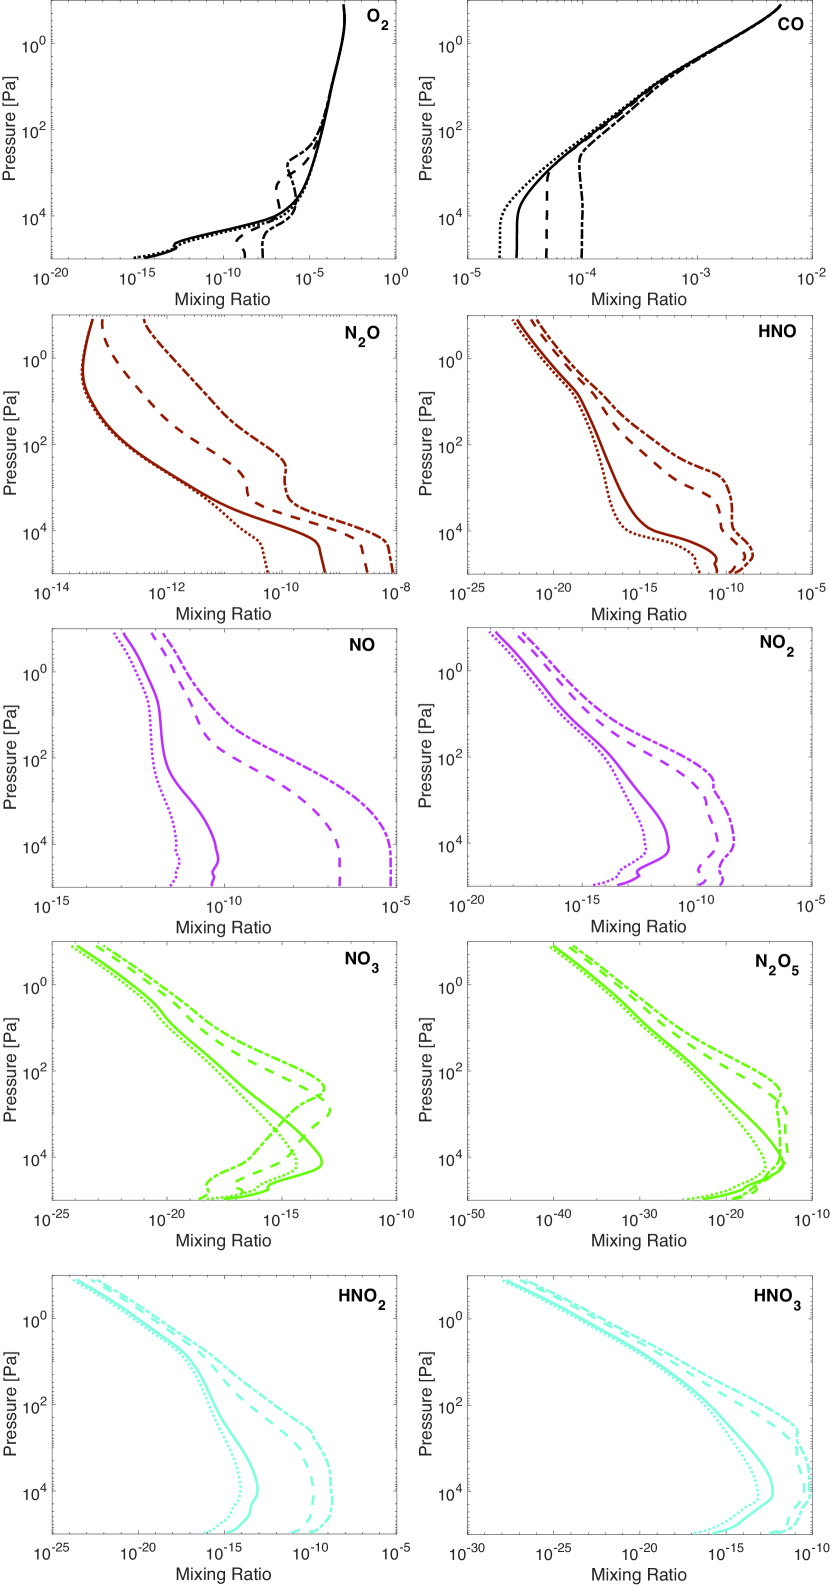
The lifetime of molecular nitrogen in planetary atmospheres in contact with a liquid-water ocean for varied \ceNO fluxes from lightning and other energetic processes is shown in Figure 2. The lifetime is calculated from the deposition fluxes of \ceNO, \ceNO2, \ceNO3, \ceN2O5, \ceHNO2, \ceHNO3, and \ceHNO4, from the converged atmosphere-ocean chemistry solutions. The atmospheric abundances of these species are shown in Figures 3 and 4. The deposition flux of \ceHNO is not included in the calculation of the lifetime, as it is returned to the atmosphere in the form of \ceN2O (Section 2). With the effective deposition velocities calculated self-consistently from the ocean-chemistry models (Figure 5), the deposition fluxes of weakly soluble species (\ceNO and \ceNO2) represent how fast the ocean can process them.
The lifetime of molecular nitrogen is well longer than 1 billion years unless the NO flux is times larger than the present-day Earth’s lightning production rate. Interestingly, we see that the lifetime of nitrogen on planets around Sun-like stars is longer than that on planets around M dwarf stars. For instance, the lifetime under the lightning rate of present-day Earth is billion years on an M dwarf’s habitable planet, and that on a Sun-like star’s habitable planet is 4-order-of-magnitude longer.
The atmospheric nitrogen chemistry is substantially modified with the inclusion of the oceanic feedback, i.e, the inability to deposit \ceNO and the return flux of \ceN2O. For a Sun-like star as the parent star, the atmosphere is always poor in \ceO2 (Figure 3), and thus oxidizing \ceNO is difficult. For a higher \ceNO production rate, the steady-state mixing ratios of \ceNO, \ceNO2, and \ceHNO increase, and so is the return flux of \ceN2O. The steady-state mixing ratio of \ceN2O thus also increases. The upper limit of the \ceN2O mixing ratio obtained from our model is , still much smaller than that in present-day Earth’s atmosphere (). The dominant form of nitrogen deposition is \ceHNO3 when the \ceNO flux is molecule cm-2 s-1, and it becomes \ceHNO2 when the \ceNO flux is molecule cm-2 s-1. The surface abundance and thus the deposition rate of \ceHNO is larger than \ceHNO2 and \ceHNO3 – it is however not counted as a net loss of atmospheric nitrogen. The steady-state mixing ratio of \ceNO can accumulate to a quite high level, and this is made possible by its very small effective deposition velocity (Figure 5). In other words, the ocean cannot process the \ceNO so quickly. For the same reason, even a large surface abundance \ceNO does not imply a major deposition pathway.
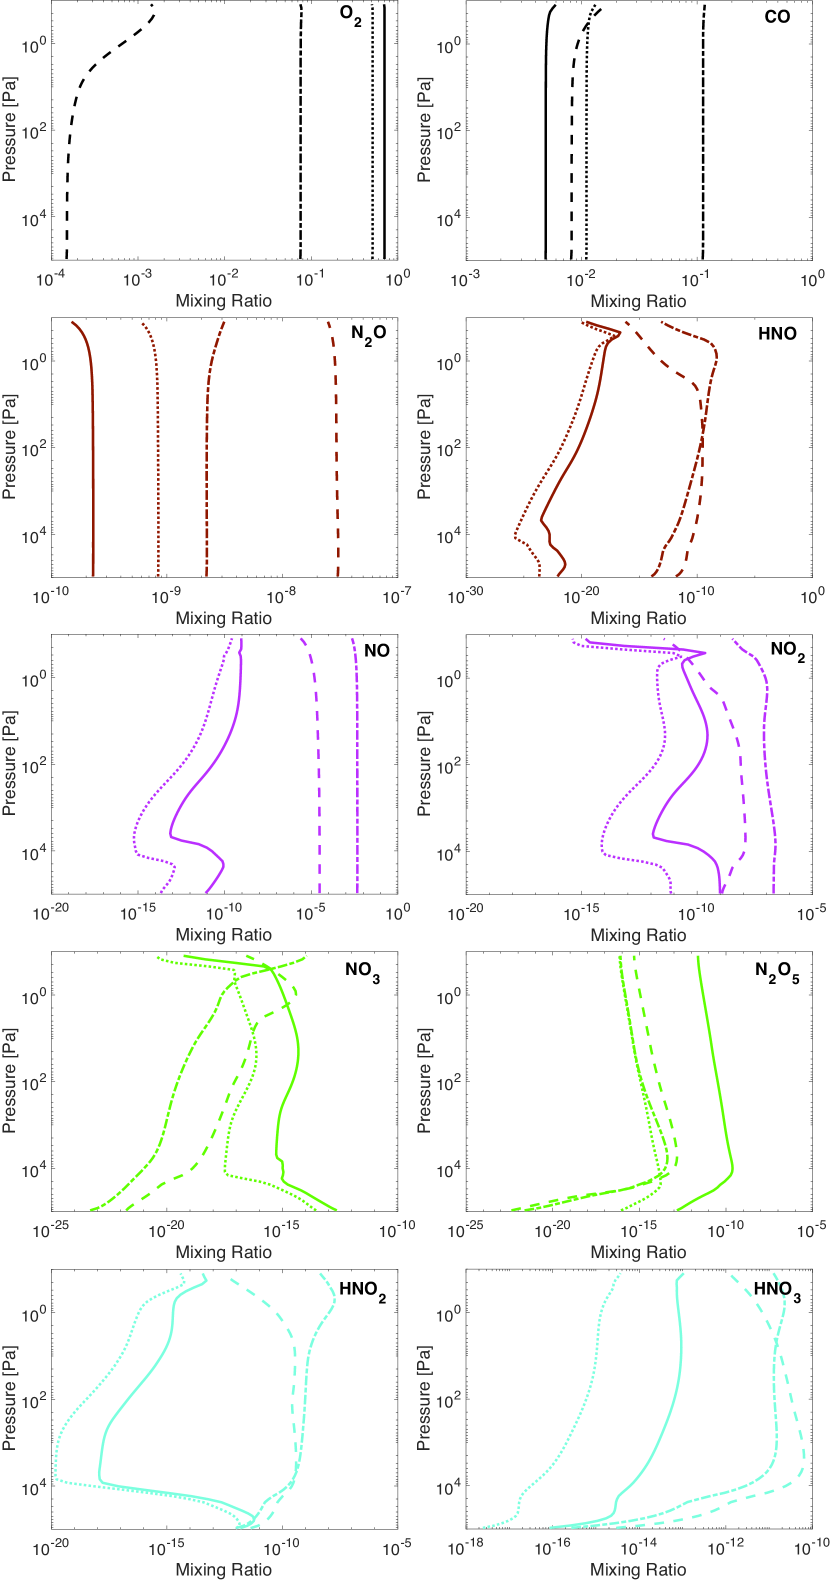
The situation is more complex when the parent star is an M dwarf. Because M dwarfs emit strongly in the far-ultraviolet bandpass but weakly in the near-ultraviolet bandpass, their rocky planets in the habitable zone tend to accumulate \ceO2 from photolysis of \ceCO2 (Tian et al., 2014; Domagal-Goldman et al., 2014; Harman et al., 2015). The \ceNO-\ceNO2 catalytic cycle initiated by lightning cannot remove the photochemical \ceO2 on an M dwarf’s planet either (Hu et al. 2019, ApJ, submitted). Here we find the same phenomenon of abiotic \ceO2 accumulation, and the exact amount of \ceO2 has to do with the assumed \ceNO flux from lightning (Harman et al., 2018, and Hu et al. 2019, ApJ, submitted). The accumulation of abiotic \ceO2 is not the focus of this paper, but the availability of free oxygen does impact the nitrogen chemistry and greatly reduces the lifetime of \ceN2. With the free oxygen, the atmosphere has up to 10 ppm of \ceO3 in the stratosphere and is thus able to efficiently oxidize \ceNO via
| (R12) |
Compared to the Sun-like star cases, the M star cases have higher abundances of \ceNO2, \ceNO3, and \ceHNO2 at the steady state. The higher abundance of \ceNO2 also helps deposition of \ceNO via Reaction (R10). \ceHNO is practically not produced in the atmosphere unless the NO flux from lightning is molecule cm-2 s-1. When it is produced, the corresponding return flux of \ceN2O can drive the atmospheric \ceN2O to up to . To compare, the terrestrial (biological) emission rate of \ceN2O would lead to a much higher abundance of (Segura et al., 2005). The response of \ceHNO and \ceN2O to an increasing lightning rate is not monotonic, and this reflects the competing effects of free oxygen, and a low level of near-ultraviolet irradiation and low abundances of \ceOH and \ceHO2 in the atmosphere.
5 Discussion
5.1 Lifetime of Nitrogen on Archean Earth
We can apply the results to Archean Earth as the modeled atmosphere irradiated by a Sun-like star has an oxidation state similar to Earth before the rise of oxygen. Except for bolide impact that concentrated in the earliest time (McKay et al., 1988), the production rate of \ceNO from lightning and hot volcanic vents would be in the range of molecule cm-2 s-1 (Mather et al., 2004; Wong et al., 2017; Harman et al., 2018). With this input, we find that the total flux of nitrogen deposition would in the range of molecule cm-2 s-1. In other words, only of the reactive nitrogen produced in the atmosphere is permanently lost to the ocean. The lifetime of nitrogen is billion years or larger, implying that the \ceN2 atmosphere is stable without any help from nitrate-consuming microbes.
Of the deposition flux of nitrogen species, approximately 80% is \ceHNO3 and 20% is \ceHNO2. The flux of nitrate deposition we calculate is consistent in the ballpark with Wong et al. (2017) but we clarify the oceanic feedback to the gas deposition and we remove \ceHNO from effective deposition. Assuming that the residence time of this nitrite and nitrate is determined by the ocean cycling through high-temperature hydrothermal vents ( billion years, Wong et al., 2017), and an average ocean depth of km, we estimate the concentration of nitrate to be 0.9 – 9 M, and that of nitrite to be 0.2 – 2 M in the Archean ocean. If circulation through all hydrothermal vents causes the removal of nitrite and nitrate (Laneuville et al., 2018), the residence time reduces to million years and the nitrate and nitrite concentrations further reduce by two orders of magnitude.
Cycling through hydrothermal vents is probably not the only way to remove nitrite and nitrate in the ocean. Ranjan et al. (2019) compares the kinetic loss rate of oceanic nitrite and nitrate due to hydrothermal vents, ultraviolet photolysis (Zafiriou, 1974; Carpenter & Nightingale, 2015), and reactions with reduced iron (Jones et al., 2015; Buchwald et al., 2016; Grabb et al., 2017; Stanton et al., 2018). The loss rates due to photolysis and reactions with reduced iron can be greater than that due to hydrothermal vents by orders of magnitude. This implies that the concentrations of nitrite and nitrate we estimate in this section is an upper limit and the actual concentrations can be much lower.
5.2 Abiotic \ceN2O in Anoxic Atmospheres
In this work we show that \ceHNO produced in the atmosphere would become \ceN2O when an aqueous environment exists. One might ask if this source of \ceN2O constitutes a “false positive” for using \ceN2O as a biosignature gas (e.g., Des Marais et al., 2002). With the coupled atmosphere-ocean model, we find that the abundance of \ceN2O produced by \ceHNO dehydrative dimerization is always smaller than the abundance of \ceN2O that would be produced from a source strength of current Earth’s biosphere, by more than one order of magnitude, but it can be comparable to a lower biological \ceN2O production in Earth’s anoxic past (e.g. Rugheimer & Kaltenegger, 2018). This is true for either a Sun-like star or an M star as the parent star. The difference in the \ceN2O mixing ratio by more than one order of magnitude causes an appreciable difference in the \ceN2O spectral features in the infrared (e.g. Rugheimer & Kaltenegger, 2018). The use of \ceN2O as a biosignature gas thus requires the detection of its source strength at the level of current Earth’s biosphere.
6 Conclusion
We present a coupled atmosphere-ocean chemistry model to study the lifetime of molecular nitrogen (\ceN2) in planetary atmospheres in contact with a liquid-water ocean. The question of lifetime exists because nitrogen is the background gas for canonical planetary habitability scenarios and because nitrogen could be sequestered in the ocean when it is chemically converted to soluble compounds like nitrites and nitrates.
We clarify several important features of nitrogen’s aqueous-phase chemistry for planetary applications. First, we find that dehydrative dimerization is the main loss pathway of \ceHNO, the dominant nitrogen species produced in anoxic atmospheres. This reaction produces \ceN2O, which is then released to the atmosphere and photodissociated to become \ceN2. This finding corrects the long-standing assumption that the \ceHNO would eventually become nitrate in the ocean. Second, we find that the deposition flux of \ceNO is always very small under anoxic conditions. These findings collectively indicate that sequestering nitrogen in the ocean requires atmospheric oxidation to at least as oxidized as \ceNO2 and \ceHNO2.
We determine that the lifetime of molecular nitrogen is well longer than 1 billion years unless the NO flux is times larger than the present-day Earth’s lightning production rate. As such, \ceN2 atmospheres on Archean Earth and habitable exoplanets of both Sun-like and M dwarf stars are kinetically stable against aqueous-phase sequestration. This result affirms the nitrogen-based habitability on rocky planets.
References
- Broecker & Peng (1982) Broecker, W., & Peng, T. 1982, Lamont-Doherty Geological Observatory, Columbia University, Palisades, New York, 10964, 690
- Buchwald et al. (2016) Buchwald, C., Grabb, K., Hansel, C. M., & Wankel, S. D. 2016, Geochimica et Cosmochimica Acta, 186, 1
- Carpenter & Nightingale (2015) Carpenter, L. J., & Nightingale, P. D. 2015, Chemical reviews, 115, 4015
- Des Marais et al. (2002) Des Marais, D., O Harwit, M., Jucks, K., et al. 2002, Astrobiology, 2, 153
- Domagal-Goldman et al. (2014) Domagal-Goldman, S. D., Segura, A., Claire, M. W., Robinson, T. D., & Meadows, V. S. 2014, ApJ, 792, 90
- France et al. (2016) France, K., Loyd, R. O. P., Youngblood, A., et al. 2016, ApJ, 820, 89
- Gao et al. (2015) Gao, P., Hu, R., Robinson, T. D., Li, C., & Yung, Y. L. 2015, ApJ, 806, 249
- Goldblatt et al. (2009) Goldblatt, C., Claire, M. W., Lenton, T. M., et al. 2009, Nature Geoscience, 2, 891
- Grabb et al. (2017) Grabb, K. C., Buchwald, C., Hansel, C. M., & Wankel, S. D. 2017, Geochimica et Cosmochimica Acta, 196, 388
- Gratzel et al. (1970) Gratzel, M., Taniguchi, S., & Henglein, A. 1970, Ber Bunsenges Phys Chem, 74, 1003
- Halevy & Bachan (2017) Halevy, I., & Bachan, A. 2017, Science, 355, 1069
- Harman et al. (2018) Harman, C., Felton, R., Hu, R., et al. 2018, ApJ, 866, 56
- Harman et al. (2015) Harman, C. E., Schwieterman, E. W., Schottelkotte, J. C., & Kasting, J. F. 2015, ApJ, 812, 137
- Hu (2013) Hu, R. 2013, PhD thesis, Massachusetts Institute of Technology
- Hu et al. (2012) Hu, R., Seager, S., & Bains, W. 2012, ApJ, 761, 166
- Hu et al. (2013) Hu, R., Seager, S., & Bains, W. 2013, ApJ, 769, 6
- James & Hu (2018) James, T., & Hu, R. 2018, ApJ, 867, 17
- Jones et al. (2015) Jones, L. C., Peters, B., Lezama Pacheco, J. S., Casciotti, K. L., & Fendorf, S. 2015, Environmental science & technology, 49, 3444
- Kasting & Walker (1981) Kasting, J. F., & Walker, J. C. 1981, Journal of Geophysical Research: Oceans, 86, 1147
- Kasting et al. (1993) Kasting, J. F., Whitmire, D. P., & Reynolds, R. T. 1993, Icarus, 101, 108
- Kharecha et al. (2005) Kharecha, P., Kasting, J., & Siefert, J. 2005, Geobiology, 3, 53
- Krissansen-Totton et al. (2018) Krissansen-Totton, J., Arney, G. N., & Catling, D. C. 2018, Proceedings of the National Academy of Sciences, 115, 4105
- Laneuville et al. (2018) Laneuville, M., Kameya, M., & Cleaves, H. J. 2018, Astrobiology, 18, 897
- Lee (1984) Lee, Y.-N. 1984, Atmospheric aqueous-phase reactions of nitrogen species, Tech. rep., Brookhaven National Lab., Upton, NY (USA)
- Mancinelli & McKay (1988) Mancinelli, R. L., & McKay, C. P. 1988, Origins of Life and Evolution of the Biosphere, 18, 311
- Mather et al. (2004) Mather, T. A., Pyle, D. M., & Allen, A. G. 2004, Geology, 32, 905
- McKay et al. (1988) McKay, C. P., Scattergood, T. W., Pollack, J. B., Borucki, W. J., & Van Ghyseghem, H. T. 1988, Nature, 332, 520
- Miranda (2005) Miranda, K. M. 2005, Coordination Chemistry Reviews, 249, 433
- Navarro-González et al. (1998) Navarro-González, R., Molina, M. J., & Molina, L. T. 1998, Geophysical Research Letters, 25, 3123
- Ranjan et al. (2019) Ranjan, S., Todd, Z. R., Rimmer, P. B., Sasselov, D. D., & Babbin, A. R. 2019, Geochemistry, Geophysics, Geosystems, 20, 2021
- Rugheimer & Kaltenegger (2018) Rugheimer, S., & Kaltenegger, L. 2018, The Astrophysical Journal, 854, 19
- Schumann & Huntrieser (2007) Schumann, U., & Huntrieser, H. 2007, Atmospheric Chemistry and Physics, 7, 3823
- Seddon et al. (1973) Seddon, W., Fletcher, J., & Sopchyshyn, F. 1973, Canadian Journal of Chemistry, 51, 1123
- Segura et al. (2005) Segura, A., Kasting, J. F., Meadows, V., et al. 2005, Astrobiology, 5, 706
- Shafirovich & Lymar (2002) Shafirovich, V., & Lymar, S. V. 2002, Proceedings of the National Academy of Sciences, 99, 7340
- Stanton et al. (2018) Stanton, C. L., Reinhard, C. T., Kasting, J. F., et al. 2018, Geobiology, 16, 597
- Summers & Khare (2007) Summers, D. P., & Khare, B. 2007, Astrobiology, 7, 333
- Tian et al. (2014) Tian, F., France, K., Linsky, J. L., Mauas, P. J., & Vieytes, M. C. 2014, Earth and Planetary Science Letters, 385, 22
- Vladilo et al. (2013) Vladilo, G., Murante, G., Silva, L., et al. 2013, The Astrophysical Journal, 767, 65
- Walker et al. (1981) Walker, J. C., Hays, P., & Kasting, J. F. 1981, Journal of Geophysical Research: Oceans, 86, 9776
- Wong et al. (2017) Wong, M. L., Charnay, B. D., Gao, P., Yung, Y. L., & Russell, M. J. 2017, Astrobiology, 17, 975
- Wordsworth & Pierrehumbert (2013) Wordsworth, R. D., & Pierrehumbert, R. T. 2013, The Astrophysical Journal, 778, 154
- Yung & McElroy (1979) Yung, Y., & McElroy, M. 1979, Science, 203, 1002
- Zafiriou (1974) Zafiriou, O. C. 1974, Journal of Geophysical Research, 79, 4491