Lattice vibrations of - and -coronene from Raman and theory
Abstract
We combine polarization-resolved low frequency Raman microscopy and dispersion-corrected density-functional calculations (DFT-D3) to study polymorph-dependent lattice vibrations in coronene, a model molecular system for nanographenes and disc-like organic semiconductors that exhibits two crystalline structures with distinct electronic and optical properties. Changes in low energy Raman-active lattice phonons are followed across the - to -phase transition at 150 K. Raman frequencies calculated using DFT-D3 agree to within 4 cm-1, and on the basis of polarisation dependence of peak positions and intensities we achieve a clear mode assignment. Studies of the associated atomic motions show how the pure librational and rotational modes of -coronene change into mixed roto-librations in the -phase, explaining the remarkable differences in Raman spectra of the two phases.
pacs:
000000I Introduction
The lattice dynamics of molecular solids impact significantly upon their electronic and optical properties Schwoerer and Wolf (2007). In technological applications, phonons influence charge transport in molecular semiconductors, ultimately limiting maximum carrier mobilities in organic electronic devices Harrelson et al. (2019); Fratini et al. (2017); Sosorev et al. (2018); Ando et al. (2019), and the performance of materials for thermoelectric applications Cigarini et al. (2017). More fundamentally, the vibrational spectrum contributes to the relative thermodynamic stability of crystalline structures Della Valle et al. (1996), and must be considered when attempting to explain polymorphism, the existence of different crystal structures for the same molecular compound Brillante et al. (2008). Here we report a combined experiment and theory study of lattice vibrations in the two different polymorphs of the molecular crystal coronene.
Molecular crystals are held together by dispersive forces (van der Waals), which dominate intermolecular interactions, but are far weaker than the strong intramolecular covalent bonds. This distinction is usually reflected in the vibrational modes, allowing a classification into intermolecular phonons and intramolecular vibrational modes Califano et al. (1981). Although the distinction is not always well defined, as modes with mixed character can occur, phonons are typically observed at frequencies 200 cm-1, while the spectrum at high frequencies is dominated by intramolecular modes. The intermolecular van der Waals potential determines the phonon frequencies, and thus it is these low frequency modes that are most sensitive to variations in crystal structure. These modes can be readily observed with low frequency Raman spectroscopy, which has proven to be effective for studies of polymorphism in several condensed polyaromatic systems Brillante et al. (2008). Raman spectroscopy has also been used to estimate electron-phonon coupling in organic semiconductors Sosorev et al. (2018); Anderson et al. (2017), highlighting the importance of Raman for understanding charge transport in this fascinating class of materials Girlando et al. (2010). Beyond molecular crystals, another class of van der Waals solids, the transition metal chalcogenides, also exhibit a clear distinction between modes involving covalent and non-covalent bonds, and Raman spectroscopy of interlayer phonons has proven useful in studying polytypism and film thickness in few-layer systems Lee et al. (2016); Froehlicher et al. (2015); Duong et al. (2017).
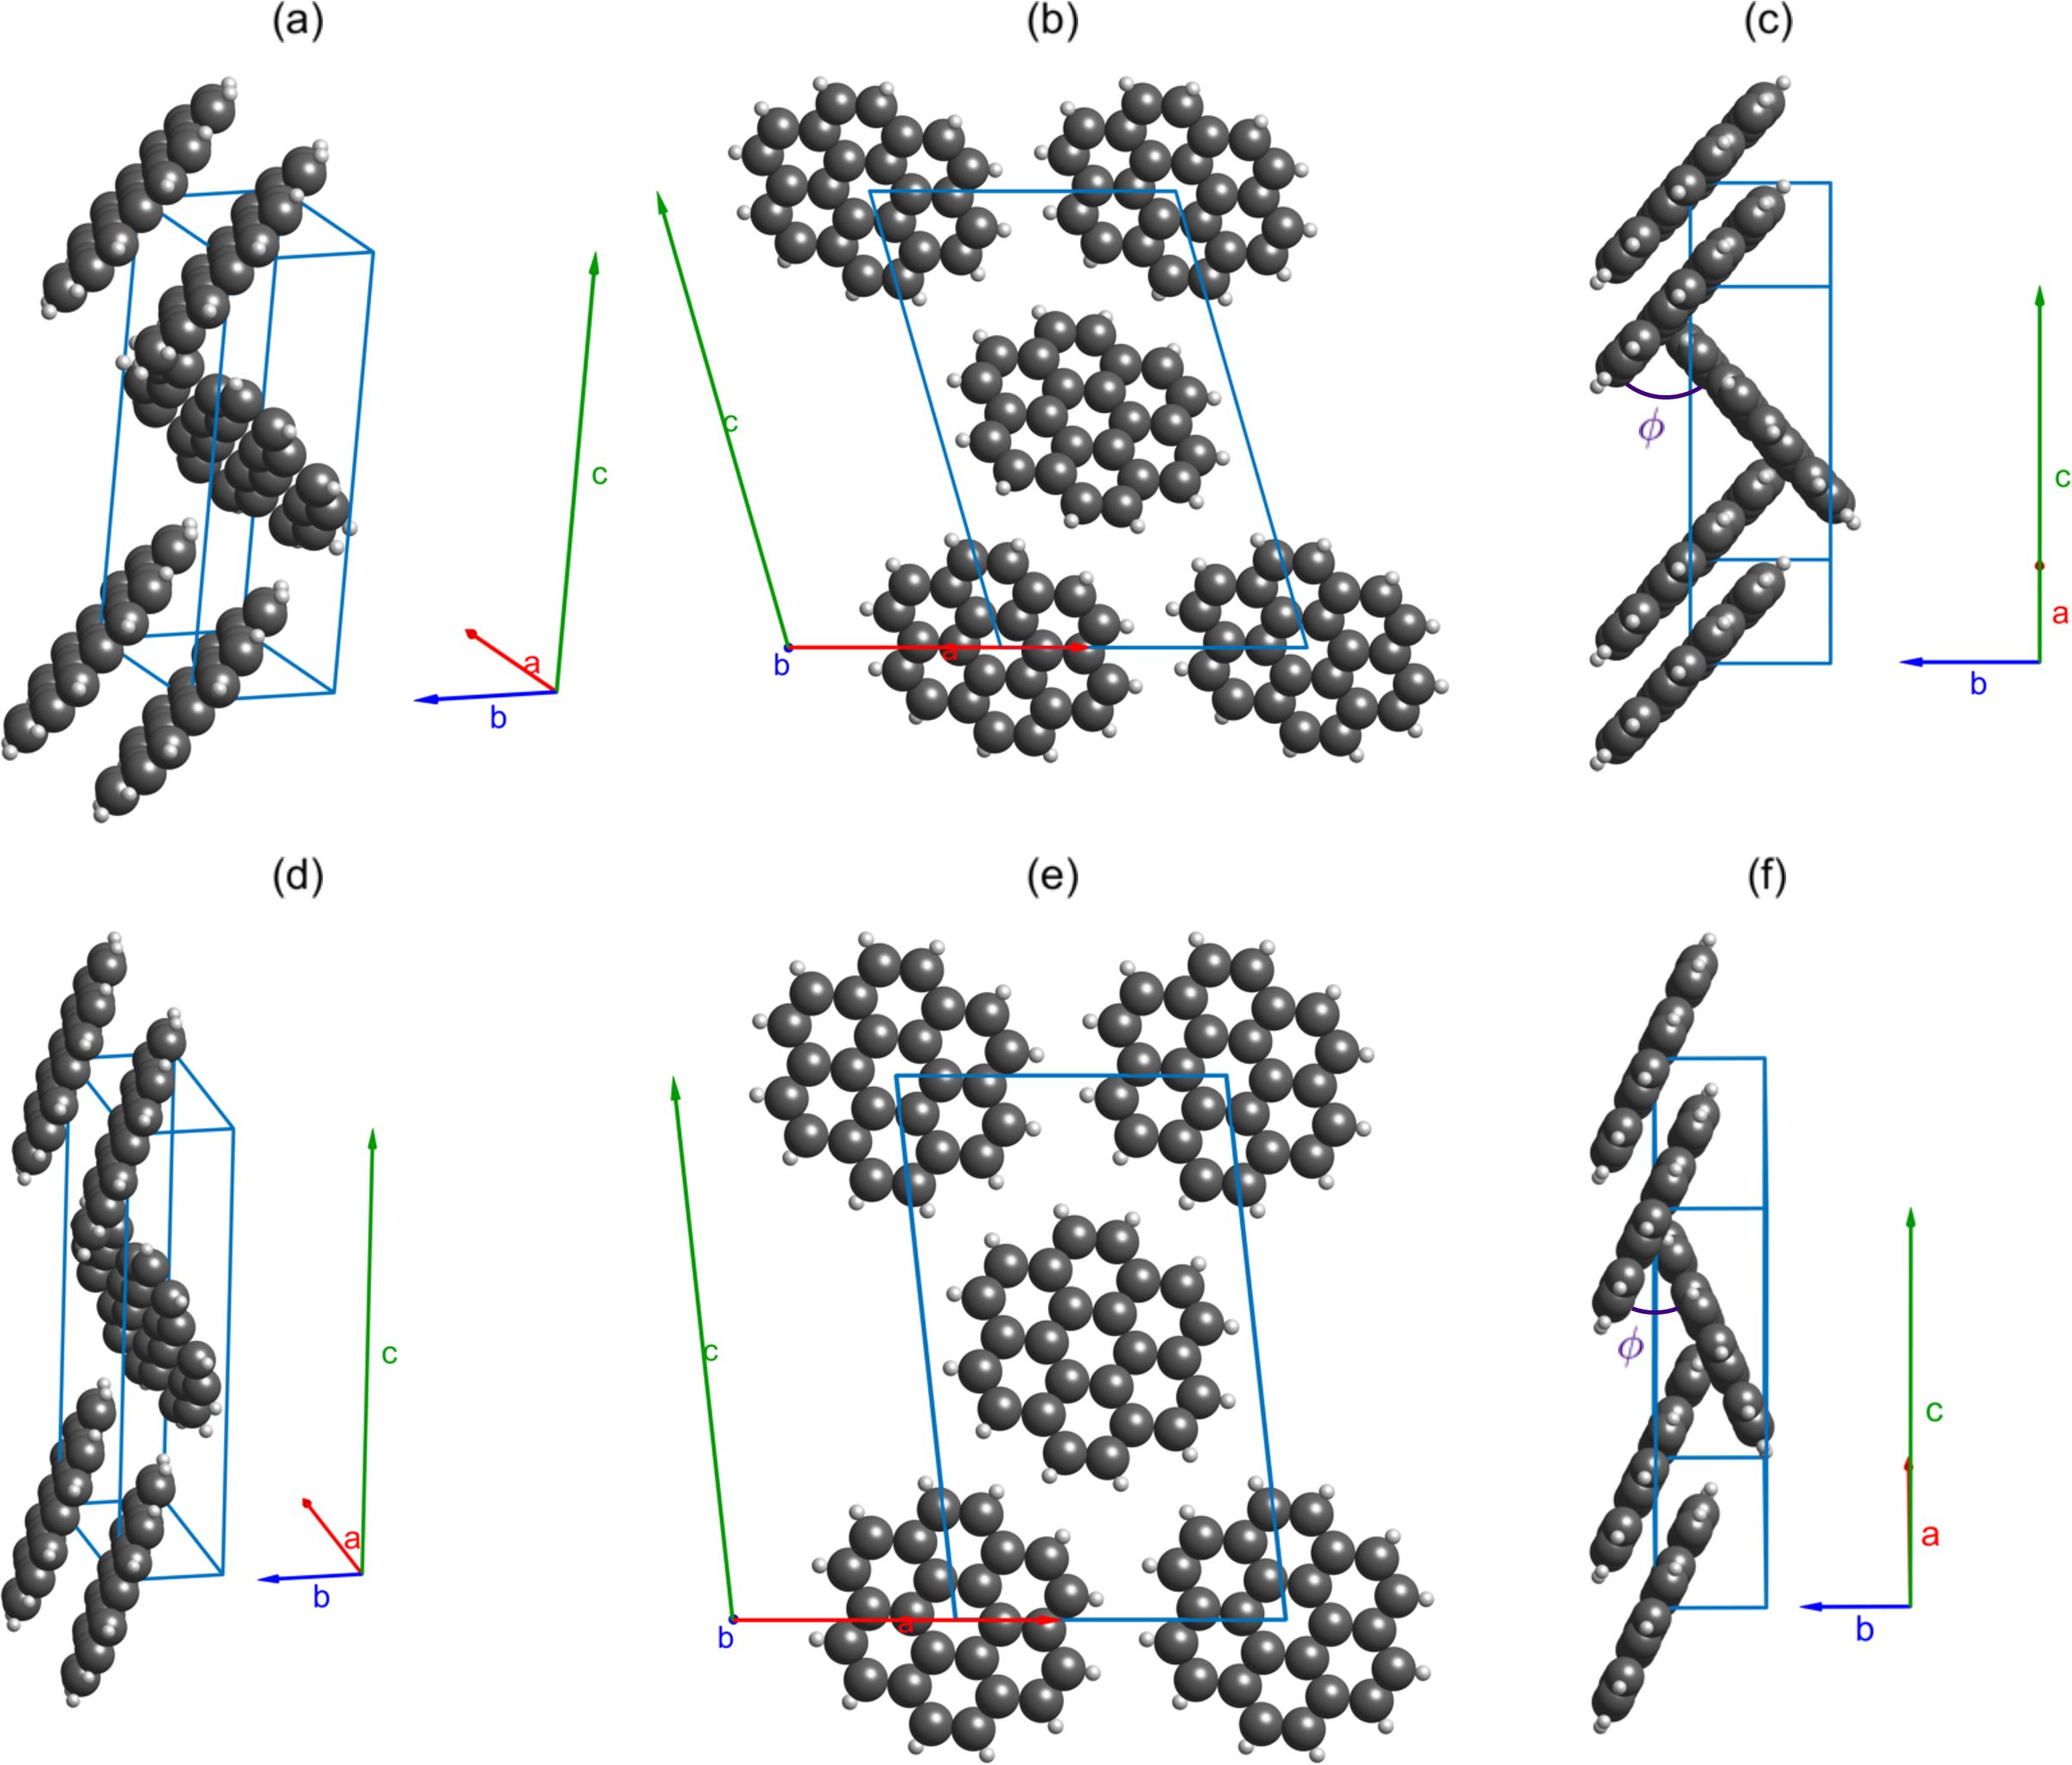
Among organic aromatic semiconductors such as pentacene, tetracene, perylene and others that exhibit polymorphism, coronene has gathered much interest Zhao and Truhlar (2008); Ruuska and Pakkanen (2001); Blumstengel et al. (2008); Langhoff (1996); Kubozono et al. (2011). Several optical spectroscopy experiments have indicated structural phase transitions upon cooling single crystals Ohno et al. (1972); Yamamoto et al. (1994); Nakatani et al. (1994); Orendt et al. (2000); Potticary et al. (2016a) and also under pressure Yamamoto et al. (1994); Zhao et al. (2013), and the existence of two stable crystalline structures has been reported Potticary et al. (2016a). Very recently Salzillo et al. have reported high quality low-wavenumber Raman spectra of single crystals as a function of temperature, and modelled them using dispersion corrected density-functional theory Salzillo et al. (2018). Upon cooling below K the common phase, , transforms into a second phase, the phase. Both phases contain two molecules per unit cell, but with a major difference in the angle between the molecular planes (figure 1(c,f)). In this work, we use low-frequency Raman spectroscopy and dispersion corrected density-functional theory (DFT-D3) modelling to study the Raman spectrum across the phase transition, assigning the spectra and establishing the key differences between the polymorphs. We identify the Raman active phonons of -coronene as rotations and librations of the molecules with axes almost perpendicular and parallel to the plane of bonds, respectively. In -coronene the axes of rotation and libration are instead at intermediate angles with respect to the molecular plane and result in modes that appear to be combinations of librations and rotations. We also explain the correlation between the geometrical characteristics of the modes and the Raman activity.
II Methods
II.1 Computations
Energy calculations and structural optimisations were performed using the Vienna ab initio simulation package (VASP) code Kresse and Hafner (1993). The PBE functional Perdew et al. (1996) was employed with PAW pseudopotentials Blöchl (1994); Kresse and Joubert (1999) and a kinetic energy cut off of 850 eV for the plane-wave basis. The Grimme-D3 scheme Grimme (2011); Grimme et al. (2010) was used to account for van der Waals forces. For both structures, a centred Monkhorst-Pack -point mesh was used to sample the Brillouin zone. Increasing -point sampling to , as used in previous work Potticary et al. (2016a), gave a difference in the lattice energies of 3 meV and a 0.3% change in unit cell parameters. Total-energy calculations were considered converged when the energy change between two successive electronic steps was less than 10-8 eV. Structures were allowed to fully relax until all forces acting on the atoms were 10-4 eV/Å. Phonopy Togo et al. (2008); Togo and Tanaka (2015) was used to calculate vibrational frequencies and eigenvectors within the harmonic approximation. VASP was used as the force calculator with a finite displacement step of 0.015 Å. Raman activity tensors were calculated using a central-differences scheme Fonari and Stauffer (2013); Skelton et al. (2017); Skelton (2018) with required dielectric constants calculated using VASP. The symmetry labels of vibrational modes were output by Phonopy from inbuilt group tables.
II.2 Crystal growth
Crystals of -coronene were grown using a physical transport method in a 3 zone furnace Henderson et al. (2018). Powdered -coronene crystals of 97% purity were sourced from Sigma-Aldrich and twice purified by sublimation under vacuum. The purified -coronene was placed on a platform in a quartz boat at one end of a quartz tube inside the furnace. The furnace was heated to 175C, 225C and 275C at the end, middle and sample end respectively. Gaseous argon was set to flow from hot to cold at a rate of approximately 40 cm-3/min. After 2 days the furnace was allowed to cool and crystals were removed. The two purification steps were found to be critical in reducing the fluorescence background in Raman experiments enabling better resolution of the peaks - the origin of the residual fluorescence is unknown but could be linked to a defect enhanced two photon absorption process as recently observed in rubrene Cruz et al. (2018). Crystals of -coronene were obtained by cooling the purified -coronene crystals below 150 K.
II.3 Single crystal x-ray diffraction
Data collection was carried out at four different temperatures, starting at 290 K, decreasing to 200 K at 300 K/hour and stabilising for 2 minutes, then further decreasing to 150 K and 80 K with a stabilising time of 10 minutes. Diffraction datasets were collected on a Rigaku SuperNova, Dual, Cu at zero, EosS2 single crystal diffractometer using monochromated Cu-K radiation with = 1.54184 Å. A symmetry-related (multi-scan) absorption correction was applied with CrysAlisPro 1.171.38.43. Structures were solved with SHELXT and refined by full-matrix least-squares fits on F2 Sheldrick (2015), with additional analysis performed using SHELXle Hübschle et al. (2011). We found that the crystals deteriorated at 80 K, preventing further characterisation.
II.4 Raman
Raman measurements were performed using a Renishaw InVia Raman spectrometer operated in backscatter geometry, equipped with a 633 nm excitation laser, 2400 lines/mm grating and a long working distance 50 objective lens (NA = 0.5). The spectral resolution of this configuration was better than 1 cm-1. Volume Bragg grating notch filters (Eclipse) with a nominal cut-off of 10 cm-1 were used to measure the low frequency Raman modes. The laser power incident on the sample was 4.0 0.1 mW. To control the temperature during measurements, the sample was placed in a Linkam THMS600 stage and Raman measurements collected through a quartz window, reducing the laser power to 3.7 0.1 mW. The stage has an operational temperature range of -77 to 327 K and an accuracy of the order 0.1 K. For polarisation measurements, a rotatable waveplate, with an accuracy of on rotated angle between 0 and 90, was placed in the path of the laser before the sample, and a linear polariser was placed after the sample and in front of the detector. Peaks were fit using Voigt profiles Wells (1999); Abrarov and Quine (2011); Gautschi (1970), to account for the intrinsic Lorentzian lineshapes and Gaussian broadening imposed by the instrumentation Meier (2005).
III Results and discussion
We first compare the crystal structures of the two phases predicted from our DFT-D3 calculations to experimental measurements. We then present a comprehensive characterisation of the low-frequency Raman spectra across the phase transition. Initial mode assignments are made based on peak positions and confirmed by measuring the polarization dependence of the Raman activity. Finally the differences in spectra of the two polymorphs is rationalised by analysing the atomic motion associated with the vibrations.
III.1 Crystal structures
A series of single crystal x-ray diffraction measurements were taken on a -coronene crystal, figure 2. The lattice parameters show a linear temperature dependence, which produces extrapolated 0 K values of Å, Å, Å and giving a volume Å3 and an intracell molecular angle, as indicated in figure 1(c), of .
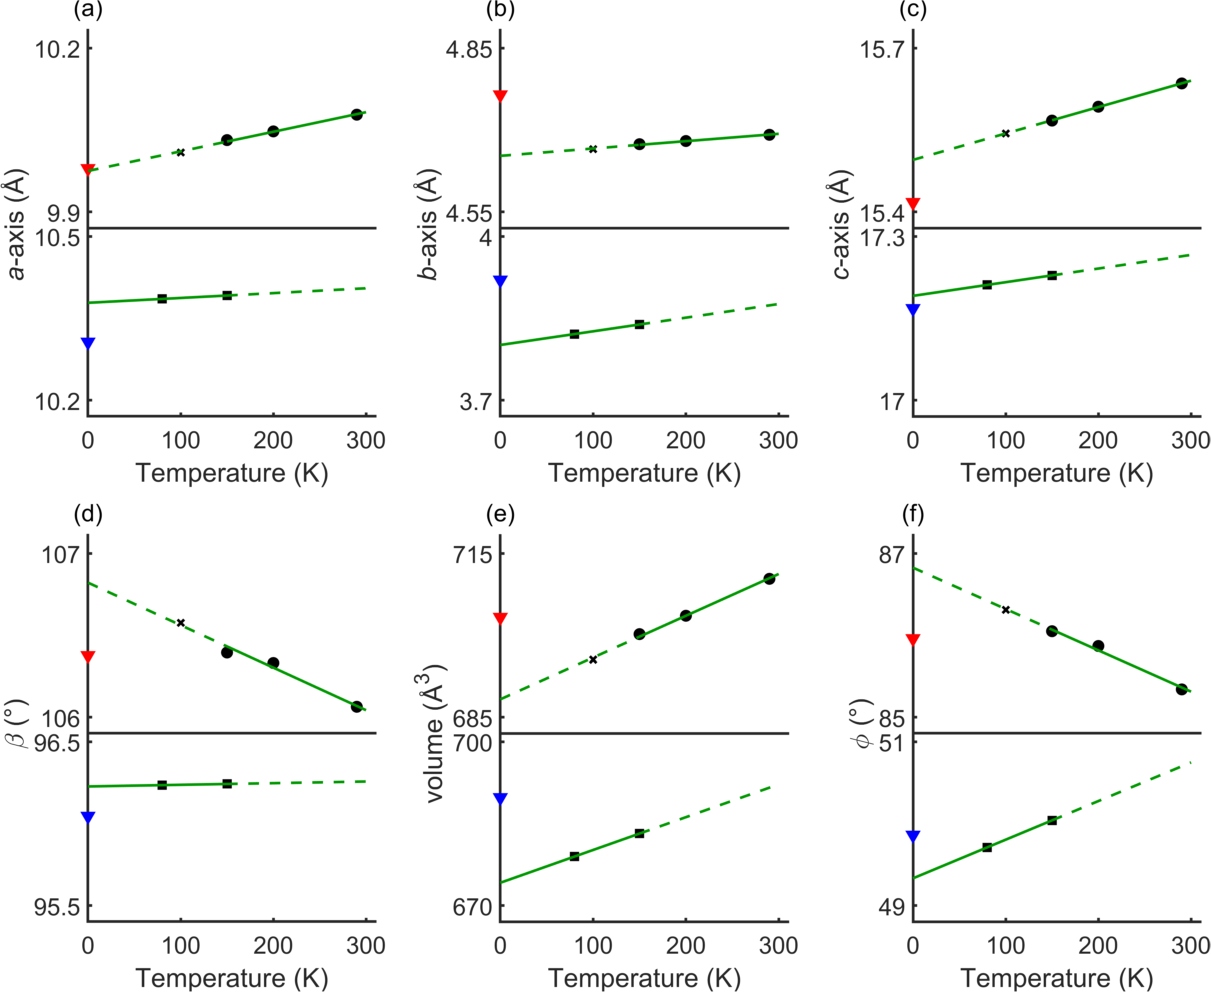
Starting from the experimental -coronene structure, relaxation with DFT-D3 yields lattice parameters Å, Å, Å and giving Å3. The intracell molecular angle is . As seen in figure 2(b,c), the main differences between the calculated and measured structures are a larger -axis and a slightly smaller -axis. These are within 1.6% of the lattice parameters measured at 290 K and within 2.5% of the extrapolated 0 K values, while is within 0.7% of the 290 K value and 1.0% of the 0 K extrapolation, indicating that our relaxed -coronene crystal structure is comparable to experiment. The level of agreement gives confidence in using DFT-D3 to interpret our experimental results.
The phase was also optimised using DFT-D3. Relaxations starting from experimental lattice parameters and previously reported DFT results Potticary et al. (2016a) both produced identical final structures. The calculated lattice parameters are Å, Å, Å and giving Å3, with an intracell molecular angle of . Figure 2 shows a comparison between our DFT-D3 lattice parameters and the measured parameters in ref. Potticary et al. (2016a). The largest differences with experimental measurements are a decrease in the predicted -axis and an increase the -axis (figure 2(a,b)). Our lattice parameters are within 2.1% of those measured at 150 K and within 3.1% of the extrapolated 0 K values. The intracell molecular angle is within 0.4% at 150 K and 1.1% of the 0 K extrapolation. This again indicates that DFT-D3 is appropriate for further calculations.
III.2 Raman
Figure 3(a) shows Raman spectra recorded from a single -coronene crystal while reducing the temperature at a rate of 15 K/min. Between 300 K and 175 K two peaks labelled A and B are visible, as observed in previous Raman measurements Ohno et al. (1972); Salzillo et al. (2018). At 163 K the crystal was observed to shatter. Subsequent spectra recorded from a crystal fragment between 150 K and 100 K show four peaks labelled C-F. It has recently been confirmed from x-ray experiments that a phase transition occurs at 150 K and the low-temperature phase was determined to be the phase of coronene Potticary et al. (2016a, b). A second crystal fragment measured while increasing temperature gave consistent results Sup . In both phases, as the temperature decreases, the peaks shift to higher frequencies.

For -coronene, the calculations predict six Raman active modes (table 1). These are compared with the experimental spectra in figure 3(b). The two lowest frequency modes at 34.13 cm-1 (mode 1) and 42.15 cm-1 (mode 2) are predicted to have very small intensities in comparison to the other four, which is consistent with these two modes being absent in the experimental spectra. Of the other modes the first two are close in frequency (63.09 cm-1 (mode 3) and 65.60 cm-1 (mode 4)) and have similar intensities, such that line broadening causes the modes to overlap and produce peak A at 63.5 cm-1 in the experimental spectra. Mode 5 (86.85 cm-1) is unlikely to be observed, as mode 6 (92.85 cm-1) has 14 times higher intensity, making it hard to discern mode 5 above the background and/or the tail of mode 6. We note that the predicted intensities assume an orientational average of the Raman activity tensors, which means a quantitative comparison of the intensity profiles is not realistic given that the experiments were performed on a single crystal of unknown orientation, which will create a spatial dependence of the intensity. Despite this, however, the peak positions agree well, enabling a tentative mode assignment to be made.
| 175 K experiment | DFT-D3 | |||
| Mode | Frequency | Intensity | Frequency | Intensity |
| ID | (cm-1) | (kcounts) | (cm-1) | (Å4amu-1) |
| 1 | not observed | 34.13 | 0.2 | |
| 2 | not observed | 42.15 | 2.4 | |
| 3 | (A) 63.5 | 63.09 | 125.0 | |
| 4 | 65.60 | 82.9 | ||
| 5 | not observed | 86.85 | 25.3 | |
| 6 | (B) 92.8 | 92.85 | 359.7 | |
| 100 K experiment | DFT-D3 | |||
| Mode | Frequency | Intensity | Frequency | Intensity |
| ID | (cm-1) | (kcounts) | (cm-1) | (Å4amu-1) |
| 1 | not observed | 17.73 | 0.7 | |
| 2 | (C) 44.8 | 40.10 | 60.4 | |
| 3 | (D) 54.6 | 52.34 | 58.3 | |
| 4 | (E1) 76.6 | 77.84 | 102.9 | |
| 5 | (E2) 77.5 | 80.97 | 88.0 | |
| 6 | (F) 90.3 | 93.77 | 99.3 | |
For -coronene, DFT-D3 again predicts six Raman active modes (table 2), which are compared to the experimental spectra in figure 3(c). The lowest frequency mode at 17.73 cm-1 (mode 1) is not observed in our experiments, due both to its low intensity and the frequency lying below our realistic analysis window of 30 cm-1 due to noise from other sources of scattering. Of the remaining five modes, figure 3(c) suggests that the two modes at 77.84 cm-1 (mode 4) and 80.97 cm-1 (mode 5) overlap in the experiments to produce peak E. The other three modes predicted at 40.10 cm-1 (mode 2), 52.34 cm-1 (mode 3) and 93.77 cm-1 (mode 5) can be individually resolved in the spectra. By fitting the experimental spectra with five Voigt profiles, peak E can be deconvoluted into two component peaks at 76.6 cm-1 (E1) and 77.5 cm-1 (E2). The other three peaks, C, D and F, occur at 44.8 cm-1, 54.6 cm-1 and 90.3 cm-1 respectively. Small discrepancies of up to 4 cm-1 in frequency between the experimental and predicted frequencies are observed, which we ascribe to a combination of small disparities in the predicted crystal structure, anharmonicity and thermal effects.
To further confirm the assignment of modes, the full Raman tensors were calculated from DFT-D3 and used to simulate polarised Raman measurements, which are compared to experimental measurements in figure 4(a,b).
For -coronene, as the input polarisation is rotated from 0 to 90, the intensity of the A and B peaks decreased until they are unobservable above the noise level at 90, and then increases again to a maximum at 180. Neither of the peak positions change with polarisation, indicating that both have a single component, and thus both peaks were fitted to a single Voigt profile. All the polarised spectra were fitted simultaneously, with the peak positions and the Gaussian and Lorentzian widths constrained to be the same. The peak positions fitted here are lower in frequency than those listed in table 1 as the polarisation measurements were performed at room temperature (c.f. figure 3(a)). Intensity as a function of input polarisation angle is shown in figure 4(c), and half figure of eight shapes were observed for both peaks.
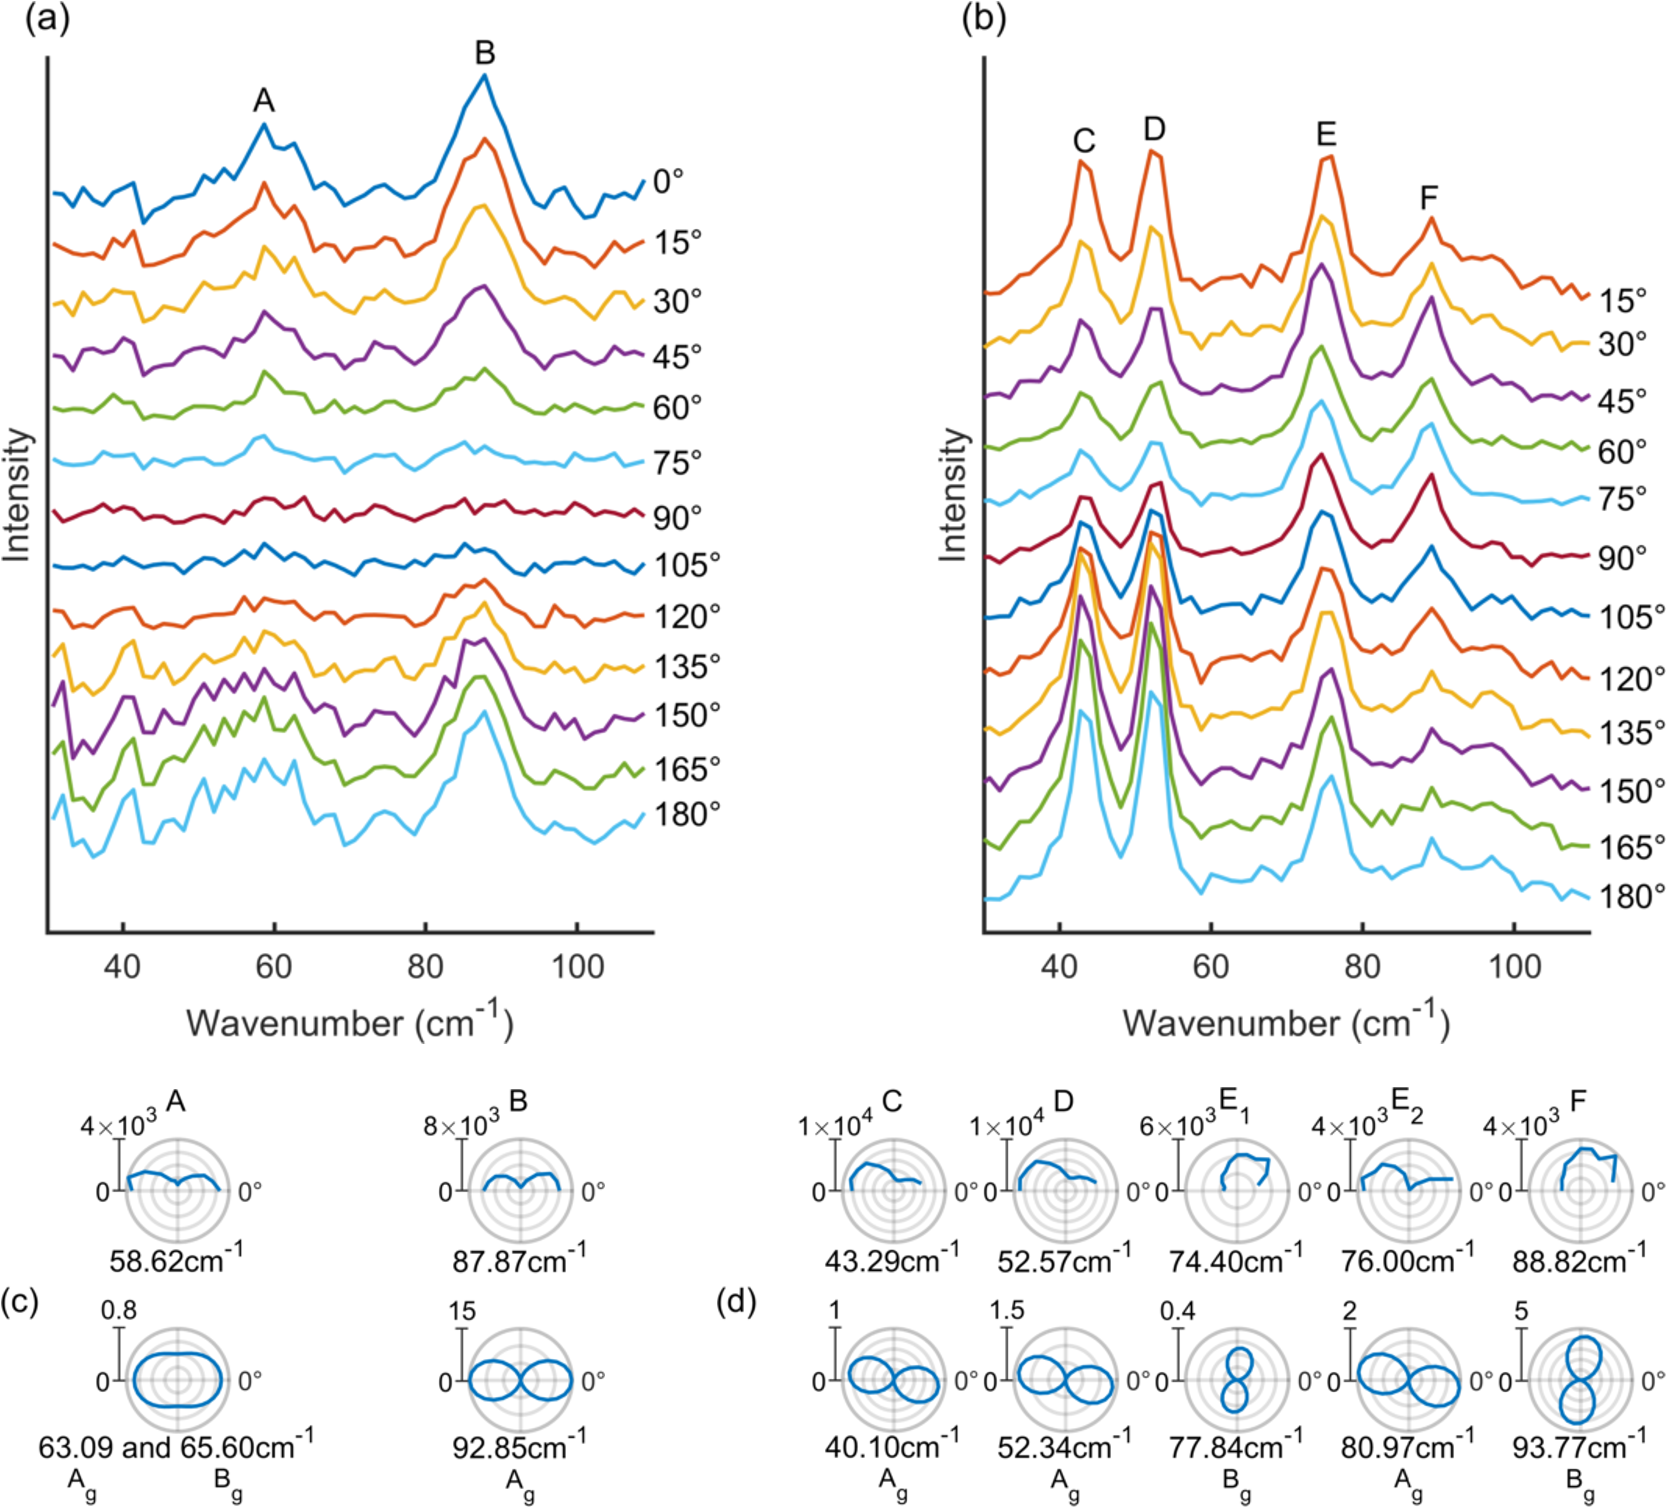
In order to interpret these results using our calculations, it was necessary to determine the orientation of the crystal sample, so face indexing was carried out using x-ray diffraction Sup . The long crystal side, determined to be the -axis, was aligned with the experimental vertical at 0. With this knowledge, the Raman intensity as a function of input polarisation was calculated using the Raman tensors (figure 4(c); for ease of analysis, modes 3 and 4 of -coronene were combined). The combined intensity polar plot for modes 3 and 4 result in an oval shape, since both modes exhibit figure of eight behaviour but with lobes at 90 to each other. Mode 6 also exhibits figure of eight behaviour, with lobes at 0 and 180. Mode 5 was excluded from the analysis as it is not resolved in the experimental measurements, and combining it with mode 6 when analysing the calculation results was found to make an insignificant difference to the predicted polar plot. Our calculations correctly predict the polarisation dependence of the intensities of all of the peaks, confirming our mode assignments. A second set of measurements was also performed with the output polariser rotated by 90 Sup - in these measurements, peak A was suppressed in intensity, meaning no useful data could be extracted, while the calculations again predicted the correct polarisation dependence of the intensity of peak B, further confirming our mode assignments.
Low-temperature polarisation measurements on the -coronene phase were also carried out (figure 4(b)). The positions of peaks C, D and F exhibit no polarisation dependence, while the position of peak E shifts slightly as the input polarisation is varied, which confirms that peak E is indeed a combination of multiple modes, consistent with our earlier assignment (figure 3(c)). The spectra were fitted to a set of five Voigt functions using the method detailed above. All five modes showed figure of eight dependencies on the polarisation (figure 4(d)). Peaks C, D and E2 show half figure of eights with lobes at 0 and 180, while peaks E1 and F show only one lobe at 90. Note that the figures of eight are slightly rotated from 0 and 90, which is due to the long side of the crystal fragment - assumed to be along the -axis - being 8 away from the vertical (0) in the experiments Sup .
Since it was not possible to preserve the -crystal fragment for face indexing, we generated polar plots from our calculations assuming the same face indexation as -coronene - both structures are very similar, and will therefore very likely have similar preferred crystal faces. The predicted intensity polar plots, accounting for the 8 offset, are shown in figure 4(d), and again demonstrate very good agreement with our experiments. We find that the calculations again predict the correct polarisation dependences, providing a clear assignment of modes.
Results with the detector polarisation rotated by 90 are presented in Sup . These again show four peaks, which we fitted to five Voigt profiles, and the polarisation dependence of the intensities again shows good agreement with our simulations.
III.3 Atomic motion
The preceding results indicate that there are remarkable differences in Raman spectra of - and -coronene despite their very similar structures. To understand this difference we compared the atomic motion associated with the vibrations of the two polymorphs predicted by the calculations.
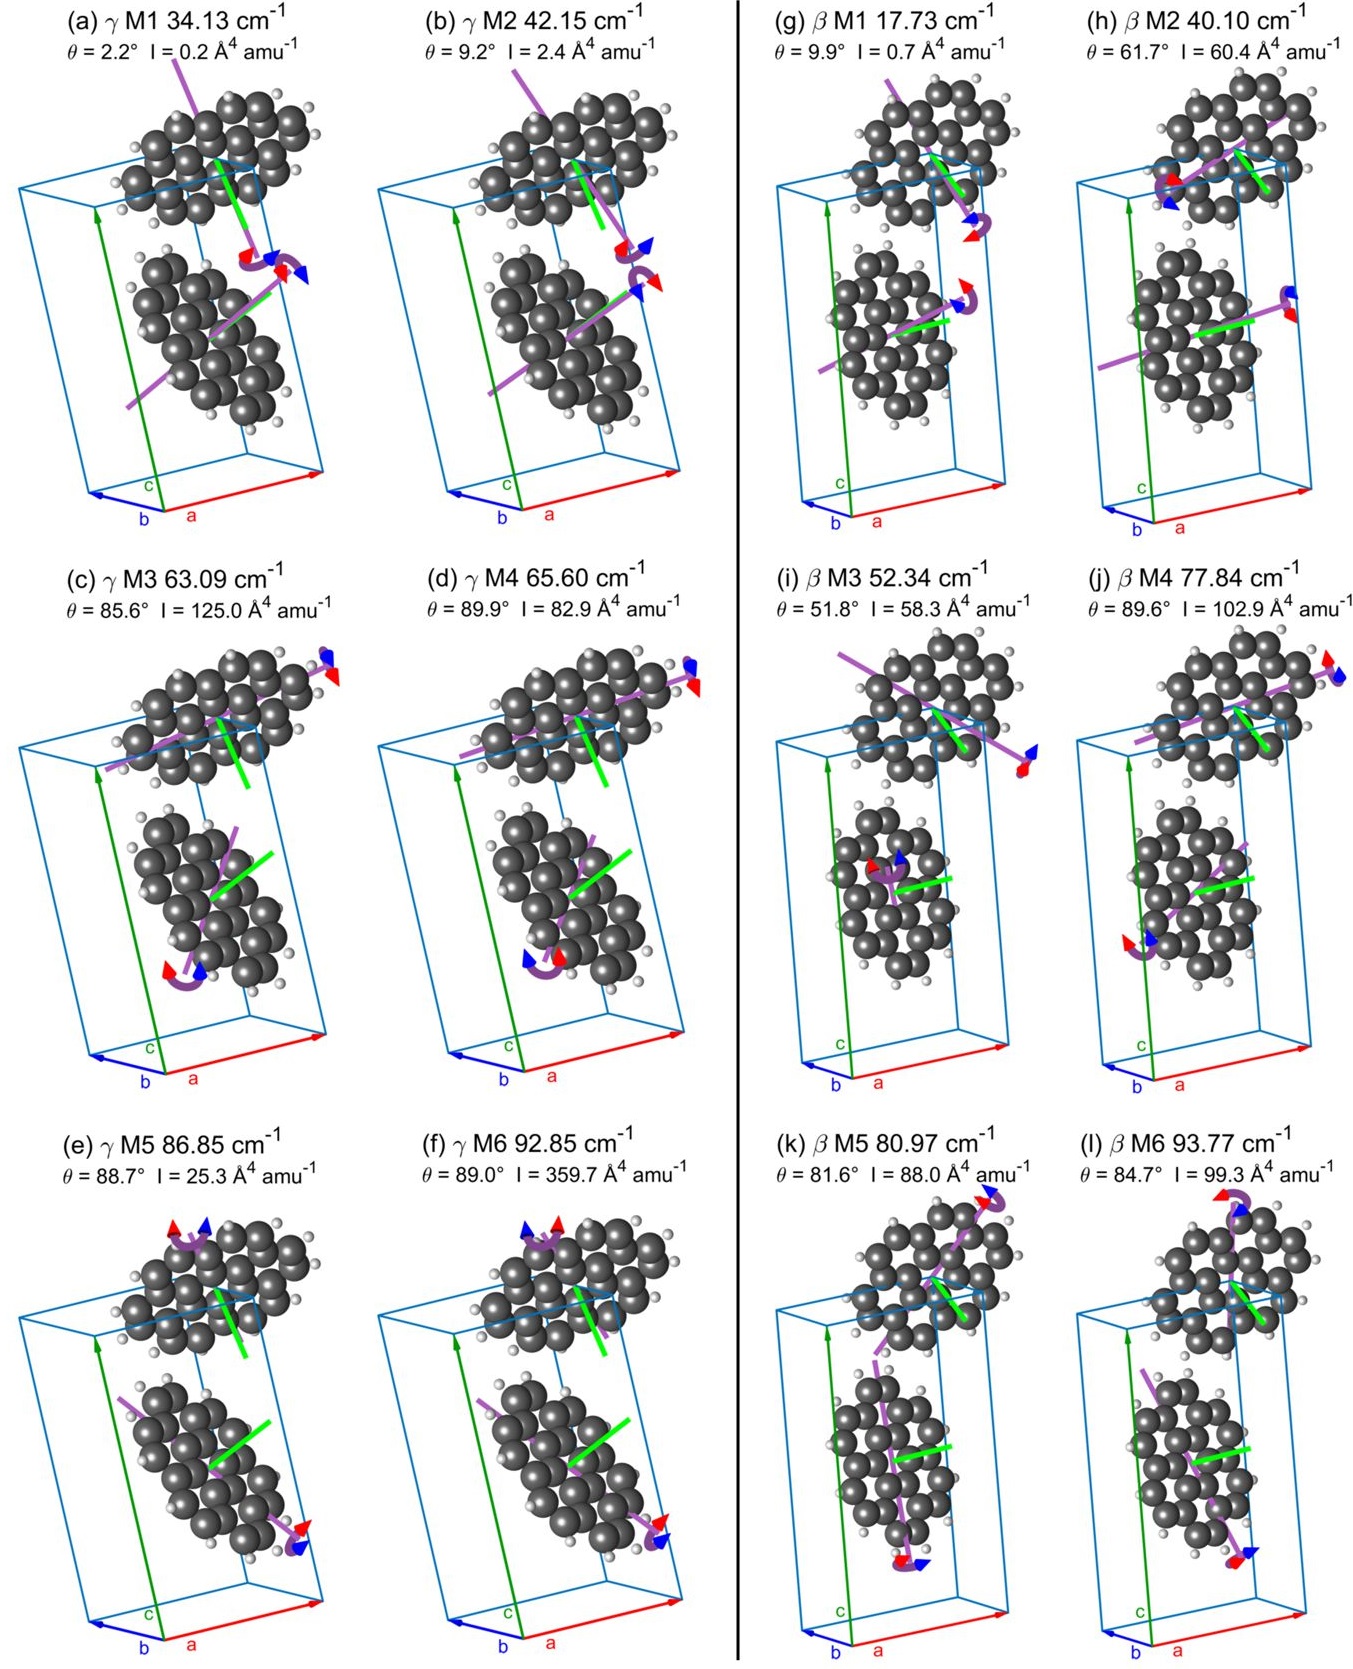
The vibrational motion associated with the Raman active phonon modes of both polymorphs is shown in figure 5. All of the modes involve rocking-type rotations of the molecules around an axis indicated by purple lines, which makes an angle to the normal of the molecular plane (the molecular normal axis) shown in green.
For -coronene, the six Raman active modes can be grouped into sets of two. In the lowest-frequency pair, modes 1 and 2, the rotational axis is close to the molecular normal at and , respectively, indicating them to be rotational modes (figure 5(a,b)). The difference between the molecular motions in the two modes is a reversal in the direction of one of the molecules. Since a molecule rotating exactly around its molecular normal will not produce any significant change in polarisation, the small angle away from the normal in these modes will result in a small change in polarisation, explaining the small intensities calculated for these modes and the fact that these peaks were not seen in our measured Raman spectra.
Modes 3 to 6 all have rotational axes that are almost perpendicular to the molecular normal and are therefore predominantly librations. Each rocking rotation of a molecule will produce a significant change in polarisation, accounting for the higher intensities for these modes compared to modes 1 and 2. Modes 3 and 4 both rock around similar axes but with one molecule rotating in the opposite direction relative to the other mode (figure 5(c,d)). Mode 3 has a higher intensity than mode 4, which can be explained by considering the contribution each molecule makes to the total change in polarisation and the effect the reversal of one rotation direction has: one can think of a ‘constructive’ addition of the change in polarisation from each molecule in mode 3 producing a larger change in polarisation, and hence intensity, while in mode 4 a ‘destructive’ like addition occurs producing a smaller change in polarisation and a lower intensity. Modes 5 and 6 exhibit similar behaviour (figure 5(e,f)) albeit with a significantly larger difference in the intensities. We speculate this is due to the rotational axes of the molecules in modes 5 and 6 being more in line with each other than in modes 3 and 4, giving a stronger ‘constructive/destructive’ effect and hence intensity difference.
Turning to -coronene, we find that the vibrational motions are markedly different, although some similarities can be observed. The lowest frequency mode 1 is similar to that in -coronene, in that the rotational axis is close to the molecular normal such that the mode corresponds to a rotation type vibration with a low intensity, and the directions of rotation of the molecules are similar. In contrast, modes 2 and 3 show fundamentally different motion to any of the modes in -coronene. An angle of 61.7 and 51.8 respectively produce a change in polarisation large enough to be observed experimentally, and indicate a mix of rotational and librational motion.
Modes 4 to 6 have rotational axes close to perpendicular to the normal axes, i.e. they have librational character, but do not couple together like in -coronene, with all the rotational axes in different directions. With respect to the molecule, mode 4 has similar orientation and rotation directions to the corresponding mode 4 in -coronene, whereas mode 5 has no obvious pair and mode 6 is similar to mode 5 in -coronene. All three of these modes give measureable intensities and none dominate over the others. Hence five modes (2-6) in the four peaks C-F, where peak E is deconvoluted into two peaks by fitting, are observed in our experimental spectra.
IV Conclusion
The lattice vibrations of - and -coronene have been investigated using low frequency Raman measurements and the remarkable differences, given the similartiy of the two polymorphs, rationalised with reference to the atomic motions predicted by DFT-D3 calculations. For - (-) coronene, the calculations yield optimised structures with lattice parameters within 1.6% (2.1%) and an intracell angle within 0.7% (0.4%) of x-ray structures collected at 290 K (150 K) on single crystals. For both structures, the calculations predict six Raman-active phonon modes below 150 cm-1, but taking into account differences in intensities and allowing for experimental resolution and a low wavenumber cut-off of 30 cm-1, these are consistent with the two (four) peaks observed in Raman spectra taken from - (-) coronene crystals, respectively, and which reflect contributions from three (five) modes with measured and calculated frequencies differing at most by 4 cm-1.
The Raman spectra are consistent with the atomic motion predicted by the calculations. In -coronene, the modes are considered to be coupled into three pairs, with the lowest-frequency pair consistent with rotational motion giving rise to small intensities, and the remaining two pairs showing librational motion. In each pair, the axes of rotation were similar but with a reversal of direction of one molecule. In -coronene, the lowest frequency mode was found to be mostly rotational in character, and the three highest frequency Raman-active phonon modes were mainly librational. The remaining two modes exhibit a mixture of rotational and librational behaviour, with an angle between the rotational axis and molecular normal of 50-60. The excellent agreement between theory and experiment presented here justifies the study of lattice vibrations throughout the Brillouin zone using DFT-D3, a necessary step towards the understanding of phase stability and the phase transition. On both aspects we will report on elsewhere.
Acknowledgements.
We are grateful to Wendy Lambson for technical support. J.M.S. is grateful to the University of Manchester for the award of a Presidential Fellowship. N.B. acknowledges funding and support from the Engineering and Physical Sciences Research Council (EPSRC) Centre for Doctoral Training in Condensed Matter Physics (CDT-CMP), Grant No. EP/L015544/1. This research made use of the Balena High Performance Computing (HPC) Service at the University of Bath. X-ray diffraction facilties were provided though the Chemical Characterisation and Analysis Facility (CCAF) at the University of Bath (www.bath.ac.uk/ccaf).References
- Schwoerer and Wolf (2007) M. Schwoerer and H. C. Wolf, Organic molecular solids (John Wiley & Sons, 2007).
- Harrelson et al. (2019) T. F. Harrelson, V. Dantanarayana, X. Xie, C. Koshnick, D. Nai, R. Fair, S. A. Nuñez, A. K. Thomas, T. L. Murrey, M. A. Hickner, J. K. Grey, J. E. Anthony, E. F. Gomez, A. Troisi, R. Faller, and A. J. Moulé, Mater. Horizons 6, 182 (2019).
- Fratini et al. (2017) S. Fratini, S. Ciuchi, D. Mayou, G. T. de Laissardière, and A. Troisi, Nat. Mater. 16, 998 (2017).
- Sosorev et al. (2018) A. Y. Sosorev, D. Maslennikov, I. Y. Chernyshov, D. Dominskiy, V. Bruevich, M. Vener, and D. Y. Paraschuk, Phys. Chem. Chem. Phys. 20, 18912 (2018).
- Ando et al. (2019) M. Ando, M. Yoneya, T. B. Kehoe, H. Ishii, T. Minakata, M. Kawasaki, C. M. Duffy, R. Phillips, and H. Sirringhaus, Phys. Rev. Mater. 3, 025601 (2019).
- Cigarini et al. (2017) L. Cigarini, A. Ruini, A. Catellani, and A. Calzolari, J. Phys. D 50, 395502 (2017).
- Della Valle et al. (1996) R. G. Della Valle, E. Venuti, and A. Brillante, Chem. Phys. 202, 231 (1996).
- Brillante et al. (2008) A. Brillante, I. Bilotti, R. G. Della Valle, E. Venuti, and A. Girlando, CrystEngComm 10, 937 (2008).
- Califano et al. (1981) S. Califano, V. Schettino, and N. Neto, Lattice Dynamics of Molecular Crystals (Springer, 1981).
- Anderson et al. (2017) M. Anderson, C. Ramanan, C. Fontanesi, A. Frick, S. Surana, D. Cheyns, M. Furno, T. Keller, S. Allard, U. Scherf, D. Belijonne, G. D’Avino, E. von Hauff, and E. Da Como, Phys. Rev. Mater. 1, 055604 (2017).
- Girlando et al. (2010) A. Girlando, L. Grisanti, M. Masino, I. Bilotti, A. Brillante, R. G. Della Valle, and E. Venuti, Phys. Rev. B 82, 035208 (2010).
- Lee et al. (2016) J.-U. Lee, K. Kim, S. Han, G. H. Ryu, Z. Lee, and H. Cheong, ACS nano 10, 1948 (2016).
- Froehlicher et al. (2015) G. Froehlicher, E. Lorchat, F. Fernique, C. Joshi, A. Molina-Sánchez, L. Wirtz, and S. Berciaud, Nano Lett. 15, 6481 (2015).
- Duong et al. (2017) D. L. Duong, G. Ryu, A. Hoyer, C. Lin, M. Burghard, and K. Kern, ACS Nano 11, 1034 (2017).
- Zhao and Truhlar (2008) Y. Zhao and D. G. Truhlar, J. Phys. Chem. C 112, 4061 (2008).
- Ruuska and Pakkanen (2001) H. Ruuska and T. A. Pakkanen, J. Phys. Chem. B 105, 9541 (2001).
- Blumstengel et al. (2008) S. Blumstengel, S. Sadofev, and F. Henneberger, New J. Phys. 10, 065010 (2008).
- Langhoff (1996) S. R. Langhoff, J. Phys. Chem. 100, 2819 (1996).
- Kubozono et al. (2011) Y. Kubozono, H. Mitamura, X. Lee, X. He, Y. Yamanari, Y. Takahashi, Y. Suzuki, Y. Kaji, R. Eguchi, K. Akaike, T. Kambe, H. Okamoto, A. Fujiwara, T. Kato, T. Kosugi, and H. Aogi, Phys. Chem. Chem. Phys. 13, 16476 (2011).
- Ohno et al. (1972) K. Ohno, T. Kajiwara, and H. Inokuchi, Bull. Chem. Soc. Jpn. 45, 996 (1972).
- Yamamoto et al. (1994) T. Yamamoto, S. Nakatani, T. Nakamura, K.-i. Mizuno, A. H. Matsui, Y. Akahama, and H. Kawamura, Chem. Phys. 184, 247 (1994).
- Nakatani et al. (1994) S. Nakatani, T. Nakamura, K. Mizuno, and A. Matsui, J. Lumin. 58, 343 (1994).
- Orendt et al. (2000) A. M. Orendt, J. C. Facelli, S. Bai, A. Rai, M. Gossett, L. T. Scott, J. Boerio-Goates, R. J. Pugmire, and D. M. Grant, J. Phys. Chem. A 104, 149 (2000).
- Potticary et al. (2016a) J. Potticary, L. R. Terry, C. Bell, A. N. Papanikolopoulos, P. C. Christianen, H. Engelkamp, A. M. Collins, C. Fontanesi, G. Kociok-Köhn, S. Crampin, E. Da Como, and S. R. Hall, Nat. Comm. 7 (2016a).
- Zhao et al. (2013) X.-M. Zhao, J. Zhang, A. Berlie, Z.-X. Qin, Q.-W. Huang, S. Jiang, J.-B. Zhang, L.-Y. Tang, J. Liu, C. Zhang, G.-H. Zhong, H.-Q. Lin, and C. Xiao-Jia, J. Chem. Phys. 139, 144308 (2013).
- Salzillo et al. (2018) T. Salzillo, A. Giunchi, M. Masino, N. Bedoya-Martínez, R. G. Della Valle, A. Brillante, A. Girlando, and E. Venuti, Cryst. Growth Des. 18, 4869 (2018).
- Kresse and Hafner (1993) G. Kresse and J. Hafner, Phys. Rev. B 47, 558 (1993).
- Perdew et al. (1996) J. P. Perdew, K. Burke, and M. Ernzerhof, Phys. Rev. Lett. 77, 3865 (1996).
- Blöchl (1994) P. E. Blöchl, Phys. Rev. B 50, 17953 (1994).
- Kresse and Joubert (1999) G. Kresse and D. Joubert, Phys. Rev. B 59, 1758 (1999).
- Grimme (2011) S. Grimme, Wiley Interdiscip. Rev. Comput. Mol. Sci. 1, 211 (2011).
- Grimme et al. (2010) S. Grimme, J. Antony, S. Ehrlich, and H. Krieg, J. Chem. Phys. 132, 154104 (2010).
- Togo et al. (2008) A. Togo, F. Oba, and I. Tanaka, Phys. Rev. B 78, 134106 (2008).
- Togo and Tanaka (2015) A. Togo and I. Tanaka, Scr. Mater. 108, 1 (2015).
- Fonari and Stauffer (2013) A. Fonari and S. Stauffer, vasp_raman.py (github.com/raman-sc/VASP/, 2013).
- Skelton et al. (2017) J. M. Skelton, L. A. Burton, A. J. Jackson, F. Oba, S. C. Parker, and A. Walsh, Phys. Chem. Chem. Phys. 19, 12452 (2017).
- Skelton (2018) J. Skelton, Phonopy-Spectroscopy (github.com/JMSkelton/Phonopy-Spectroscopy/, 2018).
- Henderson et al. (2018) J. Henderson, M. Masino, L. E. Hatcher, G. Kociok-Köhn, T. Salzillo, A. Brillante, P. R. Raithby, A. Girlando, and E. Da Como, Cryst. Growth Des. 18, 2003 (2018).
- Cruz et al. (2018) C. D. Cruz, H. H. Choi, V. Podzorov, E. L. Chronister, and C. J. Bardeen, J. Phys. Chem. C 122, 17632 (2018).
- Sheldrick (2015) G. M. Sheldrick, Acta Crystallogr. C 71, 3 (2015).
- Hübschle et al. (2011) C. B. Hübschle, G. M. Sheldrick, and B. Dittrich, J. Appl. Crystallogr. 44, 1281 (2011).
- Wells (1999) R. Wells, J. Quant. Spectrosc. Radiat. Transf. 62, 29 (1999).
- Abrarov and Quine (2011) S. M. Abrarov and B. M. Quine, Appl. Math. Comput. 218, 1894 (2011).
- Gautschi (1970) W. Gautschi, SIAM J. Numer. Anal. 7, 187 (1970).
- Meier (2005) R. J. Meier, Vib. Spectrosc. 39, 266 (2005).
- Kataeva et al. (2015) O. Kataeva, M. Khrizanforov, Y. Budnikova, D. Islamov, T. Burganov, A. Vandyukov, K. Lyssenko, B. Mahns, M. Nohr, S. Hampel, and M. Knupfer, Cryst. Growth Des. 16, 331 (2015).
- Potticary et al. (2016b) J. Potticary, R. Boston, L. Vella-Zarb, A. Few, C. Bell, and S. R. Hall, Sci. Rep. 6 (2016b).
- (48) “See supplemental material at [url will be inserted by publisher].” .