Timing analysis of 2S 1417-624 observed with NICER and Insight-HXMT
Abstract
We present a study of timing properties of the accreting pulsar 2S 1417-624 observed during its 2018 outburst, based on Swift/BAT, Fermi/GBM, Insight-HXMT and NICER observations. We report a dramatic change of the pulse profiles with luminosity. The morphology of the profile in the range 0.2-10.0 keV switches from double to triple peaks at and from triple to quadruple peaks at . The profile at high energies (25-100 keV) shows significant evolutions as well. We explain this phenomenon according to existing theoretical models. We argue that the first change is related to the transition from the sub to the super-critical accretion regime, while the second to the transition of the accretion disc from the gas-dominated to the radiation pressure-dominated state. Considering the spin-up as well due to the accretion torque, this interpretation allows to estimate the magnetic field self-consistently at G.
keywords:
X-rays: binaries; stars: neutron; stars: magnetic field; X-rays: individual: 2S 1417-6241 Introduction
X-ray pulsars are highly magnetised neutron stars in binary systems with B G, fed by accretion of matter from a donor star. Accretion is one of the most efficient mechanisms known to produce energy, and in fact the observed luminosity of these objects can reach , making them natural ’laboratories’ to study properties of matter under extreme conditions such as very high temperatures and ultra-strong magnetic fields. Pulsations arise because plasma from the accretion disc is channelled by the magnetic field lines onto the magnetic poles, producing beamed radiation, which changes the orientation with respect to observers as the neutron star rotates. Interaction of the accretion flow with the magnetic field thus defines the geometry of the emission region and plays a key role in X-ray pulsars (e.g., Basko & Sunyaev, 1975; Becker & Wolff, 2007; Mushtukov et al., 2015b).
In particular, two regimes of accretion can be identified. If the radiation pressure can be ignored and the luminosity is smaller than a critical value , i.e., in the sub-Eddington regime, the accreted plasma falls onto the surface of the neutron star forming accretion mounds. Otherwise, a radiation-dominated shock appears at some distance above the neutron star surface (see, e.g., Basko & Sunyaev, 1975; Becker et al., 2012; Mushtukov et al., 2015a). The radiation pressure and consequently the transitional luminosity are defined by the geometry of the emission region, and thus by the magnetic field strength and structure. Observations of the transition between the two regimes and the study of the properties of X-ray pulsars in the two states is essential to understand the complex interplay between the ram pressure, the radiation structure and the intensity and geometry of the magnetic field.
2S 1417-624 is a transient source discovered with SAS-3 in 1978 (Apparao et al., 1980). Several outbursts from the source have been observed by BATSE and Rossi X-ray Timing Explorer (RXTE) (Finger et al., 1996; İnam et al., 2004; Gupta et al., 2018). The spin period was found to be 17.5 s, while the spin-up rate was measured to be in the order of magnitude of , and correlated with the pulsed flux. The optical counterpart has been identified as a B1 Ve star. Its orbital period of the source has been estimated by Finger et al. (1996) as 42 days. Using the optical properties of the donor star, Grindlay et al. (1984) estimated the distance of the binary system to be between 1.4 to 11.1 kpc. Recently, Gaia provided a distance measurement of kpc (68% confidence level) 111source_id=5854175187710795136 (Bailer-Jones et al., 2018). Using Chandra data, Tsygankov et al. (2017) detected a quiescence flux of erg s-1 cm-2, and modelled the Chandra spectrum with a blackbody-like function with a temperature 1.5 keV. The derived high temperature suggests that in the low luminosity state the source might still accrete matter, without entering the propeller regime, in which centrifugal forces inhibit accretion (Tsygankov et al., 2016; Güngör et al., 2017).
In this paper, we report a study of timing properties of 2S 1417-624 during the outburst in 2018 using high cadence observations in a broad range of energy obtained with several facilities. This paper is organised as follows: the details of the observations and data reduction are introduced in Section 2; the results are presented in Section 3; and finally our arguments to explain the observed phenomenology are discussed in Section 4.
2 Data analysis and results
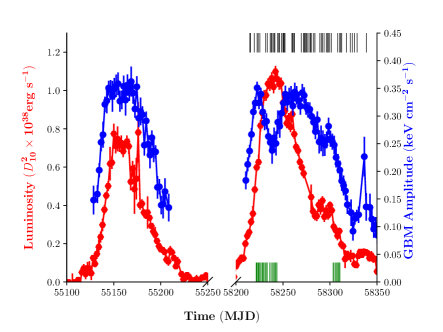
The Burst Alert Telescope (BAT) onboard the Swift observatory (Gehrels et al., 2004) is an all-sky hard X-ray monitor aimed at studying transient phenomena such as gamma ray bursts. We have used the daily lightcurve (15-50 keV) of the source provided by the BAT hard X-ray transient monitor 222https://swift.gsfc.nasa.gov/results/transients/weak/H1417-624/ as an indicator of the bolometric flux during the outbursts. Another estimate of the source flux in the hard band is provided by Fermi/Gamma-ray Burst Monitor (GBM) 333https://gammaray.nsstc.nasa.gov/gbm/science/pulsars/lightcurves/2s1417.html (Meegan et al., 2009). We have also used the spin-frequency and frequency derivative estimated by the GBM. The pulsed flux reported is in the energy band of 12-50 keV, which only includes the first and second harmonics.
We have also used dedicated observations of the source obtained by the Hard X-ray Modulation Telescope (Insight-HMXT) (Zhang et al., 2014) in the hard band and the Neutron Star Interior Composition Explorer (NICER) (Gendreau et al., 2016) in the soft band. China launched Insight-HMXT in 2017. The mission has a wide energy coverage in the energy range 1-250 keV and large effective area, especially at hard X-rays (>25 keV). There are 29 Insight-HMXT pointing observations during the outburst of 2S 1417-624, in both the rising and decay phases. Green vertical lines in the upper panel of Figure 1 show observational times of Insight-HXMT. In this paper, we have used Insight-HXMT data to estimate the bolometric flux, and the pulsed fraction at high energies (25-100 keV). This allowed a cross check of the Fermi/GBM’s results. The data analysis was performed with hxmtdas v2.01 following the recommended procedures in the user’s guide 444http://www.hxmt.org/images/soft/HXMT_User_Manual.pdf. An extensive study of the Insight-HXMT observations aimed at fully characterising the spectral-timing behaviour as a function of luminosity is in preparation (Güngör, 2020). The estimated bolometric fluxes are well correlated with the Swift/BAT count rate in the 15-50 keV range, which thus appears to be a good tracer of the bolometric flux. The conversion factor (A) was calculated by using the broad band spectra of Insight-HXMT. In fact the spectral shape of the source is relatively steady, and can be fitted as a cutoff powerlaw model, with a photon index of 0.25 and a cutoff at 16 keV. We conclude that the bolometric flux can be estimated by multiplying the observed Swift/BAT count rate by the conversion factor A .
NICER is an external payload on-board the International Space Station (Gendreau et al., 2016). In this work, we used the X-ray Timing Instrument (XTI), which operates in the range 0.2-10.0 keV. NICER performed 83 observations during the outburst of 2S 1417-624 in 2018. Among them we selected 57 observations (Table 1) with effective exposure longer than the 300 s required to obtain meaningful estimate of the source pulse profiles in each observation. Black vertical lines in the upper panel of Figure 1 represent the observational times. We followed the standard analysis procedures outlined in instruments’ documentation and used heasoft v6.25 to extract source lightcurves.
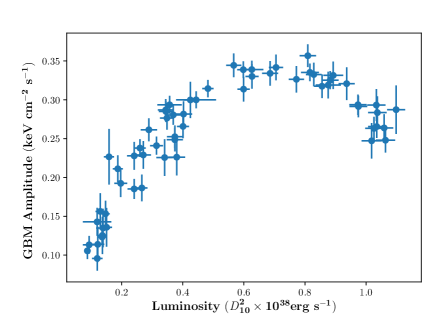
The first result was obtained through the simple comparison of the Swift/BAT and Fermi/GBM lightcurves of the 2009 and 2018 outbursts (see Figure 1). The duration of the two outbursts is similar, e.g., 350 days, but the second outburst is significantly brighter. We note the striking difference between the BAT and GBM lightcurves. While during the outburst in 2009 the pulsed flux measured by GBM is strongly correlated with the BAT rate, this is clearly not the case for the 2018 outburst (the middle panel of Figure 1). Here the pulsed flux increases with the BAT rate when the source is relatively faint (5 ). However, for a luminosity higher than 8 , the correlation breaks, and the pulsed flux starts to drop while the bolometric flux traced by BAT increases. We note that the 2009 outburst also shows some sign of the saturation of the increasing GBM pulsed flux at the some flux.
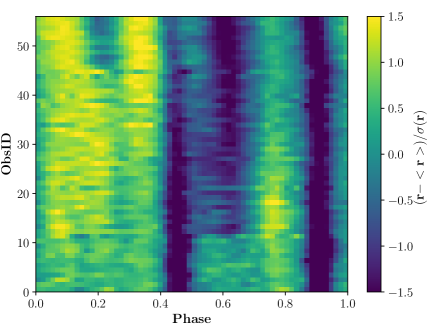
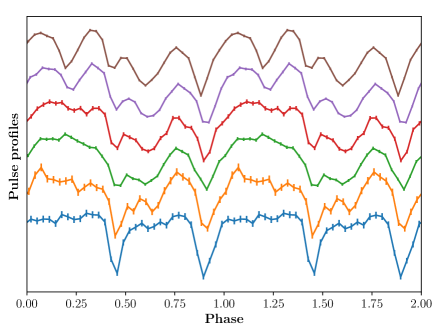
This difference can only be due to a dramatic decrease of the pulsed fraction close to the peak of the second outburst. Such a dramatic change is also expected to affect the observed pulse profile shape. To investigate that in more detail, we folded the events observed with NICER/XTI based on the spin history and the orbital ephemeris reported by the Fermi/GBM team. We aligned the pulse profiles by cross-correlating pairs of the pulse profiles sorted by flux to obtain a "phase-luminosity" matrix shown in Figure 2. Here the fluxes of the NICER observations were estimated, using the contemporary BAT data and converting the observed BAT count rate to the bolometric flux as described above.
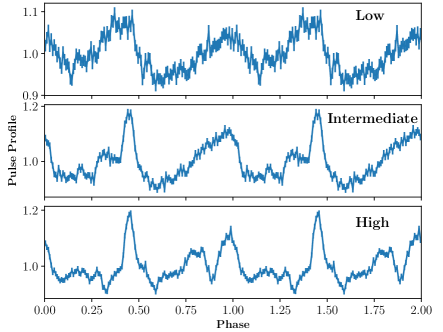
Thanks to NICER’s high cadence monitoring, the smooth evolution of the pulse profile morphology with luminosity can be observed. For a luminosity below 2.5 (obsID 10) the pulse profile at 0.2-10.0 keV shows two broad peaks. At a higher luminosity an additional peak appears, and a second transition of the morphology to even four peaks is observed when the luminosity is larger than 7 . For hard X-rays (25-100 keV) observed with Insight-HXMT/HE, the pulse profile also exhibits significant changes with luminosity. For example, in Figure 3 we show pulse profiles at low, intermediate and high states (3,7,10 ), respectively. The pulse profile has two broad peaks at the low state, and one of them evolves into a narrower structure at a higher luminosity. When the luminosity is larger than 7 , a triple-peak profile is gradually shown. We note that changes of the pulse profiles observed with Insight-HXMT correspond to the variability of the GBM pulsed flux shown in Figure 1.
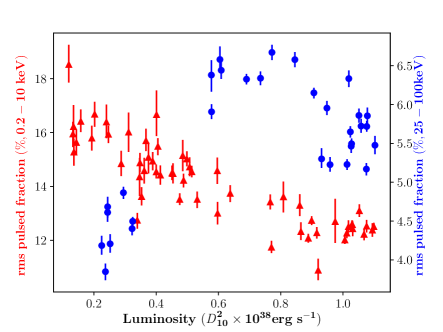
We show the rms pulsed fractions (PF) for both soft (0.2-10.0 keV) and hard (25-100 keV) X-rays observed with NICER and Insight-HXMT in Figure 1. The pulsed fraction is calculated as , where and are the Fourier coefficient, and are the corresponding uncertainties, and is the number of phase bins (Archibald et al., 2015). The pulsed fraction both in the hard (25-100 keV) and soft (0.2-10.0 keV) bands appears to change with luminosity, however, the dependence is different. In the soft band the pulsed fraction decreases with luminosity, whereas in hard X-rays it actually increases with the luminosity up to 7 , and then decreases. The pulsed fraction luminosity dependence in the hard band revealed by Insight-HXMT thus confirms the already noted drop of the pulsed flux at the peak of the second outburst based on the comparison of Fermi/GBM and BAT fluxes. It is also interesting to note that the drop of the pulsed fraction in the hard band occurred simultaneously with the transition of the soft X-ray pulse profiles from three peaked to four peaked shape.
3 Discussion
The observed evolution of the pulse profiles with luminosity in both soft (0.2-10.0 keV) and hard (25-100 keV) energy bands suggests that two regime transitions occurs in the source: the first at 2.5 (), and the second at 7 (). We note that the first transition has been reported by Gupta et al. (2018) at a similar flux level, with RXTE observations of the giant outburst in 2009. Based on the observed spectral evolution of the source, they interpreted the first observational transition as due to changes of the pulsed beam when the pulsar goes from the sub-critical to the super-critical regime. The second transition has not been reported previously. Most likely it did not occur in the previous outburst as it appears to be associated with a decrease of the pulsed fraction at high fluxes, which indeed was not been observed in the 2009 outburst. The origin of the second transition is poorly known. Here we suggest that it might be caused by the transition between the gas and radiation pressure dominated states of the inner regions of the accretion disc theoretically predicted by Shakura & Sunyaev (1973); Mushtukov et al. (2015c) and recently discovered in Swift J0243.6+6124 by Doroshenko et al. (2019). At high accretion rates the disc extends deeper into the magnetosphere of the neutron star, so that the temperature, energy release rate, and radiation pressure become sufficiently high to dramatically affect its structure within the disc. In particular, the disc thickness increases, which affects the geometry of the accretion flow and thus the emission region geometry, the beam, and eventually the observed pulse profile shape (Doroshenko et al., 2019). Differently than in the case of Swift J0243.6+6124, however, in 2S 1417-624 we were not able to detect significant changes in the power spectrum. In fact, the power spectrum in 2S 1417-624 appears to be consistent with a single power law throughout the outburst, and no breaks are observed at all. We note, however, that origin of the observed breaks in the power spectrum of Swift J0243.6+6124 is not well known, and dramatically different power spectral shapes have been reported for different sources (Mönkkönen et al., 2019). The detailed study of the properties of the radiation pressure dominated (RPD) disc is out of scope of this paper and is complicated by the relatively poor statistics. Here we would only like to note the consistency of the proposed interpretation in the framework of existing theoretical estimates for critical luminosity and the formation of an RPD disc. If our interpretation of both transitions is correct, we could constrain the distance and the magnetic field of the source, based on the following equations (Becker et al., 2012; Andersson et al., 2005; Mönkkönen et al., 2019):
| (1) |
Where is the distance, , and are the mass, the radius and the magnetic field of the source in the units of 1.4, cm and G, respectively. We assume = 1 and = 0.1 for typical parameters. The is a model-dependent dimensionless number between the magnetic radius and the Alfvn radius, usually assumed to be 0.5 (Ghosh & Lamb, 1979; Wang, 1996). Clearly, for a given , the distance () and the magnetic field () can be determined.
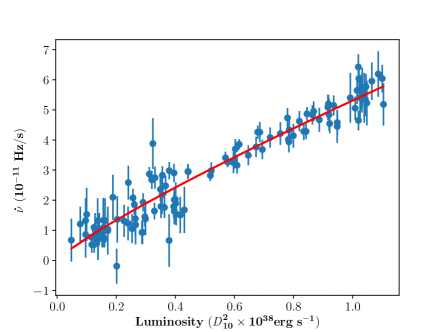
The distance and the magnetic field can also be constrained by the observed spin-up rate of the pulsar induced by the accretion torque. Using the model proposed by Ghosh & Lamb (1979) (GL model), we can estimate the spin-up rate with:
| (2) |
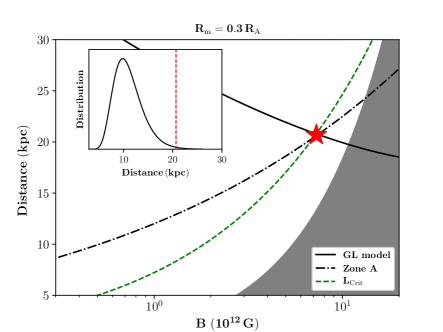
where , and are the moment of inertia, the magnetic dipole moment and the bolometric flux, respectively. is the fastness parameter, and n()1.4 for a slow rotator. We note that the model depends on the parameter . We find that 0.3 is required for the above three equations to yield a consistent solution, i.e., converge into one point in the - diagram. This implies and of G and kpc, respectively. We show the fitting of the torque model and the resulting - relation in Figure 4. We note that Doroshenko et al. (2019) obtained a similar conclusion (0.25) for Swift J0243.6+6124, using the same method.
Another estimate of the field can be obtained by the fact that the source likely continued to accrete in quiescence without switching to the propeller phase (Tsygankov et al., 2017). The accretion luminosity in this case should be larger than (Campana et al., 2002; Tsygankov et al., 2016):
| (3) |
This condition is shown as a dotted line in in Figure 4. The distance and magnetic field inferred above are consistent with the parameter space where the accretion is allowed in the quiescence state.
No cyclotron resonance scattering features (CRSFs) have been found in 2S 1417-624 with RXTE observations, and in the preliminary spectral analysis of NuSTAR as well. The high value of the estimates of the magnetic field obtained above G could explain the lack of detection as the CRSF could be expected to have energy 80 keV in this case. Unfortunately, the counting statistics does not allow put robust detection of an absorption line at these energies (Güngör, 2020). The inferred distance is 20 kpc, which is however larger than the Gaia’s estimation at a nearly 3 significance level. We note that this discrepancy mainly originates from the torque model, which does not allow a closer distance. Other torque models cannot solve this problem either because they predict a similar behaviour for slow rotators, like the case in 2S 1417-624 (see, e.g., Wang, 1987; Kluźniak & Rappaport, 2007; Shi et al., 2015). If the distance measured by Gaia is correct, a torque which is 3 times larger than GL model is required to explain the observed spin-up. This may bring a challenge for the current torque models, and other effects, e.g., the quadrupolar magnetic field, might be important. Furthermore, the is also highly uncertain (Becker et al., 2012; Mushtukov et al., 2015b), and its effect is discussed by Doroshenko et al. (2019). Nevertheless, a deep study that contains both the spin-up rate and the variability of pulse profiles provides a new measure and a self-consistent solution to understand the magnetic field of 2S 1417-624. On the other hand, independent estimate of the magnetic field, for instance by detection of a cyclotron line, would allow to verify theoretical assumptions we used above. Observing similar phenomenology in more sources is also required to ensure the robustness of these interpretations, particularly in ultraluminous X-ray sources.
Acknowledgements
This work made use of the data from the Insight-HXMT mission, a project funded by China National Space Administration (CNSA) and the Chinese Academy of Sciences (CAS). The Insight-HXMT team gratefully acknowledges the support from the National Program on Key Research and Development Project (Grant No. 2016YFA0400800) from the Minister of Science and Technology of China (MOST) and the Strategic Priority Research Program of the Chinese Academy of Sciences (Grant No. XDB23040400). The authors thank supports from the National Natural Science Foundation of China under Grants No. 11503027, 11673023, 11733009, U1838201 and U1838202. We acknowledge the use of public data and products from the Swift, NICER and Fermi data archive.
References
- Andersson et al. (2005) Andersson N., Glampedakis K., Haskell B., Watts A. L., 2005, MNRAS, 361, 1153
- Apparao et al. (1980) Apparao K. M. V., Naranan S., Kelley R. L., Bradt H. V., 1980, A&A, 89, 249
- Archibald et al. (2015) Archibald A. M., et al., 2015, ApJ, 807, 62
- Bailer-Jones et al. (2018) Bailer-Jones C. A. L., Rybizki J., Fouesneau M., Mantelet G., Andrae R., 2018, AJ, 156, 58
- Basko & Sunyaev (1975) Basko M. M., Sunyaev R. A., 1975, A&A, 42, 311
- Becker & Wolff (2007) Becker P. A., Wolff M. T., 2007, ApJ, 654, 435
- Becker et al. (2012) Becker P. A., et al., 2012, A&A, 544, A123
- Campana et al. (2002) Campana S., Stella L., Israel G. L., Moretti A., Parmar A. N., Orlandini M., 2002, ApJ, 580, 389
- Doroshenko et al. (2019) Doroshenko V., et al., 2019, submitted
- Finger et al. (1996) Finger M. H., Wilson R. B., Chakrabarty D., 1996, A&AS, 120, 209
- Gehrels et al. (2004) Gehrels N., et al., 2004, ApJ, 611, 1005
- Gendreau et al. (2016) Gendreau K. C., et al., 2016, in Space Telescopes and Instrumentation 2016: Ultraviolet to Gamma Ray. p. 99051H, doi:10.1117/12.2231304
- Ghosh & Lamb (1979) Ghosh P., Lamb F. K., 1979, ApJ, 234, 296
- Grindlay et al. (1984) Grindlay J. E., Petro L. D., McClintock J. E., 1984, ApJ, 276, 621
- Güngör (2020) Güngör C., 2020, in preparation
- Güngör et al. (2017) Güngör C., Ekşi K. Y., Göğüş E., Güver T., 2017, ApJ, 848, 13
- Gupta et al. (2018) Gupta S., Naik S., Jaisawal G. K., Epili P. R., 2018, MNRAS, 479, 5612
- İnam et al. (2004) İnam S. Ç., Baykal A., Matthew Scott D., Finger M., Swank J., 2004, MNRAS, 349, 173
- Kluźniak & Rappaport (2007) Kluźniak W., Rappaport S., 2007, ApJ, 671, 1990
- Meegan et al. (2009) Meegan C., et al., 2009, ApJ, 702, 791
- Mönkkönen et al. (2019) Mönkkönen J., Tsygankov S. S., Mushtukov A. A., Doroshenko V., Suleimanov V. F., Poutanen J., 2019, arXiv e-prints, p. arXiv:1905.05593
- Mushtukov et al. (2015a) Mushtukov A. A., Suleimanov V. F., Tsygankov S. S., Poutanen J., 2015a, MNRAS, 447, 1847
- Mushtukov et al. (2015b) Mushtukov A. A., Suleimanov V. F., Tsygankov S. S., Poutanen J., 2015b, MNRAS, 454, 2539
- Mushtukov et al. (2015c) Mushtukov A. A., Suleimanov V. F., Tsygankov S. S., Poutanen J., 2015c, MNRAS, 454, 2539
- Shakura & Sunyaev (1973) Shakura N. I., Sunyaev R. A., 1973, A&A, 24, 337
- Shi et al. (2015) Shi C.-S., Zhang S.-N., Li X.-D., 2015, ApJ, 813, 91
- Tsygankov et al. (2016) Tsygankov S. S., Lutovinov A. A., Doroshenko V., Mushtukov A. A., Suleimanov V., Poutanen J., 2016, A&A, 593, A16
- Tsygankov et al. (2017) Tsygankov S. S., Wijnands R., Lutovinov A. A., Degenaar N., Poutanen J., 2017, MNRAS, 470, 126
- Wang (1987) Wang Y. M., 1987, A&A, 183, 257
- Wang (1996) Wang Y.-M., 1996, ApJ, 465, L111
- Zhang et al. (2014) Zhang S., Lu F. J., Zhang S. N., Li T. P., 2014, in Space Telescopes and Instrumentation 2014: Ultraviolet to Gamma Ray. p. 914421, doi:10.1117/12.2054144
B
| No. | ObsID | Time | Luminosity | PF |
|---|---|---|---|---|
| (MJD) | () | (%) | ||
| 1 | 1200130177 | 58328.83 | ||
| 2 | 1200130175 | 58326.13 | ||
| 3 | 1200130173 | 58323.69 | ||
| 4 | 1200130171 | 58321.56 | ||
| 5 | 1200130169 | 58317.70 | ||
| 6 | 1200130181 | 58338.84 | ||
| 7 | 1200130167 | 58311.34 | ||
| 8 | 1200130168 | 58312.44 | ||
| 9 | 1200130166 | 58310.32 | ||
| 10 | 1200130165 | 58308.25 | ||
| 11 | 1200130104 | 58214.77 | ||
| 12 | 1200130105 | 58215.45 | ||
| 13 | 1200130149 | 58282.67 | ||
| 14 | 1200130154 | 58293.76 | ||
| 15 | 1200130156 | 58297.46 | ||
| 16 | 1200130155 | 58296.28 | ||
| 17 | 1200130157 | 58298.46 | ||
| 18 | 1200130150 | 58284.00 | ||
| 19 | 1200130160 | 58301.48 | ||
| 20 | 1200130151 | 58289.16 | ||
| 21 | 1200130158 | 58299.72 | ||
| 22 | 1200130148 | 58280.49 | ||
| 23 | 1200130152 | 58290.71 | ||
| 24 | 1200130153 | 58292.16 | ||
| 25 | 1200130147 | 58279.27 | ||
| 26 | 1200130146 | 58278.66 | ||
| 27 | 1200130145 | 58276.61 | ||
| 28 | 1200130106 | 58219.56 | ||
| 29 | 1200130144 | 58275.38 | ||
| 30 | 1200130143 | 58274.42 | ||
| 31 | 1200130142 | 58273.39 | ||
| 32 | 1200130141 | 58272.75 | ||
| 33 | 1200130140 | 58271.88 | ||
| 34 | 1200130107 | 58222.43 | ||
| 35 | 1200130139 | 58269.48 | ||
| 36 | 1200130108 | 58223.63 | ||
| 37 | 1200130135 | 58262.28 | ||
| 38 | 1200130134 | 58261.46 | ||
| 39 | 1200130110 | 58225.43 | ||
| 40 | 1200130132 | 58259.44 | ||
| 41 | 1200130130 | 58252.13 | ||
| 42 | 1200130133 | 58260.30 | ||
| 43 | 1200130129 | 58251.31 | ||
| 44 | 1200130128 | 58250.74 | ||
| 45 | 1200130127 | 58249.95 | ||
| 46 | 1200130113 | 58231.53 | ||
| 47 | 1200130126 | 58248.40 | ||
| 48 | 1200130118 | 58239.44 | ||
| 49 | 1200130115 | 58236.38 | ||
| 50 | 1200130124 | 58246.34 | ||
| 51 | 1200130114 | 58233.31 | ||
| 52 | 1200130123 | 58245.47 | ||
| 53 | 1200130122 | 58244.34 | ||
| 54 | 1200130116 | 58237.60 | ||
| 55 | 1200130117 | 58238.22 | ||
| 56 | 1200130119 | 58240.86 | ||
| 57 | 1200130120 | 58241.36 |