2018/12/17\Accepted2019/09/18
galaxies: ISM — galaxies: statistics — atlases — surveys — methods: data analysis
CO Multi-line Imaging of Nearby Galaxies (COMING) IV. Overview of the Project
Abstract
Observations of the molecular gas in galaxies are vital to understanding the evolution and star-forming histories of galaxies. However, galaxies with molecular gas maps of their whole discs having sufficient resolution to distinguish galactic structures are severely lacking. Millimeter wavelength studies at a high angular resolution across multiple lines and transitions are particularly needed, severely limiting our ability to infer the universal properties of molecular gas in galaxies. Hence, we conducted a legacy project with the 45 m telescope of the Nobeyama Radio Observatory, called the CO Multi-line Imaging of Nearby Galaxies (COMING), which simultaneously observed 147 galaxies with high far-infrared flux in \atomC12\atomO, \atomC13\atomO, and \atomC\atomO18 lines. The total molecular gas mass was derived using the standard \atomC\atomO–to–\atomH2 conversion factor and found to be positively correlated with the total stellar mass derived from the WISE band data. The fraction of the total molecular gas mass to the total stellar mass in galaxies does not depend on their Hubble types nor the existence of a galactic bar, although when galaxies in individual morphological types are investigated separately, the fraction seems to decrease with the total stellar mass in early-type galaxies and vice versa in late-type galaxies. No differences in the distribution of the total molecular gas mass, stellar mass, and the total molecular gas to stellar mass ratio was observed between barred and non-barred galaxies, which is likely the result of our sample selection criteria, in that we prioritized observing FIR bright (and thus molecular gas-rich) galaxies.
1 Introduction
How and where stars form in galaxies are clues to understanding galaxy evolution, and require information about the distribution, dynamics, and physical properties of their molecular gas content. H \emissiontypeII regions and massive stars are found in spiral arms ([Lynds (1980)]; [García Gómez & Athanassoula (1993)]; [Thilker et al. (2002)]; [Oey et al. (2003)]; [Bresolin et al. (2005)]), while only a few are found in the bar of some barred spiral galaxies ([Koopmann et al. (2001)]; [James et al. (2004)]; [Hernandez et al. (2005)]; [Erroz-Ferrer et al. (2015)]). Interacting and merging galaxies often display an abundance of star-forming regions in both their interface regions, especially compared to their spiral arms ([Koopmann et al. (2001)]; [Wang et al. (2004)]; [Torres-Flores et al. (2014)]), while little new stars form even in the spiral arms of some galaxies ([van den Bergh (1976)]; [Kennicutt & Edgar (1986)]; [Masters et al. (2010)]; [Fraser-McKelvie et al. (2016)]). These observational results indicate that star formation is not uniform both within and between different galaxies. Some questions must be answered for us to understand the causes of a variety of star formations within a galaxy and among galaxies.
Many studies have observed the distribution and dynamics of molecular gas in galaxies. Molecular gas in spiral galaxy M 51 is primarily concentrated along the two grand-design spiral arms, but also detected in the interarm regions ([García-Burillo et al. (1993)]; [Nakai et al. (1994)]). The velocity of molecular gas qualitatively changes at the spiral arm in accordance with density wave theory, and the estimated elliptical motion can explain the surface density contrast of the molecular gas between the spiral arms and the interarm regions ([Kuno & Nakai (1997)]). Flocculent galaxies also display molecular gas concentrations along their spiral arms, such as in NGC 5055 ([Kuno et al. (1997)]). On-the-fly (OTF) observations of the barred spiral galaxy M 83 showed that the CO disc has a sharp edge, while the H \emissiontypeI disc more gradually extends to larger radii ([Crosthwaite et al. (2002)]).
In the recent years, CO observations with high spatial resolution have resolved giant molecular clouds (GMCs) in galaxies. Giant molecular cloud associations (GMAs) are dominant in the spiral arms and broken up into GMCs in the interarm regions in M 51 ([Koda et al. (2009)]). In the barred spiral galaxy NGC 4303, the molecular gas in the bar has a lower star formation efficiency (SFE) than that in the spiral arms, where the SFE is the star formation rate (SFR) divided by the molecular gas mass ([Momose et al. (2010)]). The SFE depends on the environment at sub-kpc scales, and increases with the surface density of the molecular gas ([Momose et al. (2013)]). Meanwhile, in the local spiral galaxy M 33, the molecular gas fractions are loosely correlated with the neutral gas fraction observed at the GMC scales, with particular variations in the inner disc ([Tosaki et al. (2011)]). A CARMA (Combined Array for Research in Millimeter Astronomy interferometer) and Nobeyama Nearby galaxies (CANON) survey resolved approximately 200 GMCs in the inner discs of five galaxies and revealed that they are similar to those in the Milky Way ([Donovan Meyer et al. (2013)]). PAWS (Plateau de Bure Interferometer Arcsecond Whirlpool Survey, [Schinnerer et al. (2013)]) observed M 51 at resolution and found that the dynamical environment of the GMCs significantly influences their star-forming capability ([Meidt et al. (2013)]), and that feedback from massive stars affects the dependency of the GMC properties on the environment ([Colombo et al. (2014)]). Observations of M 100 with Atacama Large Millimeter/Submillimeter Array (ALMA) revealed that the GMA properties depend on the environment: GMAs are compact in the circumnuclear region, but diffuse in interarm regions, and their velocity dispersions are higher in the circumnuclear region and the bar than the other regions ([Pan & Kuno (2017)]).
A few notable systematic surveys have mapped gas across the entire surface of galaxies at a sub-kpc resolution. Berkeley-Illinois-Maryland Association millimeter interferometer Survey of Nearby Galaxies, also known as BIMA SONG, imaged 44 nearby galaxies ([Helfer et al. (2003)]) via interferometry and single-dish observations. Meanwhile, the Nobeyama CO Atlas of nearby galaxies ([Kuno et al. (2007)]) mapped 40 galaxies with a single-dish telescope. These observations revealed higher molecular gas concentrations toward the galactic center in barred spiral galaxies compared to unbarred spirals ([Sheth et al. (2005)]; [Kuno et al. (2007)]). Some galaxies located near the center of the Virgo cluster have revealed a higher fraction of molecular gas to the total neutral gas, including H \emissiontypeI gas, which is interpreted as ram pressure stripping of H \emissiontypeI gas or induced molecular gas formation caused by a higher external pressure in cluster environments ([Nakanishi et al. (2006)]). A total of 28 Virgo cluster spirals were also mapped with the Five College Radio Astronomy Observatory (FCRAO) 14 m telescope ([Chung et al. (2009b)]); however, some galaxies overlap with one another. The total number of mapped galaxies in these three surveys was 74.
Many mapping observations of molecular gas, whose sample size numbers were 10 or fewer, and surveys with interferometers covering only the central regions have also been made [[Sakamoto et al. (1999)]; [Sofue et al. (2003)]; CARMA STING (Survey Toward Infrared-bright Nearby Galaxies), [Rahman et al. (2012)]]. However, combining such data is not necessarily suitable for comparing many galaxies because spatial resolutions and instrument sensitivity can wildly differ between surveys. In addition, observations with interferometers alone miss extended emission (i.e., are “resolved out”); hence, there are concerns that such observations underestimate the total molecular gas mass of the target galaxies. If mapping does not extend across the entirety of the galactic disc, then correct information on the molecular gas and star formation in outer regions, particularly in interacting galaxies, are impossible to obtain.
Surveys targeting higher- transitions have also been conducted, although they carry added caveats for estimating the total molecular gas masses of the target galaxies. HERACLES (HEterodyne Receiver Array CO Line Extragalactic Survey, [Leroy et al. (2009)]) provided sensitive images of 48 nearby galaxies in \atomC12\atomO . The relation between the surface density and the velocity dispersion of GMCs in nearby galaxies was reported ([Sun et al. (2018)]) based on the recent very high-resolution observations with ALMA in \atomC12\atomO [PHANGS-ALMA (Physics at High Angular resolution in Nearby Galaxies with ALMA), A. K., Leroy, et al. (in preparation)]. JCMT Nearby Galaxies Legacy Survey (NGLS, [Wilson et al. (2012)]) mapped 155 galaxies in \atomC12\atomO . Such high transition data are particularly useful for excitation analysis combined with . However, the estimation of the molecular gas mass assuming a constant intensity ratio has a considerable uncertainty (e.g., ) because the ratio is not constant within a galaxy ([Sakamoto et al. (1997)]; [Koda et al. (2012)]; [Leroy et al. (2013)]).
Several single-point observations have provided key insights into the relation between molecular gas content and galaxy morphology and evolution. The FCRAO survey of 300 galaxies reported that the molecular gas distribution against the optical galaxy size depends on morphology ([Young et al. (1995)]). Komugi et al. (2008) observed 68 galaxies. They showed larger central concentrations of molecular gas in earlier-type galaxies and the impact of the inner bulge on the gas concentrations. Large CO surveys have recently provided clues of galaxy evolution by comparison with stellar mass information. COLD GASS [CO Legacy Data base for the GASS (GALEX Arecibo SDSS Survey)] observed galaxies and showed that the relation between molecular gas fraction and stellar mass strongly depends on color (Saintonge et al. (2011)). The Herschel Reference Survey observed 59 galaxies (Boselli et al. (2014a)) and illustrated that the molecular gas mass fraction only slightly depends on morphology, but strongly depends on the stellar mass and the specific SFR (Boselli, et al. (2014b)). The fraction increases with the redshift in the range of (Daddi et al. (2010); Popping et al. (2012); Saintonge et al. (2013); Popping et al. (2015); Dessauges-Zavadsky et al. (2017)), and this evolution depends on the stellar mass (Dessauges-Zavadsky et al. (2015); Morokuma-Matsui & Baba (2015)).
We have limited spatially resolved information on the physical conditions of molecular gas (e.g., whether the density and the temperature of molecular gas in GMCs differ between the arm, interarm, and bar regions of disc galaxies). Although the most general tracer of molecular gas in galaxies is \atomC12\atomO , we cannot estimate the molecular gas density and the temperature from a single transition. Molecular lines are excited under various physical conditions; hence, we have to observe multiple lines to constrain the physical conditions of molecular gas. In the case of multiple \atomC12\atomO line observations, we have to carefully compare the data because the line frequencies are very different from each other, and as a result, different lines are measured with different telescopes or taken at different spatial resolutions. Although we can observe \atomC13\atomO or \atomC\atomO18 lines with the same telescope at nearly the same spatial resolution, these lines are very weak, and mapping the whole disc is a time-consuming task [Watanabe et al. (2011); CARMA STING, Cao et al. (2017); EMPIRE (EMIR Multiline Probe of the ISM Regulating Galaxy Evolution) survey, Cormier et al. (2018)]. Such efforts have revealed the properties of molecular gas in several local galaxies. In the bar ends of NGC 3627, the \atomC12\atomO and \atomC13\atomO measurements suggest a very high molecular gas density, which results in a very high SFE (Watanabe et al. (2011)). In contrast, the \atomC12\atomO / \atomC13\atomO intensity ratios do not clearly correlate with the SFR (Cao et al. (2017)). Despite such efforts, a great deal of progress must still be made on understanding how the properties of molecular gas varies both within and between galaxies.
High-resolution and high-sensitivity mapping capabilities have recently expanded targets from local spiral galaxies to early-type or low- galaxies. The CARMA ATLAS3D molecular gas imaging survey observed 30 early-type galaxies and showed various \atomC\atomO morphologies and a wide distribution of \atomC13\atomO / \atomC12\atomO ratios (Alatalo et al. \yearciteAlatalo+2013, \yearciteAlatalo+2015). Meanwhile, the Evolution of Molecular Gas in Normal Galaxies (EGNoG) survey imaged 31 star-forming galaxies from to and illustrated molecular gas depletion times and fractions (Bauermeister et al. (2013)). The Extragalactic Database for Galaxy Evolution (EDGE) – Calar Alto Legacy Integral Field Area (CALIFA) survey (Bolatto et al. (2017)) observed 126 relatively distant galaxies and presented a fairly constant molecular-to-stellar mass ratio across spiral galaxies and an approximately linear relation between the resolved surface densities of the SFR and molecular gas. Meanwhile, the Valparaíso ALMA Line Emission Survey (VALES) observed 67 galaxies up to with ALMA and found that the molecular gas distribution is, on average, times more compact than the optical size (Villanueva et al. (2017)).
We conducted the project CO Multi-line Imaging of Nearby Galaxies (COMING), which is one of the Nobeyama Radio Observatory (NRO) legacy projects, using the 45 m telescope to quantitatively improve our understanding of the spatially resolved, galaxy-scale distribution of molecular gas. The OTF observations with the multi-beam receiver, FOur-beam REceiver System on the 45 m Telescope (FOREST) (Minamidani et al. (2016)) enabled us to make efficient maps toward a large number of galaxies. We simultaneously observed the \atomC12\atomO, \atomC13\atomO, and \atomC\atomO18 lines using the wide intermediate frequency (IF) band of FOREST. Some preliminary results for individual galaxies have already been published (Muraoka et al. (2016); Hatakeyama et al. (2017); Yajima et al. (2019)), and this paper presents a project overview. Sections 2 and 3 present the sample selection and observations, respectively. Sections 4 and 5 show the data reduction, analysis software development, data analysis, and archival data, respectively. Section 6 presents the results and discussion. Finally, section 7 summarizes the project overview.
2 Sample
The initial sample selection consisted of 344 far-infrared (FIR) bright galaxies from the “Nearby Galaxies Catalog” (Tully (1988)). The number of the CO images of galaxies was much smaller than that in optical or infrared regimes; thus, we gave priority to galaxies expected to be bright in CO, although the completeness of the samples is important in understanding the galaxy evolution. Accordingly, we selected candidates biased to the FIR flux that is known to be well correlated with the CO flux (Young & Scoville (1991)) from the Nearby Galaxies Catalog. We used the selection criteria of flux in “IRAS catalogue of Point Sources” (Helou & Walker (1988)) or the flux in “AKARI/FIS All-Sky Survey Point Source Catalogues” (Yamamura et al. (2010)). We checked that all sources common to both samples satisfied both criteria. Elliptical galaxies were removed from our sample candidates even if they satisfied the criteria because CO emission was not expected to be detected within a reasonable observing time. M 31 and M 33 were also eliminated in spite of satisfying the criteria because both galaxies would require excessively large maps that demanding a long observing time.
Next, we selected galaxies from the abovementioned parent sample, most of which have a large extent in optical images, and have not yet been observed using the 45 m telescope, thereby resulting in 238 galaxies. The sample included galaxies previously observed with the 45 m telescope because we intended to compare our new OTF maps with the previous ones (Muraoka et al. (2016)). In addition, some previous observations were less sensitive. This selection was done to increase the number of galaxy CO maps available within a limited observation time. We resolved the galactic structure in detail by assigning a higher priority to galaxies with (1) a large optical diameter (), (2) a lower inclination angle when is similar, and (3) with former observational works having a higher spatial resolution, such as CANON (Donovan Meyer et al. (2013)) (we added Mrk 33) or CARMA STING (Rahman et al. (2012)). We also included pair galaxies, where only one of the pair satisfies the criteria because the molecular gas in the interacting systems may spread over a wide area, including intergalactic regions (Kaneko et al. (2013)). We assigned the priority code (A, B, and C) to the 238 selected galaxies according to the apparent galaxy size with or without previous CO (interferometric) data and interest of individual members of the survey team. Practical constraints, such as available observing time and weather, limited the actual number of the observed galaxies to 147.
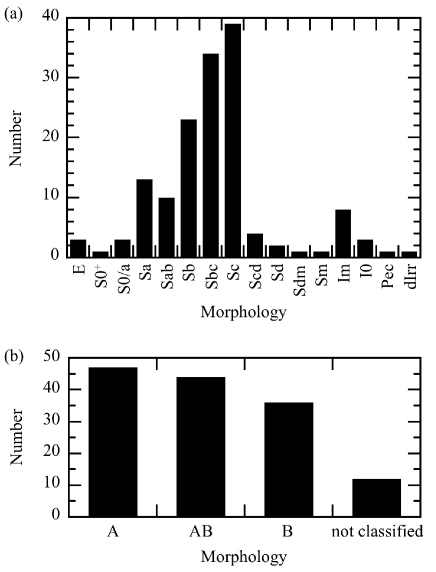
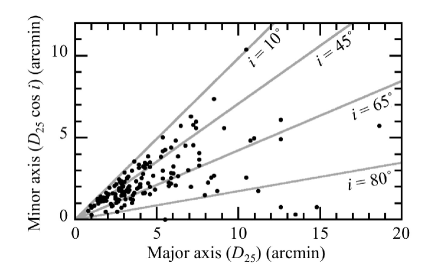
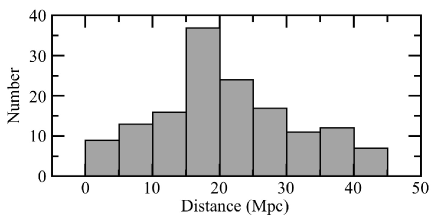
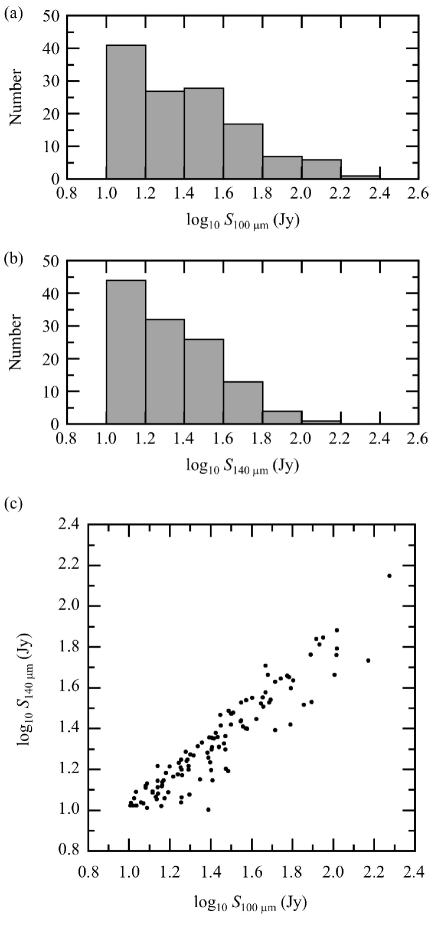
Table 2 and figures 1 – 4 show the morphology, optical diameter, distance, position angle (PA) of the major axis, inclination (i) of the galactic disc, and FIR fluxes of the 147 observed galaxies. We adopted the distance of each galaxy from the redshift-independent distances in the NASA/IPAC Extragalactic Database (NED)111http://ned.ipac.caltech.edu. prioritizing the following: (1) distance with the minimum error of the distance modulus taken after 2013; (2) the same as (1) if no matches, but the latest data taken after 2003; and (3) the same as (2) if no matches, but taken before 2003. The distances of the galaxies identified as members of the Virgo cluster are assumed to be the same value of (Mei et al. (2007)). The distances of the interacting galaxies are considered similar to each other. We adopted PA and i that were measured kinematically and determined at the same time, where possible. When no such data exist, we adopted the pair of PA and i measured by fitting brightness distribution by an ellipse or PA and i measured individually. PA is the receding side of the semi-major axis, unless no kinematical information exists. PA is expressed within , where corresponds to the north, and the angle is measured counterclockwise. Our kinematical analysis has shown that PA and i of NGC 2967 are quite different from the data estimated in previous works (Salak et al. (2019)); however, we do not adopt the latest values herein.
The observed galaxies have a bias toward Sb to Sc types with few early- and late-type galaxies because constraints on the observing conditions restricted our observation of the entire original sample. The presence or absence of a bar classified as SA, SAB, or SB is distributed throughout the sample. The observation ranking system described in subsection 3.2 particularly selected smaller galaxies because the weather conditions in the last two observation seasons were poor.
lp1cmp2.6cmp0.5cmp0.5cmcp0.5cmcccp0.4cmcc
Galaxy parameters of the targets.
Galaxy PGC Morphology Distance PA Notes
(\timeform’) (Mpc) (\timeformD) (\timeformD) (Jy) (Jy)
(1) (2) (3) (4) (5) (6) (7) (8) (9) (10) (11) (12) (13)
\endfirstheadGalaxy PGC Morphology Distance PA Notes
(\timeform’) (Mpc) (\timeformD) (\timeformD) (Jy) (Jy)
(1) (2) (3) (4) (5) (6) (7) (8) (9) (10) (11) (12) (13)
\endhead\endfoot
Notes.
Column (1): Galaxy name.
Indented pairs are observed as a pair galaxy listed just above the line.
Two galaxy names are listed with “/” if no commonly used name is provided.
Column (2): PGC number.
Column (3): Morphology.
Column (4): Optical diameter () in arcmin.
Column (5): Reference of morphology and . No remark means RC3 (de Vaucouleurs et al. (1991)).
(1) Huchra et al. (1999) (morphology).
(2) NED (morphology).
(3) Nilson (1973) ().
(4) Trentham & Hodgkin (2002) (morphology).
Column (6): Distance of galaxies in Mpc.
The distances of the galaxies identified as members of the Virgo cluster are adopted as the same value of .
The distances of the interacting galaxies are considered similar to each other.
Column (7): Reference of distance.
(1) Bottinelli et al. (1984a).
(2) Bottinelli et al. (1984b).
(3) Caso et al. (2015).
(4) Dhungana et al. (2016).
(5) Fiorentino et al. (2013).
(6) Kim et al. (2012).
(7) Mathewson et al. (1992).
(8) Mei et al. (2007).
(9) NED (Hubble flow distance of double galaxy).
(10) Pejcha, & Prieto (2015).
(11) Poznanski et al. (2009).
(12) Rodríguez et al. (2014).
(13) Shappee et al. (2016).
(14) Springob et al. (2009).
(15) Terry et al. (2002).
(16) Theureau et al. (2007).
(17) Tully et al. (2013).
(18) Tully et al. (2009).
(19) Tully (1988).
(20) Weyant et al. (2014).
: No data. Then the distance of NGC 2992 is adopted.
Column (8): Position angle (PA) of the major axis of the galaxies in \timeform-180D to \timeform+180D.
The angle is the PA of the receding side if we can judge.
The north is \timeform0D, and a positive value corresponds to the eastern side.
Column (9): Inclination of galaxy discs.
The face-on disc is \timeform0D.
This value corresponds to the angle of , except for the galaxy discs.
Here, and are the semi-major and -minor axes of the galaxy, respectively.
Column (10): Reference and notes of position angle (PA) and inclination ().
: We refer the value shown in NED.
Column (11): Reference for judging the receding side of the PA.
: Judging the receding side from our velocity field map.
: The ambiguity of for the PA is unresolved because of missing kinematical information.
: No kinematical information.
According to our velocity field and a following paper (Salak et al. (2019)), the PA and seem to be incorrect at least for our mapping area.
(1) Alatalo et al. (2013).
(2) Antonio García-Barreto & Rosado (2001).
(3) Arnold et al. (2014).
(4) Ball et al. (1986).
(5) Bolatto et al. (2017).
(6) Bravo-Alfaro et al. (2004).
(7) Broeils & van Woerden (1994).
(8) Chung et al. (2009a).
(9) Daigle et al. (2006).
(10) de Blok et al. (2008).
(11) de Vaucouleurs et al. (1991).
(12) Díaz et al. (2003).
(13) Elmegreen et al. (1995).
(14) Epinat et al. (2008a).
(15) Epinat et al. (2008b).
(16) Friedrich et al. (2010).
(17) Fuentes-Carrera et al. (2004).
(18) García-Burillo et al. (1997).
(19) Garrido et al. (2002).
(20) Geha et al. (2005).
(21) Haan et al. (2008).
(22) Hota & Saikia (2006).
(23) Hunt et al. (2008).
(24) Hunter et al. (2012).
(25) Irwin & Sofue (1996).
(26) Jarrett et al. (2003).
(27) Kenney & Young (1988).
(28) King & Irwin (1997).
(29) Koda et al. (2002).
(30) Kregel & Sancisi (2001).
(31) Kuno et al. (2007).
(32) Kuzio de Naray et al. (2012).
(33) Laine & Gottesman (1998).
(34) Lelli et al. (2014).
(35) Li et al. (1993).
(36) Lindt-Krieg et al. (2008).
(37) Mühle et al. (2005).
(38) Mundell et al. (1995).
(39) Nilson (1973).
(40) Ponomareva et al. (2016).
(41) Regan et al. (1996).
(42) Richards et al. (2016).
(43) Riffel et al. (2015).
(44) Rodriguez-Rico et al. (2004).
(45) Rupen (1991).
(46) Salo et al. (2015).
(47) Schmitt et al. (1997).
(48) Sil’chenko & Afanasiev (2006).
(49) Smith & Wallin (1992).
(50) Springob et al. (2007).
(51) Stil et al. (2005).
(52) Stil & Israel (2002).
(53) Tamburro et al. (2008).
(54) Toloba et al. (2014).
(55) Two Micron All Sky Survey Team (2003).
(56) Ulvestad & Wilson (1984).
(57) van Driel & Buta (1991).
(58) van Eymeren et al. (2011).
(59) Viallefond et al. (1980).
(60) Walter et al. (2008).
(61) Walter et al. (2004).
(62) Walter et al. (2002).
(63) Young et al. (2006).
(64) Zschaechner et al. (2015).
Column (12), (13): FIR flux in Jy for IRAS and AKARI .
: Unresolved in FIR observation.
\endlastfoot isolated galaxies
IC 10 1305 IBm 6.31 0.74 17 132.0 52 26 24 71.25 33.0
NGC 150 2052 SB(rs)b? 3.89 24.20 17 108.9 59.3 46 17.85 16.3
NGC 157 2081 SAB(rs)bc 4.17 12.10 17 -136.0 48.0 46 37.73 25.2
NGC 278 3051 SAB(rs)b 2.09 15.9 2 52 21 14 45.19 32.3
NGC 337 3572 SB(s)d 2.88 18.90 17 119.6 44.5 46 17.34 15.0
NGC 470 4777 SA(rs)b 2.82 41.30 17 155.4 58.0 46 12.24 13.5
NGC 520 5193 pec 4.47 8.02 1 130.0 60 26 48.40 33.8
NGC 613 5849 SB(rs)bc 5.50 26.4 18 -54.1 38.8 49.14 34.9
NGC 628 5974 SA(s)c 10.47 9.020 4 20 7 53 60 11.97
NGC 660 6318 SB(s)a pec 8.32 13.60 17 -138.5 72 26 103.74 76.4
NGC 701 6826 SB(rs)c 2.45 20.80 17 44.7 58.6 46 13.77 14.0
NGC 891 9031 SA(s)b? edge-on 13.49 9.12 17 -157.0 88.6 45 147.93 54.2
NGC 1022 10010 (R’)SB(s)a 2.40 18.5 19 85.0 30 26 27.44 20.6
NGC 1055 10208 SBb? edge-on 7.59 20.30 17 102.5 61 26 60.44 45.0
NGC 1084 10464 SA(s)c 3.24 20.90 17 -141.6 57.2 46 55.04 44.5
NGC 1087 10496 SAB(rs)c 3.72 14.90 17 1.4 50.5 46 29.55 23.2
NGC 1156 11329 IB(s)m 3.31 7.6 6 -88.12 52.11 58 10.56
NGC 1241 11887 SB(rs)b 2.82 61.40 17 -45 52 26 12 10.21 10.9
UGC 2765 13121 S0/a 3.98 2 19.5 16 150.0 57 26 12.05 13.2
NGC 1482 14084 SA0+ pec edge-on 2.45 19.6 19 -61.5 55.2 46 46.52 37.9
UGCA 86 14241 Im? 0.79 2.98 17 -73 45 51 11.90
IC 356 14508 SA(s)ab pec 5.25 21.6 18 105.0 43 26 24.44 10.1
NGC 1530 15018 SB(rs)b 4.57 20.40 17 -172 45 41 24.17 19.2
NGC 1569 15345 IBm 3.63 3.25 17 112 63 37, 52 51.71 24.7
NGC 2146 18797 SB(s)ab pec 6.03 27.7 15 -43.5 62 26 187.36 140.9
NGC 2273 19688 SB(r)a? 3.24 31.6 15 51 53 57 10.27
NGC 2339 20222 SAB(rs)bc 2.69 36.60 17 174 44 50 32.24 30.3
NGC 2268 20458 SAB(r)bc 3.24 30.60 17 -112 58 50 7 14.53 13.8
NGC 2276 21039 SAB(rs)c 2.82 36.8 19 -113 48 15 29.50 19.9
NGC 2633 24723 SB(s)b 2.45 29.10 17 -176.3 50.1 46 27.01 22.9
NGC 2681 24961 (R’)SAB0/a(rs) 3.63 16.40 17 116.6 11.2 46 11.37
NGC 2742 25640 SA(s)c? 3.02 27.8 12 -93.5 59.9 46 10.57 11.5
NGC 2715 25676 SAB(rs)c 4.90 17.50 17 -159.1 67.8 46 11.0
NGC 2775 25861 SA(r)ab 4.27 17.0 19 163.5 35.4 46 14 10.47 10.6
NGC 2748 26018 SAbc 3.02 19.80 17 -138.8 72.8 46 19.46 15.8
NGC 2782 26034 SAB(rs)a pec 3.47 15.7 16 -105 30 23 13.81 12.1
NGC 2841 26512 SA(r)b? 8.13 14.60 17 152.6 73.7 10 14.00
NGC 2903 27077 SAB(rs)bc 12.59 9.46 17 -155 67 31 104.08 62.1
NGC 2967 27723 SA(s)c 3.02 22.2 2 64.0 16.5 46 15.08 15.3
NGC 2976 28120 SAc pec 5.89 3.63 17 -25.5 64.5 10 29.71 16.0
NGC 2985 28316 (R’)SA(rs)ab 4.57 22.4 19 -3 40 19 19.49 16.5
NGC 3034 28655 I0 edge-on 11.22 3.53 17 68 81 44 1144.97 1053
NGC 3079 29050 SB(s)c edge-on 7.94 20.60 17 169 79 29 88.95 70.2
NGC 3077 29146 I0 pec 5.37 3.81 17 63.8 38.9 46 62 25.11 15.8
NGC 3166 29814 SAB0/a(rs) 4.79 22.0 19 -100.4 55.7 46 48 13.48 11.7
NGC 3169 29855 SA(s)a pec 4.37 23.20 17 -123.7 39.0 46 19.94 18.8
NGC 3177 30010 SA(rs)b 1.45 24.1 16 -42.5 28.8 46 18.01 15.8
NGC 3147 30019 SA(rs)bc 3.89 39.30 17 142.79 35.19 58 24.63 22.8
NGC 3198 30197 SB(rs)c 8.51 13.40 17 -145.0 71.5 10 14.84 11.5
Mrk 33 31141 Im pec? 1.00 24.9 19 124.0 42.6 46 6
NGC 3310 31650 SAB(r)bc pec 3.09 11.6 1 150 56 30 41.76 28.1
NGC 3338 31883 SA(s)c 5.89 23.70 17 97.1 60.9 46 10.11
NGC 3344 31968 (R)SAB(r)bc 7.08 9.82 17 -37.3 27.0 46 20.72
NGC 3351 32007 SB(r)b 7.41 10.7 12 -168 41 53 60 35.30 27.7
NGC 3367 32178 SB(rs)c 2.51 30.8 1 51 30 2 13.01 12.4
NGC 3359 32183 SB(rs)c 7.24 20.80 17 -8 51 4 14.32 10.5
NGC 3368 32192 SAB(rs)ab 7.59 9.900 20 169.0 57.5 21 27.44 20.5
NGC 3370 32207 SA(s)c 3.16 25.60 5 -38.1 55.1 46 40 12.0
NGC 3437 32648 SAB(rs)c? 2.51 25.10 17 -61.5 65.9 46 20.64 18.7
NGC 3471 33074 Sa 1.74 24.2 18 10.5 48.6 46 12.23 10.3
NGC 3521 33550 SAB(rs)bc 10.96 14.20 17 -19 63 31 85.05 65.2
NGC 3556 34030 SB(s)cd edge-on 8.71 10.00 17 -102.2 78.3 28 61.31 26.4
NGC 3583 34232 SB(s)b 2.82 27.9 16 131.3 38.6 46 17.98 17.8
NGC 3627 34695 SAB(s)b 9.12 9.04 17 176 52 31 105.60
NGC 3628 34697 Sb pec edge-on 14.79 10.30 17 102.4 87 25 103.12 57.8
NGC 3655 34935 SA(s)c? 1.55 38.40 17 -100.3 23.5 46 19.10 17.5
NGC 3672 35088 SA(s)c 4.17 27.40 17 7.8 67.2 46 22.70 21.5
NGC 3675 35164 SA(s)b 5.89 19.60 17 176 67.8 42 35.20 33.8
NGC 3686 35268 SB(s)bc 3.24 15.9 18 19.5 35.2 46 11.72 10.8
NGC 3810 36243 SA(rs)c 4.27 16.40 17 -154.3 42.2 46 31.40 26.3
NGC 3813 36266 SA(rs)b? 2.24 23.30 17 83.1 68.2 46 20.3
NGC 3888 36789 SAB(rs)c 1.74 39.7 16 121.2 41.8 46 11.39 11.0
NGC 3893 36875 SAB(rs)c? 4.47 15.7 14 -13 30 19 35.07 27.3
NGC 3938 37229 SA(s)c 5.37 17.9 11 -154.0 20.9 46 22.18 14.2
NGC 3949 37290 SA(s)bc? 2.88 19.10 17 -58.2 52.9 46 25.23 19.9
UGC 6973 37719 Sab? edge-on 2.63 23.4 18 39.0 64.8 46 40.0
NGC 4027 37773 SB(s)dm 3.16 19.6 10 -9.2 35.9 46 28.04 26.2
NGC 4030 37845 SA(s)bc 4.17 29.90 17 29.6 39.0 46 46.34 51.3
NGC 4041 37999 SA(rs)bc? 2.69 30.2 2 -138.7 23.4 46 31.49 29.8
NGC 4045 38031 SAB(r)a 2.69 33.70 17 -92.1 48.4 46 13.80 16.6
NGC 4085 38283 SAB(s)c? 2.82 20.80 17 -104.7 75.0 46 14.74 14.1
NGC 4088 38302 SAB(rs)bc 5.75 14.50 17 -126.8 68.9 46 51.72 42.8
NGC 4214 39225 IAB(s)m 8.51 2.93 17 65 30 34 25.47 14.1
NGC 4258 39600 SAB(s)bc 18.62 7.31 17 -29 72 40 23.8
NGC 4303 40001 SAB(rs)bc 6.46 16.5 8 -36.4 27.0 46 61.69 39.8
NGC 4433 40894 SAB(s)ab 2.19 44.10 17 5 64 11 25.88 22.6
NGC 4527 41789 SAB(s)bc 6.17 16.5 8 69.5 70 26 63.52 43.5
NGC 4536 41823 SAB(rs)bc 7.59 16.5 8 -54.5 64.2 46 44.98 35.9
NGC 4559 42002 SAB(rs)cd 10.72 7.31 17 -36.8 63.1 46 14 18.01 11.6
NGC 4579 42168 SAB(rs)b 5.89 16.5 8 92.1 41.7 46 17.91 11.0
NGC 4605 42408 SB(s)c pec 5.75 5.55 17 -67 69 40 30.53 15.6
NGC 4602 42476 SAB(rs)bc 3.39 37.80 17 100.7 67.9 46 13.63 11.4
NGC 4632 42689 SAc 3.09 14.40 17 60.5 65.9 46 10.84 10.6
NGC 4666 42975 SABc? 4.57 14.70 13 -135 70 61 77.14 58.2
NGC 4750 43426 (R)SA(rs)ab 2.04 26.1 19 -50.0 40 26 14.48 13.3
NGC 4753 43671 I0 6.03 24.5 3 82.2 57.2 46 1 10.3
NGC 4818 44191 SAB(rs)ab pec? 4.27 11.90 17 -175.5 67.2 46 26.55 24.1
NGC 5005 45749 SAB(rs)bc 5.75 18.00 17 67.0 66.7 46 59.38 45.7
NGC 5055 46153 SA(rs)bc 12.59 9.04 17 98 61 31 101.24 46.2
NGC 5248 48130 SAB(rs)bc 6.17 13.00 17 103.9 38.6 46 43.97 33.6
NGC 5364 49555 SA(rs)bc pec 6.76 18.2 16 -144.4 47.9 46 11.42
NGC 5480 50312 SA(s)c? 1.74 30.6 16 37.2 37.5 46 10.13 10.6
NGC 5678 51932 SAB(rs)b 3.31 35.70 17 -177.5 56.9 46 25.42 22.8
NGC 5665 51953 SAB(rs)c pec? 1.91 18.20 17 154.7 51.7 46 13.03 12.3
NGC 5676 51978 SA(rs)bc 3.98 34.70 17 -131.9 59.8 46 30.61 30.8
NGC 5713 52412 SAB(rs)bc pec 2.75 19.5 7 -157 33 9 37.22 34.7
NGC 5792 53499 SB(rs)b 6.92 26.40 17 -98.5 64 26 19.30 17.8
NGC 5907 54470 SA(s)c? edge-on 12.59 17.10 17 -24 86.5 18 36.01 25.8
NGC 6015 56219 SA(s)cd 5.37 19.00 17 -150 62 15 10.80 12.3
NGC 6503 60921 SA(s)cd 7.08 6.25 17 -60.2 73.5 32 25.39 20.5
NGC 6574 61536 SAB(rs)bc? 1.41 41.90 17 165 45 36 27.82 29.4
NGC 6643 61742 SA(rs)c 3.80 21.30 17 37 60 19 31.78 29.9
NGC 6764 62806 SB(s)bc 2.29 23.70 17 75 68 55 22 11.90
NGC 6951 65086 SAB(rs)bc 3.89 23.30 20 135 30 31 37.14 25.3
NGC 7331 69327 SA(s)b 10.47 13.90 17 167.7 75.8 82.19 69.2
NGC 7448 70213 SA(rs)bc 2.69 28.20 17 -10.6 62.9 46 18.14 14.9
NGC 7479 70419 SB(s)c 4.07 36.80 17 -158 51 33 24.93 17.2
NGC 7541 70795 SB(rs)bc? pec 3.47 32.10 17 99.0 72.8 46 39.93 35.6
NGC 7625 71133 SA(rs)a pec 1.58 23.0 19 -151.4 37.4 35 18.85 19.4
NGC 7721 72001 SA(s)c 3.55 28.00 20 -164.2 69.8 46 12.03 12.9
NGC 7798 73163 SBc 1.38 1 32.6 19 70.5 31.9 46 10.03
interacting galaxies
NGC 772 / NGC 770 32.2 9
NGC 770 7517 E3? 1.17 32.2 9 -165 44 11 20
NGC 772 7525 SA(s)b 7.24 32.2 9 -45.0 37 26 20 21.66 20.7
NGC 2207 / IC 2163 38.1 9
NGC 2207 18749 SAB(rs)bc pec 4.27 38.1 9 -40 35 13 24.38 18.1
IC 2163 18751 SB(rs)c pec 3.02 38.1 9 65 40 13
Arp 283 29.6 9
NGC 2798 26232 SB(s)a pec 2.57 29.6 9 158.7 60.7 46 9 29.13 21.3
NGC 2799 26238 SB(s)m? 1.86 29.6 9 125 75 11 9 29.13 21.3
Arp 245 29.0
NGC 2992 27982 Sa pec 3.55 29.0 16 -157.5 65 26 16 14.44 13.2
NGC 2993 27991 Sa pec 1.35 29.0 -20.0 20 55 15.51 12.3
Arp 094 19.6 9
NGC 3226 30440 E2? pec 3.16 19.6 9 25.0 37 26
NGC 3227 30445 SAB(s)a pec 5.37 19.6 9 158 56 38 17.46 17.2
NGC 4298 / NGC 4302 16.5 8
NGC 4298 39950 SA(rs)c 3.24 16.5 8 -48.9 54.8 46 8 19.71 12.0
NGC 4302 39974 Sc? edge-on 5.50 16.5 8 180 90 64 12.8
NGC 4383 / UGC 7504 16.5 8
UGC 7504 40506 dIrr 1.00 3, 4 16.5 8 168 73 39 54
NGC 4383 40516 Sa? pec 1.95 16.5 8 -171.7 44.4 46 8 12.40
Arp 269 4.60 9
NGC 4485 41326 IB(s)m pec 2.29 4.60 9 -14.3 44.6 46 59
NGC 4490 41333 SB(s)d pec 6.31 4.60 9 115.0 65 26 77.96 34.1
VV 219 16.5 8
NGC 4567 42064 SA(rs)bc 2.95 16.5 8 80 46 27 47.59 46.2
NGC 4568 42069 SA(rs)bc 4.57 16.5 8 23 64 27 47.59 46.2
Arp 116 16.5 8
NGC 4647 42816 SAB(rs)c 2.88 16.5 8 98.5 39.3 63 15.77 16.4
NGC 4649 42831 E2 7.41 16.5 8 -72.5 35.9 26 3
Arp 271 40.0 9
NGC 5426 50083 SA(s)c pec 2.95 40.0 9 177.5 59 17 16.46
NGC 5427 50084 SA(s)c pec 2.82 40.0 9 53.2 34 17 16.46 14.7
Arp 090 42.5 9
NGC 5929 55076 Sab? pec 0.95 42.5 9 62 26 47, 56 43 13.74 13.0
NGC 5930 55080 SAB(rs)b pec 1.58 42.5 9 -25.0 45.0 5 13.74 13.0
Arp 284 38.6 9
NGC 7714 71868 SB(s)b? pec 1.91 38.6 9 -42 30 49 11.29
NGC 7715 71878 Im pec edge-on 2.57 38.6 9 73 79 11 11.29
3 Observations
The observations were made with the NRO 45 m telescope. Three \atomC\atomO isotopomers were simultaneously observed with the OTF mode. We developed an observation ranking system that objectively selects the optimal target to maximize the survey efficiency. This system was used in the last two seasons.
3.1 System setting and OTF mapping
Simultaneous observations of \atomC12\atomO (rest frequency: ), \atomC13\atomO (rest frequency: ), and \atomC\atomO18 (rest frequency: ) were made with FOREST over four seasons: from 2015 April to May, from 2015 December to 2016 May, from 2016 December to 2017 May, and from 2017 December to 2018 April (table 3.1). FOREST has four beams, and each beam can receive dual-polarization bandwidth data for each sideband (upper and lower sidebands). The beam size of each beam was in and bands. SAM45 (Kuno et al. (2011); Kamazaki et al. (2012)), which consists of 16 correlators, is available as a backend. We used SAM45 in a wide-band mode with bandwidth and 4096 channels corresponding to a frequency resolution of .222Some observations of a standard source IRC +10216 were made in bandwidth per IF band, but this does not affect the calibration results. Two correlators were assigned for each beam and polarization. The center frequencies were set to for \atomC12\atomO and for \atomC13\atomO and \atomC\atomO18 , respectively. We measured the image rejection ratio (IRR) of each side band of each beam every observation day. The typical system noise temperatures () in each observation season were , , , and in \atomC12\atomO and , , , and in \atomC13\atomO and \atomC\atomO18, respectively (table 3.1).
Observation periods and system noise temperatures. Season Date Typical (K) \atomC12\atomO \atomC13\atomO & \atomC\atomO18 1 2015 Apr. 4 – 2015 May 6 560 300 2 2015 Dec. 21 – 2016 May 24 340 170 3 2016 Nov. 28 – 2017 March 17 360 180 4 2017 Dec. 24 – 2018 Apr. 23 390 180
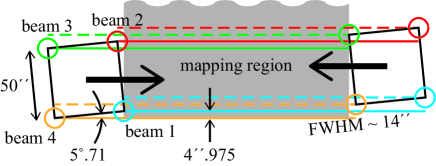
We observed the OTF-mapping mode to achieve a typical sensitivity of in the antenna temperature () scale corresponding to in the main beam brightness temperature () scale. Each region in a given target was mapped with more than one beam to reduce the influence caused by the difference in the performances of the four beams. Figure 5 shows that we rotated FOREST against the scan direction and raster scanned in separation, which was times higher than the Nyquist sampling of the beam to cover the mapped region with five round trips. This mapping method enabled us to minimize the peripheral regions with a high noise temperature. We adopted two orthogonal scan directions and made the noise temperatures of each direction as even as possible. Two points offset from the map center were observed as the off-source positions. Although the off-source positions were kept far away from the Galactic disc, unfortunately, unknown Galactic molecular clouds may exist at the off-source points of UGCA 86 and NGC 1569 at the same receding velocity of the galaxies; thus, some profiles of these two galaxies were contaminated by “absorption” patterns.
We scanned each galaxy to cover of in diameter. Previous works (Nishiyama et al. (2001); Kuno et al. (2007)) have shown that of of a galaxy covers the main region, where the CO emission is concentrated within a reasonable observation time. The scan directions were along the galaxy major and minor axes to maximize efficiency, while those of the interacting systems were along the right ascension and declination covering the whole system. Observations were made referencing the equatorial coordinates, except for NGC 2268 and NGC 2276 with a declination of . Both galaxies were observed in the galactic coordinates to avoid a large variation of the right ascension. The scan length along the minor axis of the galaxy was adopted by multiplying the length along the major axis by listed in Tully (1988). The PA and i for setting an observing region were different from those listed in table 2, which we used for the data analysis (section 5), because we observed referring the PAs mainly listed in the Third Reference Catalogue of Bright Galaxies (RC3, de Vaucouleurs et al. (1991)); however, it was convenient for the data analysis to refer to the kinematically derived PAs or use IR images. Table 3.1 lists the observation parameters.
p2cmp2cmp2cmp0.8cmp2cmp0.8cmp0.8cmp0.8cmp1cmp1.5cm
Sample observational parameters.
Galaxy Mapping size PA of Season
(1) (2) (3) (4) (5) (6) (7) (8) (9) (10)
\endfirstheadGalaxy Mapping size PA of Season
(1) (2) (3) (4) (5) (6) (7) (8) (9) (10)
\endhead\endfoot
Notes.
Column (1) Galaxy name.
Same as the column (1) in table 2.
Columns (2) and (3): Adopted galaxy center coordinates.
No remarks in column (4) indicates that the coordinates correspond to the reference position of the observations.
Column (4) Reference and notes of the galaxy center that is listed on the top of NED.
No remarks: Two Micron All Sky Survey Team (2003).
1: Anderson & Ulvestad (2005).
2: Argyle & Eldridge (1990).
3: Becker et al. (1995).
4: Clements (1981).
5: Clements (1983).
6: Condon & Broderick (1991).
7: Condon et al. (1998).
8: Evans et al. (2010).
9: Herrnstein et al. (2005).
10: Jackson et al. (2007).
11: Kautsch et al. (2006).
12: Krips (2007).
13: Li et al. (1998).
14: Liu & Bregman (2005).
15: Minchin et al. (2010).
16: Monet (1998).
17: Nagar et al. (2002).
18: NEDTEAM (2011).
19: NEDTEAM (2012).
20: Paturel et al. (2000).
21: Petrov & Taylor (2011).
22: SDSS DR (2).
23: SDSS DR (3).
24: SDSS DR (4).
25: SDSS DR (5).
26: SDSS DR (6).
27: Stone et al. (1999).
28: Two Micron All Sky Survey Team (2000)
29: Vigott et al. (1989).
30: Villi et al. (1998).
31: Whiting et al. (2007).
32: XMM-Newton Serendipitous Source Catalogue .
33: Averaged the coordinates of the two galaxies.
: Observed in the Galactic coordinates, .
: Observed in the Galactic coordinates, .
: We observed NGC 2775 wrongly with the reference position of .
: We observed NGC 3079 with the reference position of .
: We observed NGC 3169 with the reference position of .
: We observed NGC 3147 with the reference position of .
: We observed NGC 4527 wrongly with the reference position of .
: We adopted the declination different from the average of both galaxies to avoid observing a large blank sky.
: We observed Arp 094 wrongly with the reference position of .
: The original reference is unidentified.
Column (5) Mapping size in the observation coordinates, (major axis) (minor axis).
Column (6) Position angle (PA) of the direction of .
Column (7) Reference and notes of PA.
No remarks: de Vaucouleurs et al. (1991).
1: Fingerhut et al. (2010).
2: Guhathakurta et al. (1988).
3: Helfer et al. (2003).
4: Jarrett et al. (2003).
5: Koda et al. (2002).
6: Koopmann et al. (2001).
7: Kuno et al. (2007).
8: Leroy et al. (2009).
9: Moshir et al. (1990).
10: Nishiyama & Nakai (2001).
11: Paturel et al. (2003).
12: SDSS DR (6).
13: Two Micron All Sky Survey Team (2003).
14: Vaduvescu & McCall (2008).
15: Wilson et al. (2012).
: Not kinematically determined but PA of observation.
Column (8) Tracking velocity with respect to the local standard of rest (LSR) in radio definition. In most cases, it corresponds to the receding velocity of galaxies.
Column (9) Reference and notes of .
No remarks: de Vaucouleurs et al. (1991).
1: Boselli et al. (2014a).
2: Bushouse et al. (1998)
3: Huchra et al. (1999).
4: Kuno et al. (2007).
5: NEDTEAM (1992).
6: Springob et al. (2005).
7: Theureau et al. (1998).
8: Toloba et al. (2014).
9: Wilson et al. (2012).
10: Yamauchi et al. (2004).
: We adopted a wrong value. is the correct value.
: Not referring NED.
: Averaged the two galaxies values.
: We miscalculated the average velocity of the two galaxies, and the adopted value differed by from both galaxies.
: We adopted a wrong value. is the correct value.
: The value listed in the reference differs by more than from both galaxies.
Column (10) Observation period in table 3.1.
\endlastfoot isolated galaxies
IC 10 \timeform00h20m17.34s \timeform+59D18’13.6” 14 -340 3 2
NGC 150 \timeform00h34m15.48s \timeform-27D48’12.9” 1569 3
NGC 157 \timeform00h34m46.76s \timeform-08D23’47.2” 1655 2
NGC 278 \timeform00h52m04.31s \timeform+47D33’01.8” 10 644 3 2
NGC 337 \timeform00h59m50.09s \timeform-07D34’40.7” 1649 9 3
NGC 470 \timeform01h19m44.85s \timeform+03D24’35.8” 2350 2
NGC 520 \timeform01h24m35.07s \timeform+03D47’32.7” 2195 2
NGC 613 \timeform01h34m18.170s \timeform-29D25’06.10” 14 1457 4
NGC 628 \timeform01h36m41.747s \timeform+15D47’01.18” 8 15 654 3 3
NGC 660 \timeform01h43m02.400s \timeform+13D38’42.20” 22 845 3 2
NGC 701 \timeform01h51m03.84s \timeform-09D42’09.4” 1815 3
NGC 891 \timeform02h22m33.41s \timeform+42D20’56.9” 29 527 3
NGC 1022 \timeform02h38m32.705s \timeform-06D40’38.74” 28 1434 7 3
NGC 1055 \timeform02h41m45.23s \timeform+00D26’35.4” 982 3, 4
NGC 1084 \timeform02h45m59.908s \timeform-07D34’42.48” 26 1387 3
NGC 1087 \timeform02h46m25.164s \timeform-00D29’55.14” 26 1500 3
NGC 1156 \timeform02h59m42.300s \timeform+25D14’16.20” 15 375 4
NGC 1241 \timeform03h11m14.64s \timeform-08D55’19.7” 3963 4
UGC 2765 \timeform03h32m03.41s \timeform+68D22’06.2” 1674 3
NGC 1482 \timeform03h54m38.965s \timeform-20D30’09.65” 32 1738 3
UGCA 86 \timeform03h59m48.30s \timeform+67D08’18.6” 31 1 70 2
IC 356 \timeform04h07m46.91s \timeform+69D48’44.8” 890 3
NGC 1530 \timeform04h23m27.10s \timeform+75D17’44.1” 4 2447 3
NGC 1569 \timeform04h30m49.059s \timeform+64D50’52.60” 5 -87 2
NGC 2146 \timeform06h18m37.71s \timeform+78D21’25.3” 897 2
NGC 2273 \timeform06h50m08.6575s \timeform+60D50’44.901” 1 1829 3
NGC 2339 \timeform07h08m20.54s \timeform+18D46’48.9” 2177 2
NGC 2268 \timeform07h14m17.44s \timeform+84D22’56.2” 2214 3
NGC 2276 \timeform07h27m14.36s \timeform+85D45’16.4” 2406 3
NGC 2633 \timeform08h48m04.58s \timeform+74D05’55.9” 2151 2
NGC 2681 \timeform08h53m32.740s \timeform+51D18’49.22” 8 9 690 3
NGC 2742 \timeform09h07m33.53s \timeform+60D28’45.6” 1285 3
NGC 2715 \timeform09h08m06.20s \timeform+78D05’06.6” 1324 3
NGC 2775 \timeform09h10m20.12s \timeform+07D02’16.6” 1337 3
NGC 2748 \timeform09h13m43.02s \timeform+76D28’31.2” 1466 6 3
NGC 2782 \timeform09h14m05.1124s \timeform+40D06’49.316” 12 9 2538 4
NGC 2841 \timeform09h22m02.634s \timeform+50D58’35.47” 16 8 637 2
NGC 2903 \timeform09h32m10.11s \timeform+21D30’03.0” 7 549 4 1
NGC 2967 \timeform09h42m03.295s \timeform+00D20’11.18” 26 1870 3
NGC 2976 \timeform09h47m15.46s \timeform+67D54’59.0” 9 1
NGC 2985 \timeform09h50m22.23s \timeform+72D16’43.1” 1323 3
NGC 3034 \timeform09h55m52.725s \timeform+69D40’45.78” 10 15 209 3, 4
NGC 3079 \timeform10h01m57.8034s \timeform+55D40’47.242” 21 5 1142 10 1
NGC 3077 \timeform10h03m19.07s \timeform+68D44’02.1” 20 2
NGC 3166 \timeform10h13m45.778s \timeform+03D25’29.89” 26 1332 3
NGC 3169 \timeform10h14m15.0502s \timeform+03D27’57.875” 1 1221 3
NGC 3177 \timeform10h16m34.136s \timeform+21D07’22.99” 26 1293 3
NGC 3147 \timeform10h16m53.6509s \timeform+73D24’02.695” 17 2801 2
NGC 3198 \timeform10h19m54.952s \timeform+45D32’58.64” 8 8 663 2
Mrk 33 \timeform10h32m31.997s \timeform+54D24’02.05” 8 12 1458 3
NGC 3310 \timeform10h38m45.860s \timeform+53D30’12.18” 26 13 981 2
NGC 3338 \timeform10h42m07.540s \timeform+13D44’49.20” 25 1292 3
NGC 3344 \timeform10h43m31.15s \timeform+24D55’20.0” 4 584 3
NGC 3351 \timeform10h43m57.700s \timeform+11D42’13.70” 24 15 772 3
NGC 3367 \timeform10h46m34.954s \timeform+13D45’03.09” 26 13 3008 3
NGC 3359 \timeform10h46m36.863s \timeform+63D13’27.25” 26 1016 3
NGC 3368 \timeform10h46m45.740s \timeform+11D49’11.80” 30 3 891 2
NGC 3370 \timeform10h47m04.051s \timeform+17D16’25.04” 26 1272 3
NGC 3437 \timeform10h52m35.75s \timeform+22D56’02.9” 1277 3
NGC 3471 \timeform10h59m09.012s \timeform+61D31’50.46” 26 2120 3
NGC 3521 \timeform11h05m48.5810s \timeform-00D02’09.110” 27 7 798 3, 4
NGC 3556 \timeform11h11m30.97s \timeform+55D40’26.8” 699 2
NGC 3583 \timeform11h14m10.890s \timeform+48D19’06.67” 26 2126 3
NGC 3627 \timeform11h20m14.964s \timeform+12D59’29.54” 8 7 724 3
NGC 3628 \timeform11h20m16.970s \timeform+13D35’22.86” 8 844 2
NGC 3655 \timeform11h22m54.617s \timeform+16D35’24.11” 26 1466 3
NGC 3672 \timeform11h25m02.47s \timeform-09D47’43.4” 1846 3
NGC 3675 \timeform11h26m08.58s \timeform+43D35’09.3” 770 2
NGC 3686 \timeform11h27m43.970s \timeform+17D13’27.06” 26 1152 3
NGC 3810 \timeform11h40m58.760s \timeform+11D28’16.10” 24 10 991 2
NGC 3813 \timeform11h41m18.657s \timeform+36D32’48.50” 26 1462 2
NGC 3888 \timeform11h47m34.370s \timeform+55D58’02.00” 23 2396 3
NGC 3893 \timeform11h48m38.19s \timeform+48D42’39.0” 977 2
NGC 3938 \timeform11h52m49.45s \timeform+44D07’14.6” 15 813 2
NGC 3949 \timeform11h53m41.720s \timeform+47D51’31.34” 26 803 2
UGC 6973 \timeform11h58m52.201s \timeform+42D43’20.91” 26 708 2
NGC 4027 \timeform11h59m30.17s \timeform-19D15’54.8” 1658 3
NGC 4030 \timeform12h00m23.627s \timeform-01D06’00.34” 26 1453 §§§ 3
NGC 4041 \timeform12h02m12.202s \timeform+62D08’14.00” 26 13 1238 2
NGC 4045 \timeform12h02m42.238s \timeform+01D58’36.51” 26 1968 3
NGC 4085 \timeform12h05m22.710s \timeform+50D21’10.63” 26 758 3
NGC 4088 \timeform12h05m34.19s \timeform+50D32’20.5” 766 2
NGC 4214 \timeform12h15m39.17s \timeform+36D19’36.8” 8 297 2
NGC 4258 \timeform12h18m57.5046s \timeform+47D18’14.303” 9 3 455 2
NGC 4303 \timeform12h21m54.895s \timeform+04D28’25.13” 2 2 1563 2
NGC 4433 \timeform12h27m38.59s \timeform-08D16’42.3” 2971 3
NGC 4527 \timeform12h34m08.421s \timeform+02D39’13.19” 8 1727 3
NGC 4536 \timeform12h34m27.050s \timeform+02D11’17.29” 26 11 1796 3
NGC 4559 \timeform12h35m57.647s \timeform+27D57’35.97” 8 15 820 3
NGC 4579 \timeform12h37m43.5220s \timeform+11D49’05.498” 12 6 1516 2
NGC 4605 \timeform12h39m59.38s \timeform+61D36’33.1” 153 2
NGC 4602 \timeform12h40m36.85s \timeform-05D07’58.8” 4 2528 3
NGC 4632 \timeform12h42m32.03s \timeform-00D04’57.4” 1711 3
NGC 4666 \timeform12h45m08.591s \timeform-00D27’42.79” 26 1516 3
NGC 4750 \timeform12h50m07.271s \timeform+72D52’28.72” 8 4 1616 3
NGC 4753 \timeform12h52m22.11s \timeform-01D11’58.9” 1235 3
NGC 4818 \timeform12h56m48.90s \timeform-08D31’31.1” 1074 3
NGC 5005 \timeform13h10m56.231s \timeform+37D03’33.14” 3 3 953 2
NGC 5055 \timeform13h15m49.33s \timeform+42D01’45.4” 15 514 4
NGC 5248 \timeform13h37m32.024s \timeform+08D53’06.64” 26 10 1157 2
NGC 5364 \timeform13h56m12.00s \timeform+05D00’52.1” 1245 3
NGC 5480 \timeform14h06m21.579s \timeform+50D43’30.38” 26 1858 3
NGC 5678 \timeform14h32m05.610s \timeform+57D55’17.20” 22 1924 2
NGC 5665 \timeform14h32m25.742s \timeform+08D04’43.11” 26 2209 3
NGC 5676 \timeform14h32m46.846s \timeform+49D27’28.45” 26 2114 2
NGC 5713 \timeform14h40m11.505s \timeform-00D17’20.31” 26 1882 3
NGC 5792 \timeform14h58m22.71s \timeform-01D05’27.9” 1923 3
NGC 5907 \timeform15h15m53.770s \timeform+56D19’43.58” 11 681 2
NGC 6015 \timeform15h51m25.23s \timeform+62D18’36.1” 846 4
NGC 6503 \timeform17h49m26.432s \timeform+70D08’39.72” 8 10 59 2
NGC 6574 \timeform18h11m51.23s \timeform+14D58’54.4” 2284 2
NGC 6643 \timeform18h19m46.41s \timeform+74D34’06.1” 10 1496 2
NGC 6764 \timeform19h08m16.370s \timeform+50D55’59.58” 4 2415 4
NGC 6951 \timeform20h37m14.09s \timeform+66D06’20.3” 7 1434 3
NGC 7331 \timeform22h37m04.014s \timeform+34D24’55.87” 8 8 830 2
NGC 7448 \timeform23h00m03.59s \timeform+15D58’49.2” 2183 3
NGC 7479 \timeform23h04m56.65s \timeform+12D19’22.4” 2366 2
NGC 7541 \timeform23h14m43.890s \timeform+04D32’03.70” 13 2662 3
NGC 7625 \timeform23h20m30.13s \timeform+17D13’32.0” 13 1618 3
NGC 7721 \timeform23h38m48.65s \timeform-06D31’04.3” 1999 3
NGC 7798 \timeform23h59m25.50s \timeform+20D44’59.5” 13 2389 3
interacting galaxies
NGC 772 / NGC 770
\timeform01h59m16.61s \timeform+18D59’30” 33 2425 3
NGC 770 \timeform01h59m13.64s \timeform+18D57’16.8” 2416
NGC 772 \timeform01h59m19.58s \timeform+19D00’27.1” 2433
NGC 2207 / IC 2163
\timeform06h16m25.005s \timeform-21D22’27.35” 33 2673 3
NGC 2207 \timeform06h16m22.030s \timeform-21D22’21.60” 28 2701
IC 2163 \timeform06h16m27.980s \timeform-21D22’33.10” 28 2644
Arp 283 \timeform09h17m26.9s \timeform+41D59’48” 18 1795 1
NGC 2798 \timeform09h17m22.793s \timeform+41D59’59.02” 8 1727
NGC 2799 \timeform09h17m31.03s \timeform+41D59’38.7” 1743
Arp 245 \timeform09h45m45s \timeform-14D20’48” 19 2336 3
NGC 2992 \timeform09h45m42.050s \timeform-14D19’34.98” 2 2284
NGC 2993 \timeform09h45m48.33s \timeform-14D22’05.9” 2389
Arp 094 \timeform10h23m28.8s \timeform+19D52’54” 18 1120 2 3
NGC 3226 \timeform10h23m27.0083s \timeform+19D53’54.680” 1 1161 1
NGC 3227 \timeform10h23m30.5790s \timeform+19D51’54.180” 1 1149
NGC 4298 / NGC 4302
\timeform12h21m37.62s \timeform+14D36’08.05” 33 1124 4
NGC 4298 \timeform12h21m32.760s \timeform+14D36’22.20” 25 1140
NGC 4302 \timeform12h21m42.480s \timeform+14D35’53.90” 25 1108
NGC 4383 / UGC 7504
\timeform12h25m23.56s \timeform+16D26’59.23” 33 1686 3
UGC 7504 \timeform12h25m21.60s \timeform+16D25’46.0” 20 1667 8
NGC 4383 \timeform12h25m25.523s \timeform+16D28’12.46” 26 1705
Arp 269 \timeform12h30m33.7s \timeform+41D40’21” 18 307 5 2
NGC 4485 \timeform12h30m31.13s \timeform+41D42’04.2” 500
NGC 4490 \timeform12h30m36.239s \timeform+41D38’38.03” 8 585
VV 219 \timeform12h36m33.5s \timeform+11D14’54” 18 2249 4
NGC 4567 \timeform12h36m32.710s \timeform+11D15’28.80” 24 2255
NGC 4568 \timeform12h36m34.260s \timeform+11D14’20.00” 24 2243
Arp 116 \timeform12h43m36s \timeform+11D34’00” 18 1264 4
NGC 4647 \timeform12h43m32.31s \timeform+11D34’54.7” 6 1413
NGC 4649 \timeform12h43m39.975s \timeform+11D33’09.74” 26 1115
Arp 271 \timeform14h03m25.5s \timeform-06D02’59” 18 2617 3
NGC 5426 \timeform14h03m24.85s \timeform-06D04’08.8” 2606
NGC 5427 \timeform14h03m26.05s \timeform-06D01’50.9” 2629
Arp 090 \timeform15h26m06.690s \timeform+41D40’21.00” 7 2610 4
NGC 5929 \timeform15h26m06.161s \timeform+41D40’14.40” 3 2556
NGC 5930 \timeform15h26m07.941s \timeform+41D40’33.82” 3 2665
Arp 284 \timeform23h36m18.1s \timeform+02D09’21” 18 2761 3
NGC 7714 \timeform23h36m14.098s \timeform+02D09’18.58” 5 2776
NGC 7715 \timeform23h36m22.142s \timeform+02D09’23.45” 8 2747
Telescope pointing was checked roughly every hour by observing a bright source near the target galaxy, resulting in a pointing accuracy higher than . We observed Galactic SiO maser sources in SiO (rest frequency: ) and (rest frequency: ). We observed quasars in continuum at when no strong SiO maser sources were found near the target. We did not use the data taken between these two pointing observations if the offset of the telescope pointing between the two pointing observations was larger than . We also did not use the data taken under the bad condition of the radio seeing higher than – , except for a few instances where the seeing monitors malfunctioned.
The intensity calibration was made with the chopper wheel method. The hot load was observed for every approximately 10 min. Corrections among the four beams of FOREST were made through the observations of the standard sources every observation day. The standard sources were the W 3 core [] or IRC +10216 []. We also tried observing TMC-1 [], but the emission was very weak; thus, we did not use it as a standard source. We mapped a region with a side of approximately around the standard source with all four beams of FOREST. The intensities of the IRC +10216 and W 3 core showed a daily variation of , which might be caused by the uncertainty of the IF attenuators. Subsection 4.1 presents the details on the calibration method.
3.2 Observation ranking system
We introduced an observation ranking system in the last two observation seasons, which typically reduced the total observing time to complete a map by 37 % compared to the first two seasons without this system. Selecting an optimum target from a sample of various right ascensions and declinations is a non-trivial exercise. Thus, we developed an observation system that ranked and selected the optimal target to minimize the : (1) observation time for each galaxy, (2) slewing time of the telescope, and (3) unusable data caused by pointing inaccuracy. We also put priority on finishing a galaxy instead of starting to map a new one, if possible, to promptly progress the data analysis.
We numerically express these factors as follows and compare the weights of the products of the factors, a priority index “”:
| (1) |
where is a factor representing the observation efficiency; represents the antenna slewing time; denotes the pointing accuracy; expresses the scientific priority within our project team; and is the degree of completeness for a given target galaxy. A higher observation priority was given to the targets with a higher value. Quantity was immediately updated through a quick data reduction after each observation. Each factor and evaluation method were described in the subsections that follow, but note that this is somewhat a trial case for this system, and is, by no means, perfectly optimized. The goal was simply to select an optimal target under various observational conditions.
3.2.1 Factor of observation efficiency
Factor consists of two factors:
| (2) |
where represents an atmospheric factor, and represents a mapping factor. We should observe a target with as low as possible, especially in an apparently large galaxy, to reduce the total survey time.
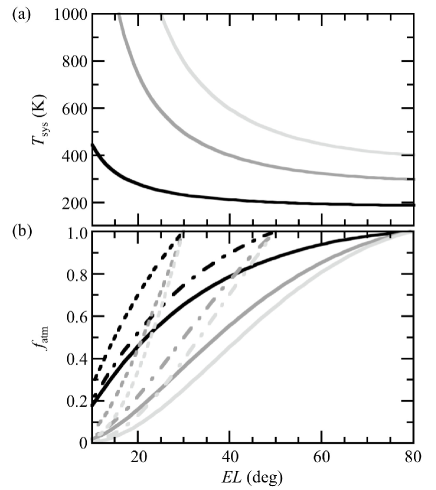
We formulated a weighted by because the observations at a lower [i.e., at a higher elevation (), figure 6a] saved our limited observing time. The factor had a higher weight when a target was observed at a higher . Scaling is presented as follows:
| (3) |
where is the necessary integration time for the observation at an elevation , and is the upper culmination or , the latter being the limit for the telescope operation. is at the of the target. was calculated using the measured value before the observation and assuming that an optical depth only depends on the . That is, did not include effects caused by weather fluctuations. The factor was plotted in figure 6b for various conditions.
We defined to observe apparently larger galaxies under a lower and smaller galaxies under a higher . We expressed this behavior as the relative integration time necessary for our survey sensitivity of .
| (4) |
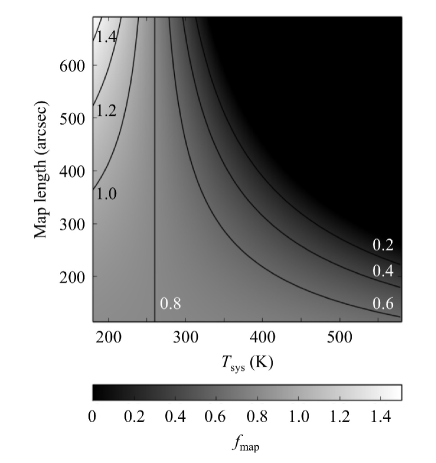
where and are the necessary integration times under the condition of of FOREST at , which is typical of good observing conditions, and at the present instant, respectively. is the integration time for per observing script for OTF mapping. decreased with the size of the target galaxies because the scan speed was different from one galaxy to another. The dump time of the backend was introduced for normalization. Factors 0.8 and 5 were adopted as constants such that all factors have a similar weight. Figure 7 shows the behavior for a square-shaped observing map. In principle, efficiency has no maximum value for very low ; however, such conditions are unlikely in practice.
3.2.2 Other factors
The speed of the telescope slew was ; therefore, we defined an antenna-tracking factor to provide a higher weight for the closer target to the present telescope direction:
| (5) |
where is the present azimuth of the telescope, and is the azimuth of the target object. Factor 0.5 was introduced such that became unity when the 45 m telescope caught up with a target in 5 min (i.e., the target was away in azimuth).
Telescope pointing affects the usable data acquisition. The pointing factor was affected by an angle between the telescope and the wind direction and the telescope elevation. A pointing source with a weak intensity needs longer integration time and iteration for accurate pointing. However, we simply set this factor to unity because no suitable relation was found between pointing and wind during the observational period.
We introduced factor for weighting by our scientific priority. is defined by the values of “default” priority in a decreasing order of: A, B, or C and the number of proposals by our project members containing the target, , as:
| (6) |
Here, is a coefficient corresponding to the default priority, that is, 1.0 for priority A, 0.8 for B, and 0.0 for C.
The completeness of the observation is expressed as:
| (7) |
where is the percentile of the observation completeness, and is set when the observations of a specific target have been completed. The factor took a value between 1.0 and 1.1 for the uncompleted targets.
4 Data reduction
Data reduction consisted of two parts: intensity scaling of the four beams of FOREST to a scale and data integration with baseline subtraction. We developed python scripts for the automatic data reduction: COMING Auto-Reduction Tools (COMING ART) for the latter step, which allowed the data reduction to be highly objective and reproducible.
4.1 Calibration
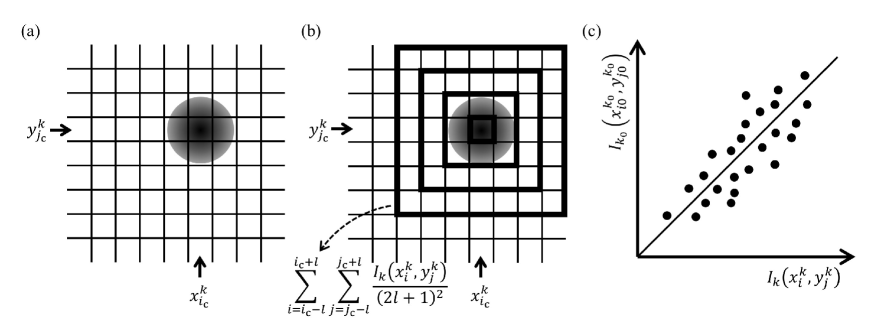
We corrected the relative intensity among the observational instruments using the integrated intensity of the standard sources taken with each beam and the polarization of FOREST. First, we made the integrated intensity maps in the \atomC12\atomO and \atomC13\atomO lines observed with each beam in in spacing. The pixel spacing was different from the target maps of (subsection 4.2), but this did not affect our calibration results because 1) the spacing was near the Nyquist rates, and we compared the relative intensities among the calibration data and 2) we searched for the peak position in each \atomC12\atomO map (figure 8a). We adopted the peak position of \atomC12\atomO with the same beam and polarization as the \atomC13\atomO peak because the \atomC13\atomO intensity was comparatively weak, making the definition of a precise peak position difficult. Some integrated intensity maps and the spectrum of the peak position appeared inconsistent when taken under poor pointing or seeing conditions. We did not use such data for the calibration.
One of the IF bands of beam 1, which seemed to be stable within each observation season, was adopted as the standard array. That is, the intensity scale taken with the other arrays was calibrated to the data taken with the standard array. Beam 1 was selected because it was on the optic axis of the telescope, and the beam efficiency was measured by the NRO.
Most of the integrated intensity maps of the calibration source obtained during the period of 2018 March to April contained unexpected artifacts in a band of pixels because the reference frequency signal shifted during the OTF scans, resulting in parts of the observed data block being separated in frequency. One source object block was constructed by combining the separated data blocks, but this resulted in an erroneous band of pixels at the separation boundary. Thus, this contaminated region was masked and reconstructed using the information from the unaffected areas. The reconstruction was done using a modified version of the Papoulis-Gerchberg algorithm, which extrapolates the masked region by iterative Fourier transformations with certain assumptions. The reconstruction method was tested on the calibration images without issue, and a successful reconstruction was observed with an error of . A detailed explanation about the obtained artifact, methodology, and reconstruction results for the affected images can be found in Cooray et al. (2019).
The precise calibration required measurements of the intrinsic intensity of the standard sources that was estimated by avoiding bad weather conditions as much as possible. The pointing errors induced by sudden wind or halation in an image because of bad seeing reduced the intensity calibration precision. Hence, we measured the peak intensity and the intensities averaged over , , , , and around the peak of the integrated intensity map, and compared them with the corresponding data taken with the standard array.
We measured the temporal scaling factors in the two following ways: The first is defined as:
| (8) | |||||
Here, correspond to using only the peak, around the peak, around the peak, and so on (figure 8b). We described each pixel in a map taken with the array “” as and the found peak position as . Subscript “” represents the standard array value. is the integrated intensity at the pixel of the array “” and represents the standard array. The other is defined as a gradient of the least squares fitting of the linear function (figure 8c):
| (9) | |||||
We compared these temporally scaling factors, , , and found that the average of around the peak () seemed to be the most stable. However, the intensity showed a noticeable scatter between the observational days even when using . Thus, we did not calibrate the data daily, but calibrated them using the averaged scaling factor over some observational periods (3 – 83 days, typically days) divided by the maintenance of FOREST or the local oscillators that possibly affected the intensity scaling.
The data taken with the standard arrays were multiplied by the IRR correction factors as follows:
| (10) |
where is the image rejection ratio in dB measured at the beginning of every observation day (subsection 3.1). After this step, the intensity scale of the standard array became the scale. This correction was not done for the data taken with the other arrays because we directly scaled the intensity taken with those arrays with the intensity of the standard array in the scale.
The data of the standard sources taken in the second observation season were divided by the main beam efficiency () of the 45 m telescope, while those taken in the other seasons were scaled to be the same intensity as the former data. The main beam efficiencies of the telescope of and provided by the NRO333https://www.nro.nao.ac.jp/~nro45mrt/html/prop/eff/eff2015.html. were used to convert the data taken in the second observation season into the scale. Only was public444https://www.nro.nao.ac.jp/~nro45mrt/html/prop/eff/eff2014.html. in the first observation season, and was not measured in the third observation season because of an unforeseen telescope impairment. We also did not use and in the fourth observation season555https://www.nro.nao.ac.jp/~nro45mrt/html/prop/eff/eff_latest.html. because the intensity of the standard objects was inconsistent with the previous values when we used these efficiencies. Therefore, we did not divide the data taken in the three seasons, except for the second observation season by . However, we used the scaling factors that corresponded to the intensity of the standard sources to those taken in the second observation season.
4.2 Auto-reduction scripts, COMING ART
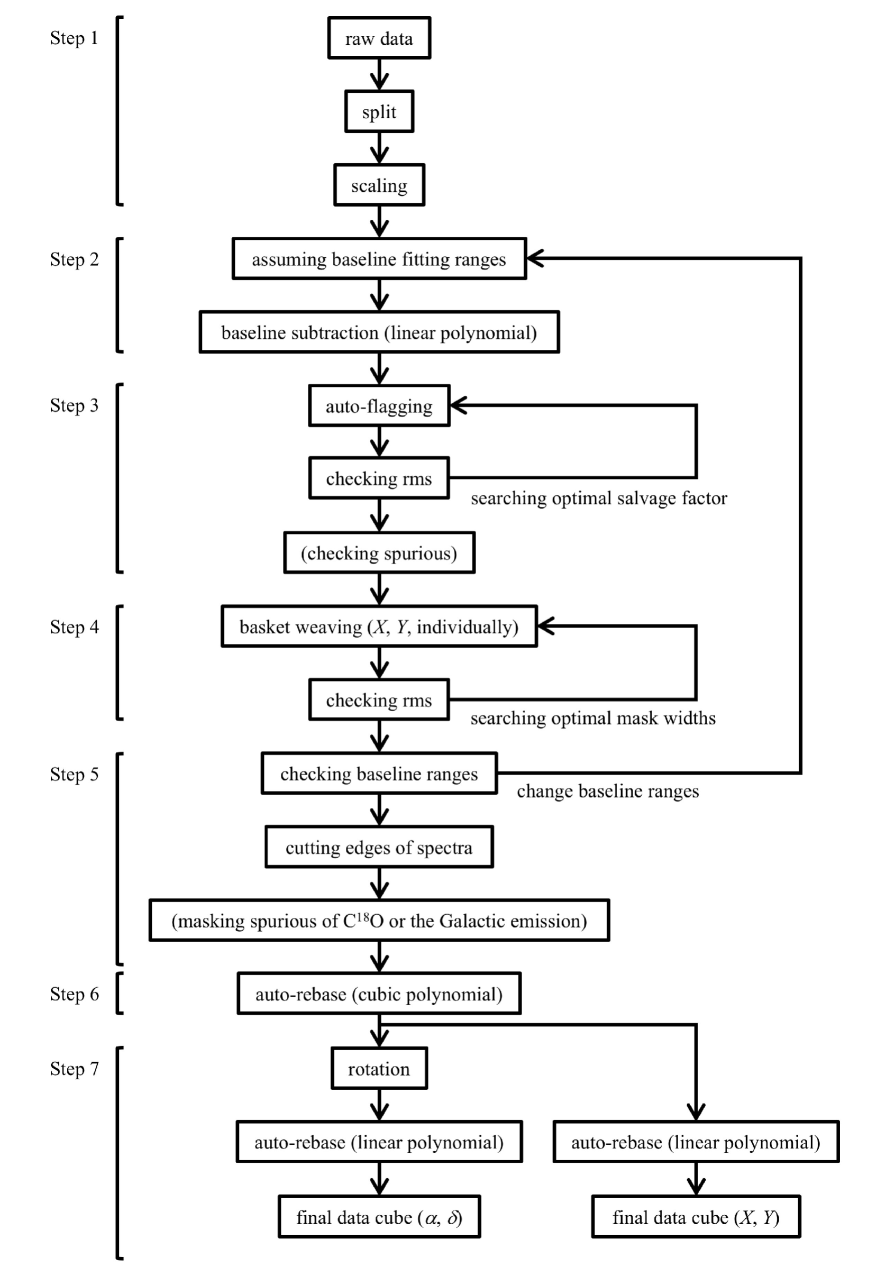
We developed and used the data reduction scripts COMING ART based on the Nobeyama OTF Software Tools for Analysis and Reduction (NOSTAR) developed by the NRO. These scripts were composed of several steps, including the evaluation of the baseline undulation, flagging of bad data, basket weaving, and automatic baseline subtraction. Figure 9 shows an overview of the procedures in the pipeline. We could reduce data with very high objectivity and reproducibility using the COMING ART. Each step in figure 9 is explained below.
4.2.1 Step 1: data formation and intensity scaling
CO maps were generated as a data cube with spacing and a velocity width of . We selected a correlator dump time of SAM45 of 0.1 s according to Sawada et al. (2008), which resulted in an OTF scan speed of approximately to per second depending on the map size. The data were split with a task Split in the NOSTAR and calibrated with a task Scaling in the NOSTAR using the scaling factors described in subsection 4.1. We produced data cubes in the abovementioned intervals according to Sawada et al. (2008). The effective spatial resolution of the OTF maps was in both and , which was larger than the size of the observation beam of . The data cubes were then subject to the reduction steps described below.
4.2.2 Step 2: baseline subtraction
A linear baseline was fitted for the two velocity ranges with width on both sides of the emission range using the task Baseline in the NOSTAR. The velocity range of emission was based on the previous \atomC12\atomO or H \emissiontypeI data rounded to a multiple of . The two baseline ranges were immediately set adjacent to the emission range.
4.2.3 Step 3: discarding heavily undulated spectra (“auto-flag”)
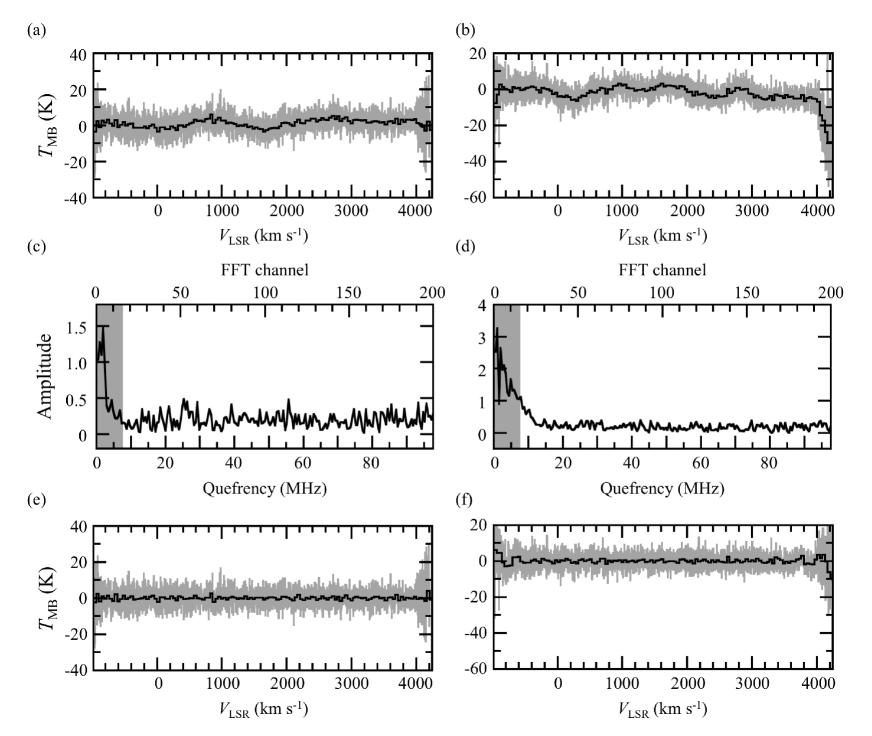
This step begins with evaluating the rms noise of an ideal non-undulated spectrum using a fast Fourier transform (FFT) analysis and removing lower-frequency components. The baseline undulation over a wide frequency range was non-trivial because distinguishing it from the wide and weak emission line of a galaxy was very difficult. Even a loose undulation increased the rms noise and prevented the evaluation of the degree of undulation; thus, we performed an FFT analysis and calculated the rms noise of the spectrum whose frequency components lower than were removed, . The frequency was empirically adopted from the analysis of the observed data of several galaxies. Figures 10a and b show examples of the undulated spectra. Figures 10c and d depict the Fourier transforms of these undulated spectra. We obtained undulation-corrected spectra (figures 10e and f) when we masked the frequency components lower than shown in the gray hatch in these panels.
Second, we flagged and removed the poor-quality data after checking the rms noise behavior considering a salvage factor. When a spectrum is smoothed by summing up the channels, the rms noise should inversely decrease proportional to a square root of the number of the summed-up channels if the spectrum no longer suffers from undulation. Almost all the spectra will be identified as poor-quality data if we strictly apply this criterion; thus, we introduced a salvage factor , which was larger than unity and lower than , in the case of
| (11) |
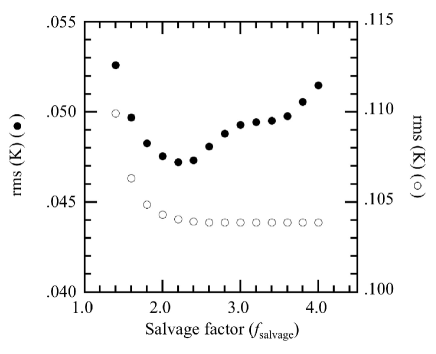
where is the rms noise for the channel smoothed spectrum. We will then discard that specific spectrum. We smoothed a spectrum of 4096 channels for every 32 channels and evaluated the baseline undulation by comparing the rms of the smoothed spectrum with that of the non-smoothed one. In this process, the rms was calculated for all channels, including the channels containing the CO emission, except for the NGC 3034. The emission of NGC 3034 was particularly strong; therefore, the rms was calculated for the channels over the default baseline ranges. The resultant rms noise had a local minimum or monotonously decreased with the increasing (figure 11) because removing the spectra with the undulated baselines resulted in a lower rms noise at first, but decreasing the number of spectra in the integration then increased the noise levels. We fixed as 32 and assigned 1.4 to 4.0 in steps of 0.2 for . We then searched for the minimum value of the resultant rms noise, and adopted the salvage factor when the resultant rms was minimum. This flagging method was called auto-flag. After flagging the poor-quality data, the resulting data cube was constructed with a task Make Map in the NOSTAR.
4.2.4 Step 4: basket weaving
Basket weaving is an effective method of decreasing the impact of the scanning effect for scan observations (Emerson & Gräve (1988)). The width is masked for a Fourier transformed map to reduce the scanning noise seen in the original map. Although the same mask width is adopted for the - and -directions in a task Basket-Weave in the NOSTAR, the procedure is not necessarily effective for a map with a large aspect ratio, such as an edge-on galaxy. Basket weaving was performed herein by independently assigning a mask width along the major (-direction) and minor (-direction) axes of a given map, then adopting mask widths to minimize the resultant rms noise.
4.2.5 Step 5: checking the baseline ranges and flagging of spurious channels
For the data whose signal range overflowed into the initial baseline range, the baseline range was revised, and the abovementioned procedures were iterated (figure 9); otherwise, the data were fine-tuned. Checking was made by the eye for a profile map and a spatially integrated total spectrum in \atomC12\atomO of each galaxy. After the signal range confirmation, we adopted the final baseline ranges, which were both sides of the signal range with a width of . We then cut both outsides of the baseline range. We masked the channels to zero intensity when spiky spurious features were seen in the spectra. This procedure was applied to some data of \atomC\atomO18. The channels smeared by the Galactic emission in NGC 1569 and UGCA 86 were also masked.
4.2.6 Step 6: baseline subtraction with a cubic polynomial (“auto-rebase”)
We fitted the baseline again to optimize the zero level in each spectrum. We then applied a cubic polynomial as a baseline. We evaluated the possibility that a cubic polynomial fitting for the baseline extinguishes or reduces the galaxy emission. We calculated the rms noises in the baseline ranges and the emission range of a model Gaussian profile emission with sinusoidal undulation and various signal-to-noise () ratios. This simple evaluation indicated that the cubic polynomial fitting more effectively reduces the rms noise compared to a linear fitting without deleting the real emission.
We determined the emission ranges in the following manner: identifying which part of the spectrum indicates emission, in the case the velocity field of a galaxy is unknown, is not necessarily trivial. We created a data cube smoothed by in space. Within this smoothed cube, we identified the channels with and designated them as the emission channels. All remaining channels, including the range outside of the signal range, were identified as the baseline channels used to fit a final baseline. This technique is called auto-rebase. The emission for the three \atomC\atomO lines was searched for in this manner, but the searching emission range of \atomC13\atomO and \atomC\atomO18 was restricted to the emission channels of \atomC12\atomO because both lines were weak in comparison.
4.2.7 Step 7: coordinate transformation and “auto-rebase”
The data cube was rotated to align with the equatorial coordinates. We performed auto-rebase with a linear baseline subtraction again for the original and rotated data. The spatial resolution of a map along the - and -directions was slightly higher than that of a map in the equatorial coordinates because the pixel interval of the equatorial map was coarser. Thus, we prepared both cubes, although we used the equatorial coordinate cubes for the subsequent analysis. The process after scaling was automated as a single python script.
We calculated the rms noise for each pixel over the whole baseline channels and made an rms noise map. The average of the rms noise map was recorded as the typical rms noise in the header of the resulting FITS data cube. We also made FITS cubes where the baseline channels were represented as unity, and the emission channels were represented as zero. The final data cubes are available at the Japanese Virtual Observatory (JVO) website666https://jvo.nao.ac.jp/portal/nobeyama/coming.do..
5 Data analysis
5.1 CO
The integrated intensity maps were constructed by summing up the emission channels for each pixel
| (12) | |||||
for each line of \atomC12\atomO, \atomC13\atomO, or \atomC\atomO18, where is the channel number, and is the velocity width of a channel (). The error of the integrated intensity was calculated as:
| (13) |
where is the rms noise calculated over the baseline channels, and is the total velocity width of the emission channels. Note that became zero for the emission-free pixels when we applied the auto-rebase to the data; thus, was also zero following equation (13). This clearly underestimated the error of the integrated intensity of each pixel; therefore, we calculated the average width of the emission channels for the pixels with more than one emission channel and adopted this average as a typical emission width and applied it to equation (13) for the emission-free pixels. In the case of \atomC\atomO18, even this typical emission width became zero because the emission was hardly detected. We applied a typical line width of \atomC13\atomO instead of that of \atomC\atomO18 in this case.
The total molecular gas mass of a galaxy was calculated by summing up the pixels within an infrared-defined radius described in subsection 5.2 and applying the standard conversion factor (Bolatto et al. (2013)):
| (14) |
This conversion factor had an error of 30 % (Bolatto et al. (2013)), but we did not include this error in our error analysis. We also did not consider the calibration uncertainty of when summing up the calibration fluctuation described in subsection 3.1 and the fluctuation in described in subsection 4.1. Thus, may have an uncertainty of , which is not explicitly included. We further multiplied by a factor of 1.36 to include the contributions from \atomHe.
The first- and second-degree moment maps were made using the CASA routine immoments. The first-degree moment
| (15) |
provides an intensity-weighted mean velocity, while the second-degree moment
| (16) |
provides the velocity dispersion. We smoothed and masked the data following the method outlined in Miyamoto et al. (2018) to avoid the invalid moment values caused by noise. First, the data were convolved with 1.5 times of the beam size, and then the intensity-weighted moments and the rms noise were calculated for the spatially smoothed cubes. Second, the pixels whose of the integrated intensity was lower than 4 were masked using these smoothed data.
5.2 WISE
We analyzed the archival band data of the WISE (Wright et al. (2010)) All-Sky Survey to measure the stellar mass of our sample galaxies. According to Wen et al. (2013), a luminosity provides a reasonable index of the stellar mass of galaxies. We downloaded the data corresponding to the coordinates of the galactic center listed in table 3.1 from the NASA/IPAC Infrared Science Archive777http://irsa.ipac.caltech.edu/Missions/wise.html.. The downloaded images covered more than two times of . A pixel scale of the images was . The background level was estimated from a histogram of the pixel values within a ring between radii and () and subtracted following the documents from the WISE project888http://wise2.ipac.caltech.edu/docs/release/allsky/expsup/sec1_4c.html.. Panel (a) of figures 12, 13 and supplementary figures 1 – 134 in the supplementary section of the online version depict the background-subtracted images.
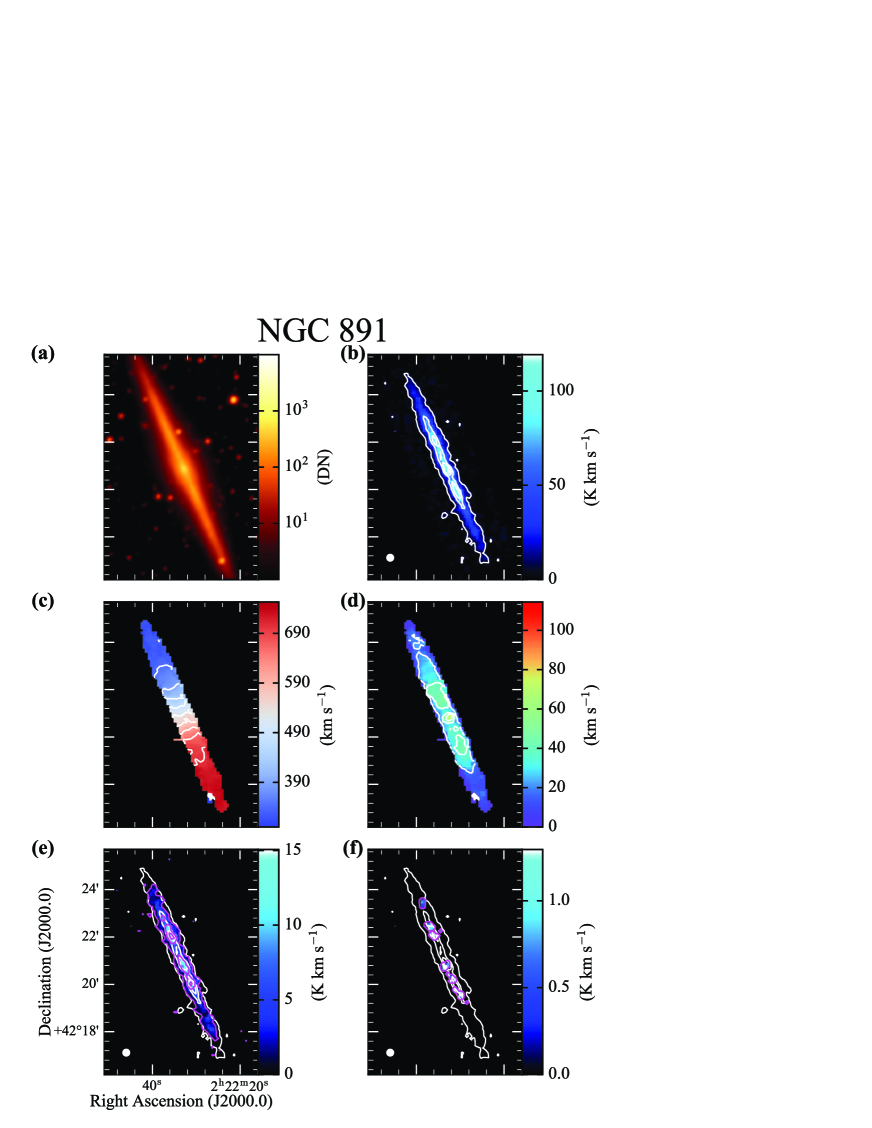
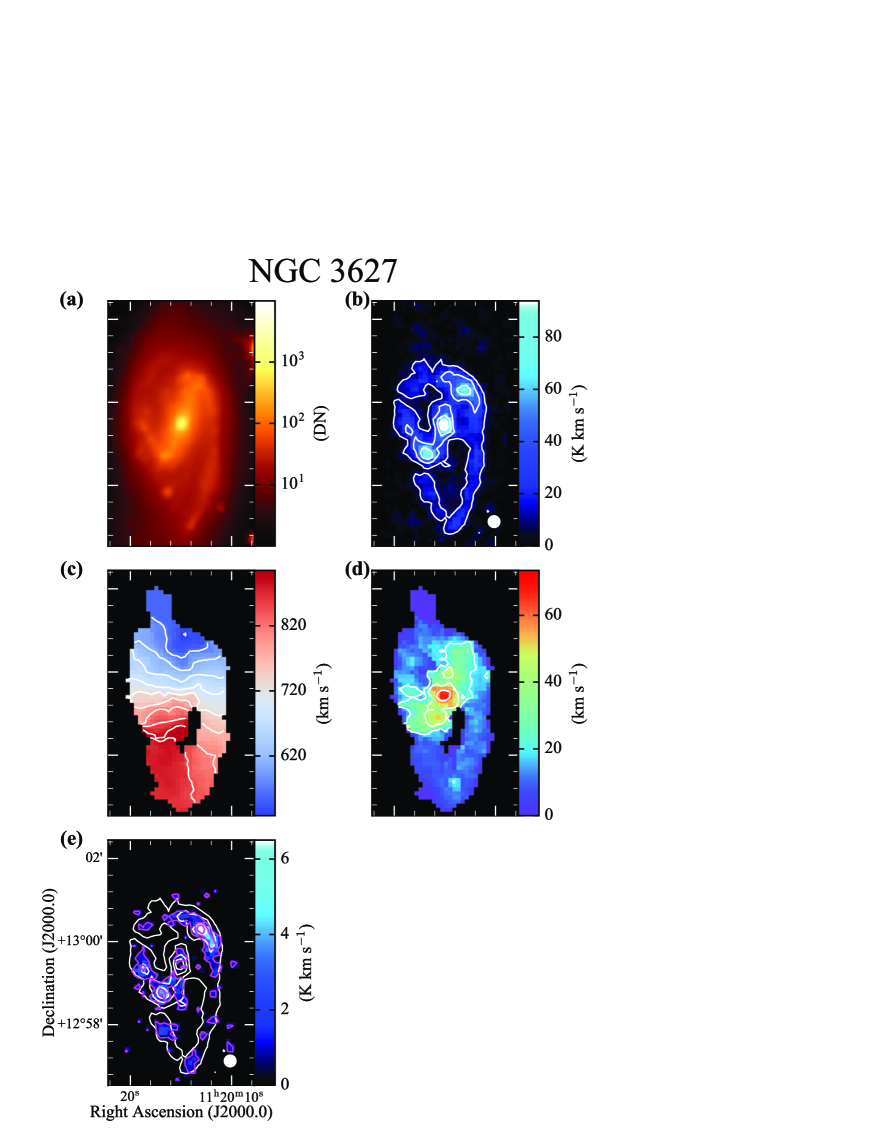
Many Galactic stars were imaged in the WISE images; hence, we roughly masked these stars to measure a more precise stellar mass. We identified the Galactic stars by simply assuming that they corresponded to bright, point-like sources. Although the typical resolution of the Atlas image of is , we fitted a Gaussian with a 1.3 times larger FWHM than the resolution to capture the extended halo around the brightest Galactic stars. We checked all the images in the logarithmic intensity scale and confirmed that the Galactic stars were removed. Some images showed strong spider diffraction patterns caused by very bright stars. These images were identified and automatically masked. The pixels on the stars and the spider diffraction patterns were substituted with an average value around the stars or the spider diffraction patterns.
This rough identification caused some misidentification of the Galactic stars, especially for the galaxies just behind the Galactic plane or galaxies with bright foreground stars. We could not mask a foreground Galactic cluster in UGCA 86. Many foreground stars resulted in a large uncertainty in the infrared flux in IC 10 and IC 356. One or two bright stars with spider diffraction patterns also resulted in an uncertainty in NGC 1569 and NGC 2276. In the case of NGC 5792, a bright star could not be completely subtracted, and the galaxy emission was overestimated. We did not use the stellar mass and its related values for UGCA 86 because our measured stellar mass had large associated uncertainties. In the case of NGC 1055, NGC 3338, NGC 3627, NGC 5055, and NGC 6951, a foreground bright star likely contributes to additional uncertainty. In NGC 5364 and NGC 5907, two foreground stars could not be removed because of their positions coincident with the target galactic discs. However, the data contamination for these seven galaxies seems only minor within an error bar and remains as such in our sample for further analysis. Our star masking, except for the six galaxies (i.e., IC 10, UGCA 86, IC 356, NGC 1569, NGC 2276, and NGC 5792) with a large uncertainty, affects the derived total stellar mass of approximately 10 % at most, as obtained from the comparison of the star-masked and non-masked data.
We measured the typical radial extent of images and adopted it as a galaxy radius (hereafter ). We then constructed a radial distribution from the star-masked images using the galaxy parameters listed in table 2 and interpolated in spacing. The radius is defined as the radius where the radially averaged intensity becomes smaller than the dispersion () of the background pixels. This radius typically corresponds to a bending point of the radial profiles. The stellar distributions for the interacting galaxies were divided into each galaxy using the local minima near the line linking both galaxy centers. Individual radial profiles were then calculated. Our samples contained “no” clear overlapping regions in the interacting systems, which would, otherwise, complicate this approach. We make special note of NGC 660, where the extended optical emission indicates a and , which was quite different from the values adopted in table 2, although we adopted the former for putting a high priority on outer disc. The radial distribution of the four edge-on galaxies, namely NGC 891, NGC 3628, NGC 4302, and NGC 5907, which have inclinations higher than were made only using the data on the major axis.
is typically more than 30 % larger than . We compared both radii in figure 14a. Although most galaxies had a larger than , a few galaxies had smaller than (e.g., NGC 628). We also compared and the semi-major axis reported in the Spitzer Survey of Stellar Structure in Galaxies (S4G, Sheth et al. (2010)) for the 115 galaxies999The number of common samples between our survey and S4G is 116, but the semi-major axis of NGC 4647 is not listed. common between that and COMING (figure 14b).
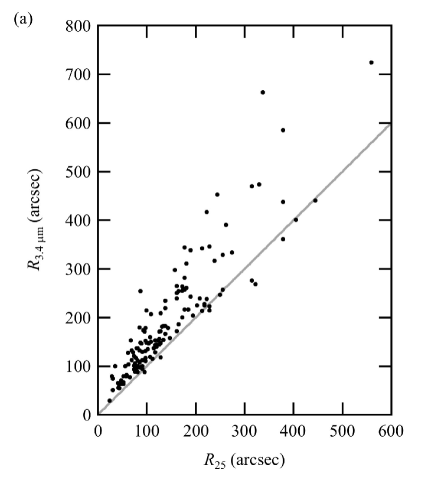
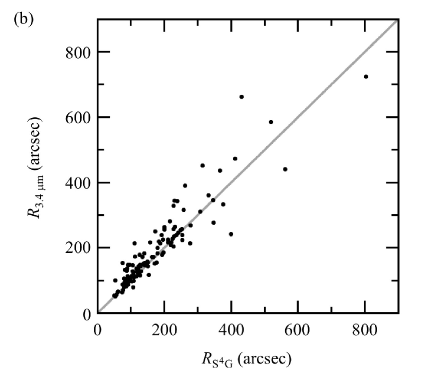
The total stellar mass of a galaxy was calculated from the star-masked images using the formula from Wen et al. (2013). The star-masked images were converted into luminosity scale using the adopted distance listed in table 2 within a projected ellipse, where was calculated. The total luminosity of a galaxy was converted into the total stellar mass according to the following equation (Wen et al. (2013)):
| (17) |
We did not consider herein the contribution from the active galactic nucleus (AGN) to the luminosity. Some interacting galaxies overlapped each other, and our image separation process resulted in a comparatively poorer flux accuracy in these systems. The stellar mass of NGC 660 was calculated within the ellipse projected using and (i.e., determined from CO). The stellar mass of the four edge-on galaxies was calculated within a rectangular region with the major axis length corresponding to . The pixel values along the lines parallel to the major axis were averaged. Its distribution in the direction perpendicular to the major axis was then used in the same way as measuring . The shorter axis was adopted to be twice this value.
We compared our derived stellar masses with those measured in S4G (Sheth et al. (2010); Muñoz-Mateos et al. (2013); Querejeta et al. (2015)) after substituting their adopted galaxy distance for our adopted value (figure 15). The comparison was done for 115 galaxies common to both samples. The errors were comparable to or smaller than the size of each marker, and we did not consider these errors because of the adopted models (i.e., only the contribution from the flux errors). The stellar mass derived in this work was typically approximately 20 % lower than that in the previous work, although the measured sizes were not necessarily common (figure 14b). This offset is mainly explained by our conservative star masking method which masks slightly larger area than the extent of stars and background subtraction. The offset cannot be explained by difference of the assumed IMFs, as it has a contrary effect (Zahid et al. (2012)): Kroupa IMF (Kroupa (2001)) for Wen et al. (2013) and Chabrier IMF (Chabrier (2003)) for S4G (Querejeta et al. (2015)). In addition, a minor offset was found between the WISE band and the Spitzer band at a higher magnitude (Wen et al. (2013)). Table 5.2 lists the total stellar masses and .
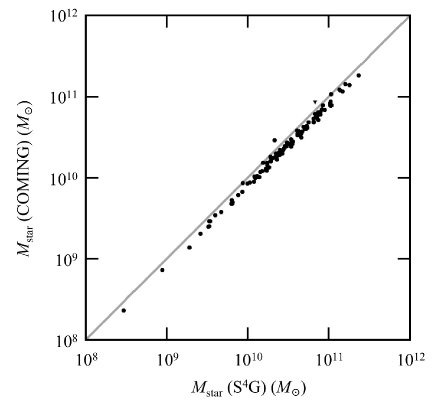
lcccc Measured radius, stellar mass, \atomC12\atomO luminosity, and molecular gas mass. galaxy \endfirstheadgalaxy \endhead\endfoot Notes. Column (1): Galaxy name. Same as the column (1) in table 2. Column (2): The radius () in arcsec. Column (3): Logarithmic total stellar mass in . Column (4): Logarithmic total integrated intensity of \atomC12\atomO in . Column (5): Logarithmic total molecular gas mass in . : Uncertain because of many foreground stars. : Slightly uncertain due to a foreground bright star and a spider diffraction pattern. : Uncertain due to a foreground star cluster. : Uncertain due to the Galactic emission. : Uncertain because of several foreground stars, including a bright one and spider diffraction patterns. : Slightly lower limit due to masking the channel corresponding to the Galactic emission. : Uncertain due to two foreground stars and spider diffraction patterns. : Slightly uncertain because of a foreground bright star. : Slight upper limit caused by not masking two slightly bright stars on the galaxy. : Upper limit due to a foreground bright star and spider diffraction patterns. \endlastfoot isolated galaxies IC 10 339 8.423 .008 5.915 .008 6.551 .008 NGC 150 129 10.425 .010 8.391 9.027 NGC 157 156 10.156 .009 8.412 .004 9.049 .004 NGC 278 105 10.336 8.693 .005 9.329 .005 NGC 337 99 9.953 .009 8.036 8.672 NGC 470 109 10.732 .010 8.805 .012 9.441 .012 NGC 520 155 9.462 .009 7.973 .003 8.609 .003 NGC 613 187 11.086 .010 9.395 .004 10.031 .004 NGC 628 277 10.247 8.653 .003 9.289 .003 NGC 660 247 10.436 .010 9.029 .002 9.665 .002 NGC 701 102 10.018 .009 8.140 8.776 NGC 891 401 10.638 .010 9.192 .001 9.828 .001 NGC 1022 129 10.185 8.444 .008 9.080 .008 NGC 1055 215 10.844 .010 9.327 .003 9.963 .003 NGC 1084 179 10.581 .010 8.875 .005 9.511 .005 NGC 1087 116 10.002 .009 8.139 8.775 NGC 1156 149 9.182 6.941 7.577 NGC 1241 109 11.142 .010 9.339 .009 9.975 .009 UGC 2765 140 10.236 8.317 .009 8.953 .009 NGC 1482 121 10.311 8.728 .005 9.364 .005 UGCA 86 30 6.729 .006 5.906 .017 6.542 .017 IC 356 298 11.318 9.179 .004 9.815 .004 NGC 1530 167 10.424 .010 8.882 .005 9.518 .005 NGC 1569 207 8.942 .008 6.090 6.726 NGC 2146 261 11.285 9.818 .002 10.454 .002 NGC 2273 118 10.665 .010 8.776 .009 9.412 .009 NGC 2339 101 10.790 .010 9.073 .006 9.709 .006 NGC 2268 132 10.618 .010 8.914 .008 9.550 .008 NGC 2276 180 10.866 .010 9.337 .005 9.973 .005 NGC 2633 94 10.406 .010 9.041 .004 9.677 .004 NGC 2681 151 10.427 .010 8.315 .008 8.951 .008 NGC 2742 113 10.421 .010 8.528 .012 9.164 .012 NGC 2715 158 10.010 .009 8.329 8.965 NGC 2775 209 10.712 .010 8.408 .009 9.044 .009 NGC 2748 130 10.121 .009 8.301 8.937 NGC 2782 148 9.938 .009 8.238 8.874 NGC 2841 453 10.898 .010 8.660 .004 9.296 .004 NGC 2903 438 10.608 .010 9.013 .002 9.649 .002 NGC 2967 101 10.208 8.713 .006 9.349 .006 NGC 2976 282 9.140 7.241 .006 7.877 .006 NGC 2985 235 10.799 .010 8.829 .007 9.465 .007 NGC 3034 663 10.293 8.896 .001 9.532 .001 NGC 3079 317 10.808 .010 9.443 .001 10.079 .001 NGC 3077 265 9.309 .009 7.016 7.652 NGC 3166 179 10.781 .010 8.619 .007 9.255 .007 NGC 3169 182 10.890 .010 9.136 .005 9.772 .005 NGC 3177 55 10.110 .009 8.622 .005 9.258 .005 NGC 3147 144 11.268 9.660 .003 10.296 .003 NGC 3198 329 10.128 .009 8.375 .006 9.011 .006 Mrk 33 52 9.581 .009 7.409 8.046 NGC 3310 174 9.829 .009 7.971 .008 8.607 .008 NGC 3338 217 10.479 .010 9.046 .005 9.682 .005 NGC 3344 214 10.077 .009 8.182 .008 8.818 .008 NGC 3351 239 10.388 .010 8.578 .004 9.214 .004 NGC 3367 89 10.497 .010 8.768 .007 9.404 .007 NGC 3359 226 10.300 8.924 .006 9.560 .006 NGC 3368 346 10.520 .010 8.373 .005 9.009 .005 NGC 3370 88 10.093 .009 8.375 .013 9.011 .013 NGC 3437 106 10.286 8.661 .009 9.297 .009 NGC 3471 64 9.934 .009 8.183 .012 8.819 .012 NGC 3521 474 11.066 .010 9.379 .002 10.015 .002 NGC 3556 391 10.245 8.759 .002 9.395 .002 NGC 3583 98 10.543 .010 8.771 9.407 NGC 3627 334 10.605 .010 9.031 .002 9.667 .002 NGC 3628 441 10.638 .010 9.123 .002 9.759 .002 NGC 3655 65 10.683 .010 9.208 .005 9.844 .005 NGC 3672 145 10.625 .010 8.942 .006 9.578 .006 NGC 3675 345 10.895 .010 9.123 .003 9.759 .003 NGC 3686 111 10.008 .009 8.399 .007 9.035 .007 NGC 3810 148 10.328 8.761 9.397 NGC 3813 154 10.263 8.611 .006 9.247 .006 NGC 3888 68 10.529 .010 8.632 9.268 NGC 3893 183 10.295 8.679 .004 9.315 .004 NGC 3938 173 10.431 .010 8.829 .004 9.465 .004 NGC 3949 149 10.203 8.149 .011 8.785 .011 UGC 6973 138 10.544 .010 9.001 .004 9.637 .004 NGC 4027 113 10.272 8.700 9.336 NGC 4030 172 11.077 .010 9.506 .003 10.142 .003 NGC 4041 112 10.685 .010 9.236 .005 9.872 .005 NGC 4045 138 10.628 .010 8.891 .009 9.527 .009 NGC 4085 133 10.023 .009 8.340 .010 8.976 .010 NGC 4088 201 10.390 .010 8.910 .003 9.546 .003 NGC 4214 258 8.864 .008 7.141 .010 7.777 .010 NGC 4258 725 10.551 .010 8.732 .002 9.368 .002 NGC 4303 205 10.773 .010 9.334 .003 9.970 .003 NGC 4433 78 10.625 .010 9.103 .006 9.739 .006 NGC 4527 217 10.688 .010 9.222 .003 9.858 .003 NGC 4536 224 10.464 .010 8.725 .005 9.361 .005 NGC 4559 269 9.679 .009 8.164 .005 8.800 .005 NGC 4579 258 10.839 .010 8.831 .005 9.467 .005 NGC 4605 256 9.401 .009 7.214 7.850 NGC 4602 136 10.754 .010 9.033 .007 9.669 .007 NGC 4632 113 9.700 .009 7.949 8.585 NGC 4666 220 10.573 .010 8.952 .003 9.588 .003 NGC 4750 128 10.618 .010 8.531 .011 9.167 .011 NGC 4753 311 11.146 .010 8.709 .009 9.345 .009 NGC 4818 173 9.940 .009 8.196 8.832 NGC 5005 264 10.922 .010 9.148 .003 9.784 .003 NGC 5055 586 10.737 .010 9.213 .002 9.849 .002 NGC 5248 217 10.369 8.958 .003 9.594 .003 NGC 5364 226 10.445 .010 8.636 .008 9.272 .008 NGC 5480 80 10.226 8.871 .008 9.507 .008 NGC 5678 215 10.895 .010 9.394 .003 10.030 .003 NGC 5665 82 9.790 .009 8.035 .011 8.671 .011 NGC 5676 145 10.940 .010 9.415 .003 10.051 .003 NGC 5713 98 10.296 8.830 .004 9.466 .004 NGC 5792 240 10.931 .010 8.896 .007 9.532 .007 NGC 5907 362 10.814 .010 9.076 .003 9.712 .003 NGC 6015 251 10.257 8.251 .013 8.887 .013 NGC 6503 343 9.682 .009 7.655 .006 8.291 .006 NGC 6574 64 10.974 .010 9.367 .006 10.003 .006 NGC 6643 138 10.471 .010 8.874 .005 9.510 .005 NGC 6764 133 10.117 .009 8.330 8.966 NGC 6951 154 10.873 .010 9.091 .005 9.727 .005 NGC 7331 470 10.935 .010 9.256 .002 9.892 .002 NGC 7448 88 10.346 8.674 .008 9.310 .008 NGC 7479 154 11.029 .010 9.427 .004 10.063 .004 NGC 7541 147 10.787 .010 9.070 .006 9.706 .006 NGC 7625 64 10.188 8.701 .005 9.337 .005 NGC 7721 120 10.411 .010 8.521 .011 9.157 .011 NGC 7798 56 10.301 8.628 .008 9.264 .008 interacting galaxies NGC 772 / NGC 770 11.186 .010 9.680 .004 10.316 .004 NGC 770 101 9.988 .009 8.715 9.351 NGC 772 228 11.157 .010 9.631 .004 10.267 .004 NGC 2207 / IC 2163 11.123 .007 9.364 .006 10.000 .006 NGC 2207 119 10.888 .010 9.093 .009 9.729 .009 IC 2163 95 10.745 .010 9.030 .009 9.666 .009 Arp 283 10.449 8.780 .009 9.416 .009 NGC 2798 94 10.392 .010 8.732 .009 9.368 .009 NGC 2799 101 9.542 .009 7.801 8.437 Arp 245 10.716 .008 8.973 .008 9.609 .008 NGC 2992 160 10.614 .010 8.742 .011 9.378 .011 NGC 2993 66 10.036 .009 8.589 .011 9.225 .011 Arp 094 10.748 .007 9.201 .004 9.837 .004 NGC 3226 172 10.256 8.774 9.410 NGC 3227 240 10.579 .010 8.997 .005 9.633 .005 NGC 4298 / NGC 4302 10.537 .007 9.043 .004 9.679 .004 NGC 4298 153 10.091 .009 8.773 .005 9.409 .005 NGC 4302 255 10.344 8.709 .005 9.345 .005 NGC 4383 / UGC 7504 9.751 8.483 .006 9.119 .006 UGC 7504 75 8.481 .008 7.691 8.327 NGC 4383 83 9.727 .009 8.407 .006 9.043 .006 Arp 269 9.438 .008 7.335 .007 7.971 .007 NGC 4485 113 8.363 .008 6.633 7.269 NGC 4490 243 9.400 .009 7.238 .007 7.874 .007 VV 219 10.575 .007 9.124 .003 9.760 .003 NGC 4567 147 10.084 .009 8.616 .006 9.252 .006 NGC 4568 183 10.406 .010 8.963 .003 9.599 .003 Arp 116 11.237 .009 8.993 .004 9.629 .004 NGC 4647 255 10.419 .010 8.808 .005 9.444 .005 NGC 4649 417 11.165 .010 8.531 .009 9.167 .009 Arp 271 10.985 9.557 .004 10.193 .004 NGC 5426 100 10.501 .010 9.047 .008 9.683 .008 NGC 5427 108 10.812 .010 9.397 .005 10.033 .005 Arp 090 10.744 .007 8.421 9.057 NGC 5929 80 10.292 7.900 8.536 NGC 5930 71 10.554 .010 8.266 8.902 Arp 284 10.472 .009 9.021 .009 9.657 .009 NGC 7714 80 10.428 .010 8.874 9.510 NGC 7715 118 9.462 .009 8.478 9.114
6 Results and discussion
6.1 Spectra, integrated intensity maps, and moment maps
Figure 16 presents a selection of \atomC12\atomO spectra with various velocity widths and also depicts the spectra of \atomC13\atomO and \atomC\atomO18 at the same position in the same galaxy. The \atomC13\atomO emission was typically several to 10 times weaker than the \atomC12\atomO emission; thus, the ratio of the \atomC13\atomO spectra was low despite the lower values of \atomC13\atomO compared to that of \atomC12\atomO. The \atomC\atomO18 emission was much weaker than the \atomC12\atomO emission. For example, the peak intensity of a \atomC\atomO18 spectrum of NGC 891 in figure 16 was , which was only a marginal detection. Only 14 positions in 11 galaxies showed the integrated intensity of \atomC\atomO18 exceeding and \atomC12\atomO exceeding . However, comparing these spectra with the \atomC12\atomO spectra at the same positions, two of the spectra appeared to be merely noise, while four cannot be clearly considered as detection.
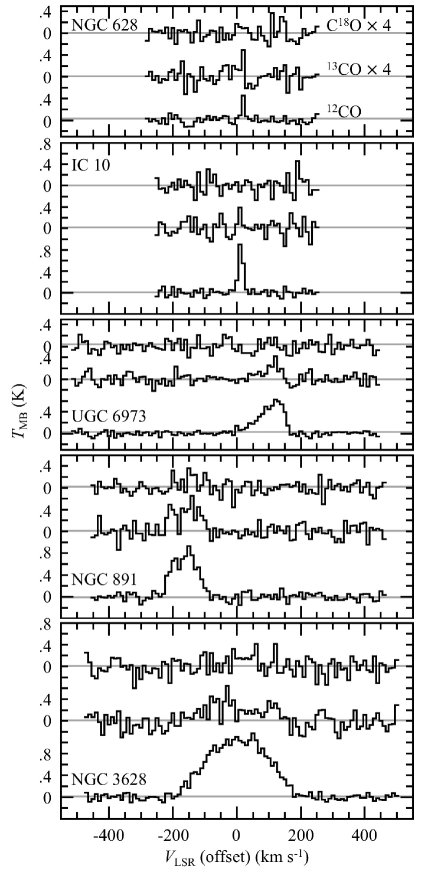
Panel (b) of figures 12 and 13 and supplementary figures 1 – 134 (supplementary section of the online version) show the integrated intensity maps of \atomC12\atomO. The ratio (or noise level) was not uniform within an integrated intensity map because of the different velocity widths of the emission channels. Thus, we drew contours at some percentiles of the maximum intensity in each map. We set the lowest contour levels to match the emission extent of the first-degree moment maps by eye because the first-degree moment maps were produced by smoothing and masking, and were likely to trace the real emission extent. Some galaxies showed a molecular gas distribution similar to the stellar distribution tracing spiral arms and/or a bar, while some showed quite different patterns (e.g., ring-like features), as reported in previous works (e.g., Young et al. (1995)). The radial distribution of molecular gas will be discussed in a forthcoming paper (Y. Miyamoto et al., in preparation). As described in subsection 3.1, the UGCA 86 and NGC 1569 spectra suffered from Galactic emission on the off-source positions. The velocity of the Galactic emission slightly overlapped in the case of NGC 1569; thus, the integrated intensity suffered from a lower limit. The Galactic emission overlapped in the case of UGC A86; therefore, the integrated intensity included the contribution from the Galactic emission.
Panel (e) of figures 12 and 13 and supplementary figures 3 – 130 (supplementary section of the online version) show the integrated intensity maps of \atomC13\atomO of select galaxies. The \atomC12\atomO integrated intensity in each map was overlaid as white contours [the same as panel (b)]. Magenta contours are the level representing the significance of the \atomC13\atomO integrated intensity detection. The percentile level of the lowest contour in most cases is the same as the lowest one of \atomC12\atomO, except in cases where the \atomC13\atomO map is noisy. The sensitivity of our observations in \atomC13\atomO was insufficient; thus, the integrated intensity maps for this line suffered from considerable noise contamination. We only presented herein the galaxies with more than higher than in the \atomC13\atomO integrated intensity and higher than in the \atomC12\atomO integrated intensity.
Figures 17 – 19 depict the correlation plots between the \atomC13\atomO and \atomC12\atomO integrated intensities according to Pearson’s product moment correlation coefficient between the integrated intensities []. Figure 17 shows the galaxies with , while figures 18 and 19 depict those with and , respectively. The data plotted in each panel are the pixels surrounded by the magenta contours in panel (e) of figures 12 and 13 and supplementary figures 3 – 130 (supplementary section of the online version). The correlation coefficient is an indicator of the resemblance, although the value does not necessarily reflect the apparent resemblance between the two maps.
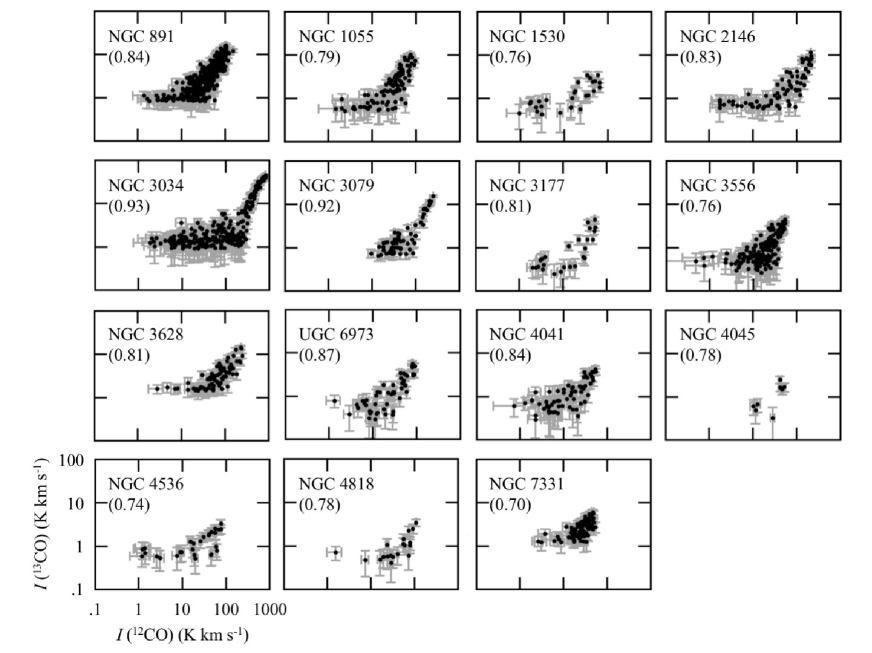
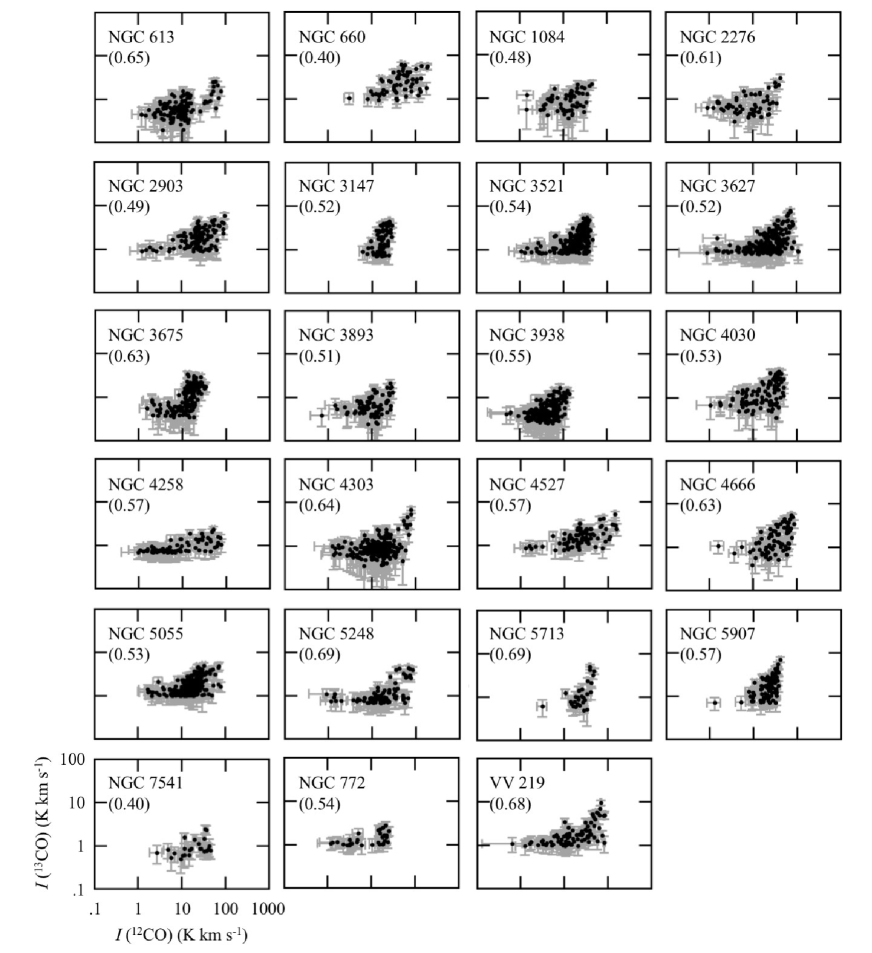
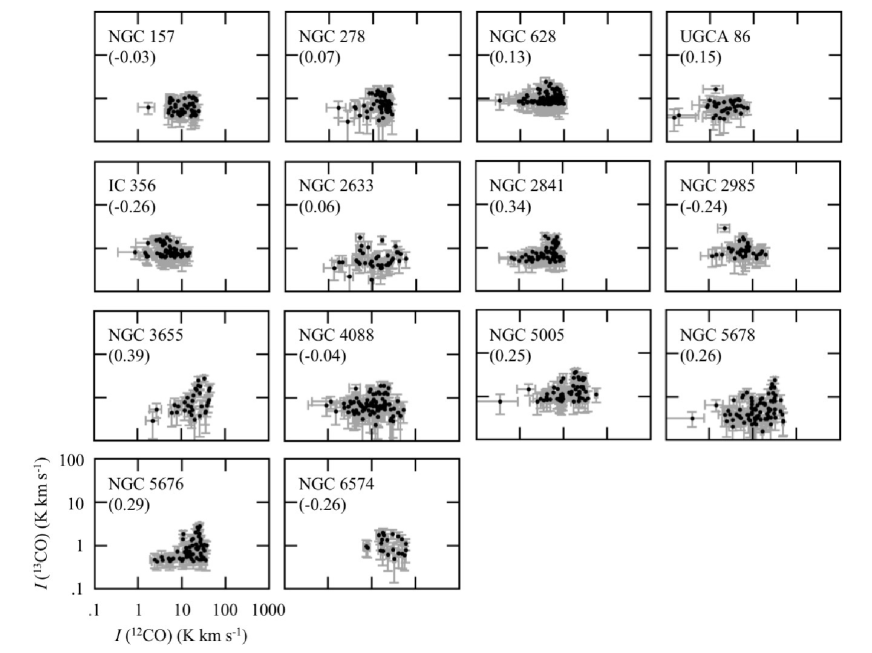
A comparison of the integrated intensity maps in both lines and correlation plots indicated that approximately 20 of the \atomC13\atomO integrated intensity maps (galaxies shown in figures 19 and 18) were noticeably different to or at least dissimilar to those of \atomC12\atomO, although the ratios of the \atomC13\atomO integrated intensity maps were poorer. About half of the lower shown in figure 19 (i.e., NGC 157, NGC 278, NGC 2633, NGC 3655, NGC 5005, NGC 5678, NGC 5676, and NGC 6574) and two galaxies in figure 18 (i.e., NGC 4030 and NGC 4258) exhibited a depletion of the \atomC13\atomO emission in the central region. These galaxies had an H \emissiontypeII region-like AGN, which suggests a \atomC13\atomO depletion in the central region (Taniguchi & Ohyama (1998); Taniguchi et al. (1999)). In NGC 3627, the \atomC12\atomO integrated intensity map showed the brightest peak at the center of the galaxy and two secondary peaks at each bar end, while the \atomC13\atomO integrated intensity map showed the brightest peak at the northern bar end as shown in Watanabe et al. (2011). In NGC 660 and NGC 4666, the \atomC12\atomO integrated intensity maps illustrated a single peak distribution located at the center of the galaxies, while the \atomC13\atomO maps presented another peak and the central one. In the case of NGC 660, the off-center peak was brighter than the central peak in \atomC13\atomO. The peaks at the two bar ends in the \atomC13\atomO integrated intensity map were found in NGC 4527. The enhancement of the \atomC13\atomO emission at the bar ends was caused by the higher molecular gas density (Watanabe et al. (2011); Yajima et al. (2019)).
The fact that the \atomC12\atomO and \atomC13\atomO maps significantly differed in some galaxies suggests that the physical properties of the molecular gas and/or abundances are not constant within a galaxy. We can also obtain the spectra with high significance in both \atomC\atomO lines when we stack the data with the same morphological characteristics (e.g., spiral arms or the bar) by aligning their spectra using the velocity field (Schruba et al. (2011); Morokuma-Matsui et al. (2015)). Such stacked \atomC13\atomO spectra were made and compared with \atomC12\atomO in Muraoka et al. (2016) and Yajima et al. (2019).
The integrated intensity maps of \atomC\atomO18 were only presented for NGC 891 (figure 12f or supplementary figure 12f), NGC 1055 (supplementary figure 14f), and NGC 3034 (supplementary figure 42f) in the supplementary section of the online version. These galaxies were those with more than higher than in \atomC\atomO18 integrated intensity and higher than in \atomC12\atomO integrated intensity. All these galaxies were edge-on; thus, the column density of the molecular gas can be obtained. The ratios of the \atomC\atomO18 integrated intensity maps were much lower than those of \atomC13\atomO because the \atomC\atomO18 emission was comparatively weaker. The stacking of spectra via velocity alignment could lead to the \atomC\atomO18 detection in some galaxies.
Panels (c) and (d) of figures 12 and 13 and supplementary figures 1 – 132 (supplementary section of the online version) show the first- and second-degree moment maps in \atomC12\atomO. These maps were made through masking (subsection 5.1); thus, the emission patterns in these maps were more smoothed and extended compared to the integrated intensity maps. However, even after this step, some spiky noise remained, and had a smearing effect on the moment maps. The discrepancy between the emission extents in the moment maps and the integrated intensity map was remarkable in the case where the emission in each pixel in the integrated intensity map was just below the threshold. One of the noticeable cases was that of IC 356. On the contrary, such masking created zero emission pixels for the first- and second-degree moment maps of some galaxies. These moment maps were not presented in the figures for the 19 galaxies, including the two paired galaxies.
Most of the first-degree moment maps presented a circular rotation pattern, while most of the second-degree moment maps presented the highest velocity dispersion in the central region of the galaxy. Such velocity fields made it possible to judge the receding side of the galaxy major axis. Table 2 shows the results. The velocity field of NGC 2967 in supplementary figure 39 predicted a very different PA from the one listed in table 2, which was derived from its outer disc (Salo et al. (2015)). A more detailed analysis also showed that the PA of the inner disc of NGC 2967 was different from the abovementioned adopted value (Salak et al. (2019)). The rotation curve of the molecular gas, PA, and i measured by fitting molecular gas distribution will be presented in Y. Miyamoto, et al. (in preparation). The molecular gas dynamics was discussed in Salak et al. (2019) along with the kinematically determined PA and i.
6.2 Mass
The total CO luminosity ( in units ; Solomon et al. (1992)) and the corresponding molecular mass () within the observed region were calculated. The CO emission was essentially confined within the mapped region (subsection 3.1); therefore, these luminosities and masses were effectively the total CO luminosity and the gas mass within . Table 5.2 lists both quantities. We did not use the total molecular gas mass in UGCA 86 hereafter because the estimated value had a large uncertainty, as described in subsection 6.1.
The distribution along the Hubble sequence indicates that galaxies with Sb and Sbc types have the tendency to host a larger molecular gas content, although the scatter is considerable (figure 20a). The geometric mean value of highlighted this trend, showing this peak and noticeably lower values in the irregular and peculiar galaxies. This trend was consistent with that in the previous works (Komugi et al. (2008)). The distribution of the total stellar mass () along the Hubble sequence was similar to that of the total molecular gas (figure 20b).
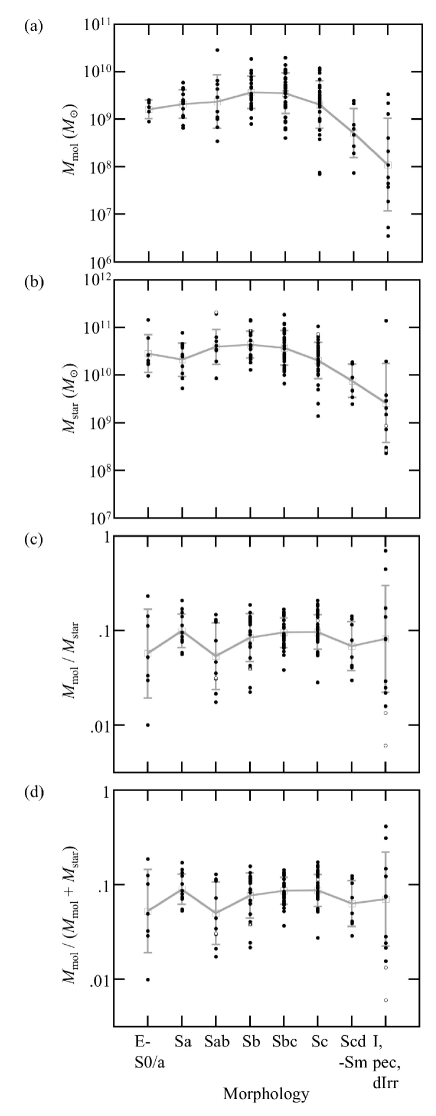
The fraction of the total molecular gas mass to the total stellar mass, , showed no clear trend against the Hubble type (figure 20c). Despite our sample having a strong bias toward molecular gas-rich FIR bright galaxies, these results were consistent with more complete observational samples [e.g., those of Saintonge et al. (2011) (showing no difference in the concentration index rather than the Hubble type), Boselli, et al. (2014b), Bolatto et al. (2017), and Young & Scoville (1991) (comparing the ratio of the molecular gas mass to the dynamical mass)]. We also showed herein the fraction of the total molecular gas mass to the total baryonic mass, that is, the sum of the molecular and stellar masses [] along the Hubble sequence in figure 20d. The molecular gas mass fraction was small; thus, the tendency of was very similar to that of . We ignored the atomic gas mass because it typically contributed much less than the molecular gas to the baryonic mass within a radius where the molecular gas was dominant (Honma et al. (1995)). Thus, hereafter, we used as a proxy for molecular gas to baryon ratio.
correlated with over three orders of magnitude (figure 21). That is, increased with . This trend was already predicted in figure 20, in which and behaved in a similar way, and was constant over the Hubble types. Although we applied the standard conversion factor to every location in each galaxy, the factor is not constant, and could depend on the physical and chemical conditions of molecular gas (e.g., Kennicutt & Evans (2012); Bolatto et al. (2013)). Deriving variable conversion factors in various positions in individual galaxies and calculating a more precise molecular gas mass will be reported in a future study. The relation between the molecular gas and the star formation in these samples was presented in Muraoka et al. (2019) and will be also reported in a future study.
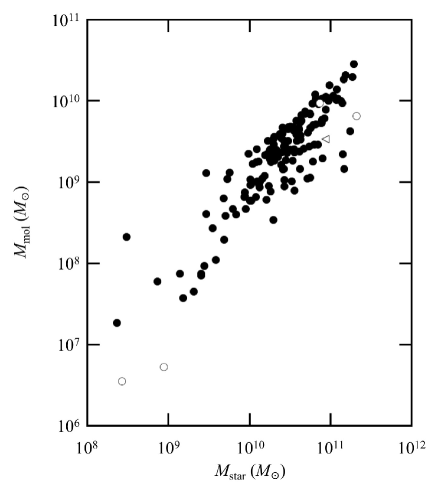
We also showed the relation between and in figure 22. The errors were comparable to or smaller than the size of each marker. The relation between both quantities was expected to provide a constraint on constructing the galaxy formation and evolution models (Morokuma-Matsui & Baba (2015); Saintonge et al. (2017)). The span was similar to the results for the local galaxies in the previous works, in which a decreasing trend after around (Jiang et al. (2015); Morokuma-Matsui & Baba (2015); Bolatto et al. (2017); Saintonge et al. (2017)) was observed. We also showed herein the same plots divided by the morphologies in figures 23 and 24. A power law was fitted in each plot (solid line). Table 6.2 lists the fitted slope and Pearson’s product moment correlation coefficient. Although no clear tendency was seen along the Hubble sequence, decreased with in the early-type galaxies (E – S0 and Sa), but increased in the late-type spirals (Sc and Scd – Sm). It also effectively showed an uncorrelated scatter in intermediate types and irregular galaxies (figure 23). The fraction seemed to increase with for the SB galaxies; however, no clear difference was seen among the SA and SAB galaxies (figure 24). Thus, this tendency probably resulted from the bias of our samples because SB had predominantly less massive galaxies with irregular or peculiar morphology.
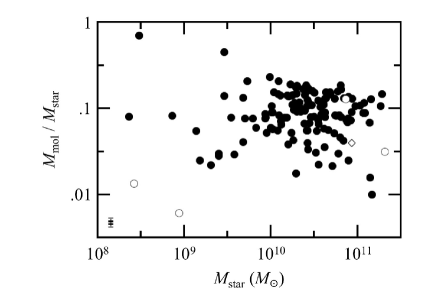
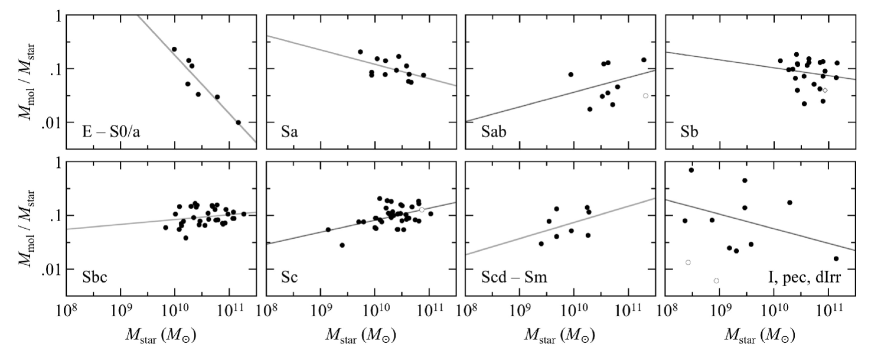
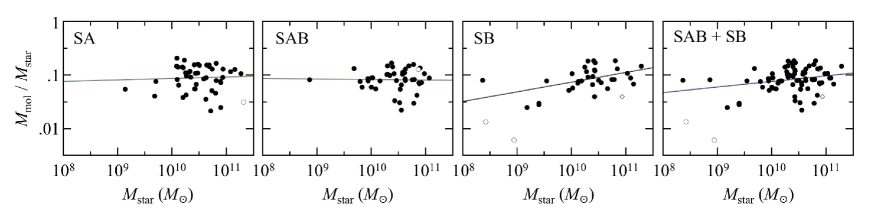
Correlation between the total molecular gas mass fraction and the total stellar mass. Morphology Samples Power∗*∗*footnotemark: Correlation coefficient Remarks Hubble types E – S0/a 7 -1.09 -0.92 Sa 13 -0.27 -0.52 Sab 10 0.27 0.28 ††{\dagger}††{\dagger}footnotemark: Sb 23 -0.15 -0.16 ‡‡{\ddagger}‡‡{\ddagger}footnotemark: Sbc 34 0.09 0.21 Sc 39 0.22 0.46 §§\S§§\Sfootnotemark: Scd – Sm 8 0.30 0.40 I, pec, dIrr 13 -0.27 -0.39 ∥parallel-to\parallel∥parallel-to\parallelfootnotemark: with or without a bar SA 47 0.03 0.05 ††{\dagger}††{\dagger}footnotemark: SAB 44 -0.01 -0.02 §§\S§§\Sfootnotemark: SB 36 0.18 0.48 ♯♯\sharp♯♯\sharpfootnotemark: SAB + SB 80 0.10 0.25 ∗∗**∗∗**footnotemark: {tabnote} ∗*∗*footnotemark: : Index in .
: IC 356 is included in the number of samples, but not in the statistics. ‡‡{\ddagger}‡‡{\ddagger}footnotemark: : NGC 5792 is included in the number of samples, but not in the statistics. §§\S§§\Sfootnotemark: : NGC 2276 is included in the number of samples, but not in the statistics. ∥parallel-to\parallel∥parallel-to\parallelfootnotemark: : IC 10 and NGC 1569 are included in the number of samples, but not in the statistics. ♯♯\sharp♯♯\sharpfootnotemark: : IC 10, NGC 1569, and NGC 5792 are included in the number of samples, but not in the statistics. ∗∗**∗∗**footnotemark: : IC 10, NGC 1569, NGC 2276, and NGC 5792 are included in the number of samples, but not in statistics.
6.3 Molecular gas content in the barred and non-barred spirals
Figures 25 – 27 show a comparison of the distributions of , , and over different bar morphological types. The and histograms for the non-barred and barred spirals were very similar, although some SB galaxies had a very low or . A Kolmogorov-Smirnov (K-S) test cannot reject the null hypothesis that the or distribution coincides in the barred and non-barred spirals at a significant level of 10 %. The fraction did not correlate with the presence of bars, with each type spanning the same range of , although there seems a slight preference for higher values in the SA galaxies. A K-S test cannot reject the null hypothesis that the two populations are drawn from the same distribution at a significant level of 10 %.
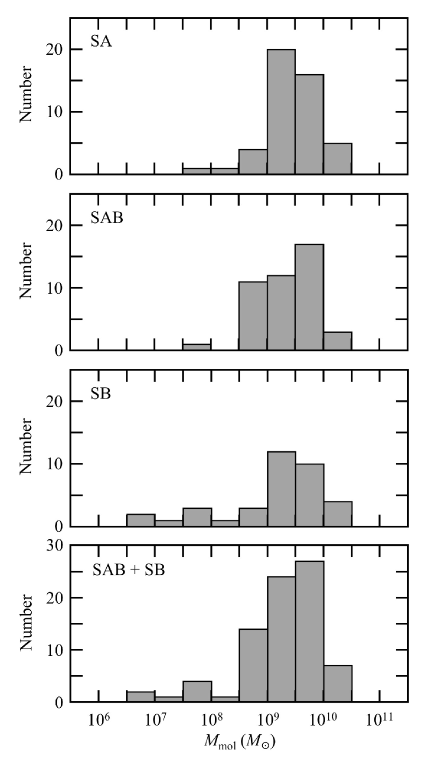
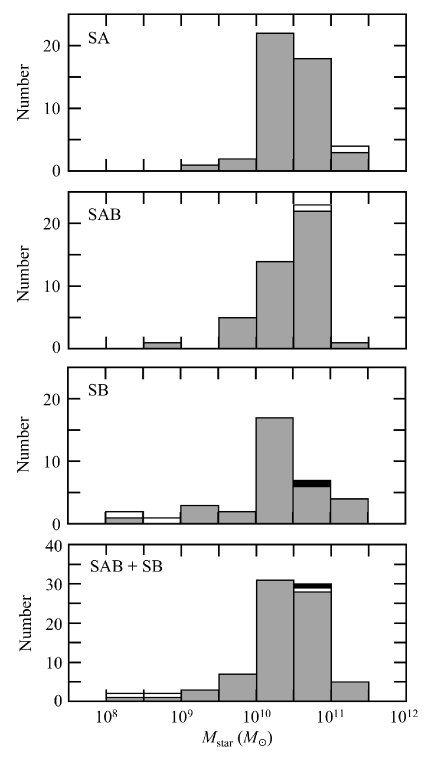
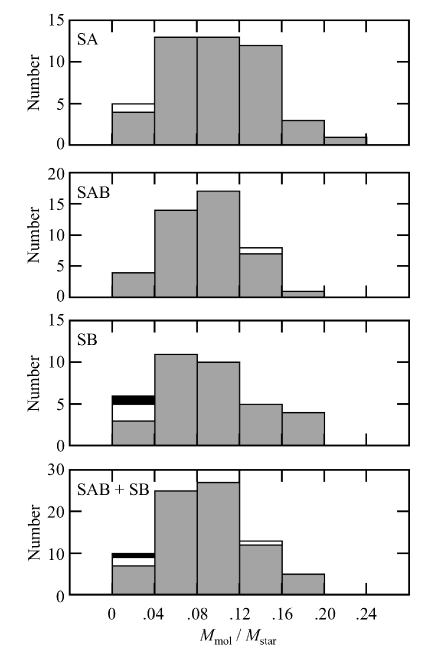
In contrast to our results that , , and do not depend on the bar presence, previous works showed that may be lower in the barred spirals. Figure 28 shows the histograms of and for the non-barred and barred galaxies, respectively, in the EDGE sample (Bolatto et al. (2017)). Data from the COMING overlaid as dashed lines suggested that the barred spiral galaxies in our sample were less massive in and prone to have a higher . The EDGE sample consisted of rather more massive galaxies in stellar mass than the COMING samples, especially for the barred spiral galaxies. A K-S test indicated the hypothesis that both survey samples coming from the same population are rejected at 1 % significance. Although the K-S test did not indicate a significant difference for the non-barred galaxies between both samples, it implied that the hypothesis was rejected at 2.5 % significance for the barred galaxies. The possibility of a lower in the barred galaxies was suggested in Bolatto et al. (2017), although their K-S test indicated a low significance.
Our sample selection was biased toward the FIR bright galaxies, that is, gas-rich galaxies, which may result in this discrepancy. Figure 29 shows the fraction of the barred galaxies in our sample (SABSB) () for a given as well as that of EDGE (Bolatto et al. (2017)) and S4G (Díaz-García et al. (2016)). The dependency of on was different from the previous works. Díaz-García et al. (2016) indicated that the bar fraction increased with the stellar mass in the S4G samples. Algorry et al. (2017) studied the population of the barred galaxies in the EAGLE cosmological simulation and found that the gas mass fraction decreased with the bar strength parameter. In other words, barred spiral galaxies were prone to having a lower gas mass fraction. Spinoso et al. (2017) predicted that gas is driven inward and consumed by star formation in the barred galaxies in cosmological simulations. Observational results also concurred with those predictions (Cheung et al. (2013); Chown et al. (2019)). Our sample consisted of gas-rich galaxies; barred spiral galaxies with high and low were not included; and those with lower and higher were selectively included in our sample, thereby causing similar , , and distributions between the barred and non-barred spiral galaxies seen in our sample.
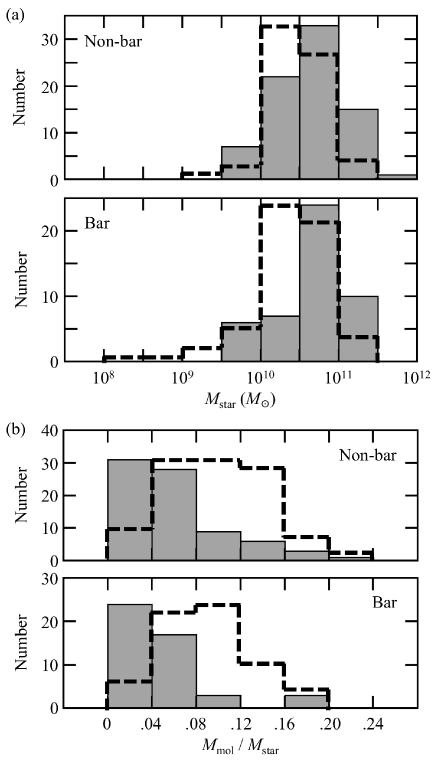
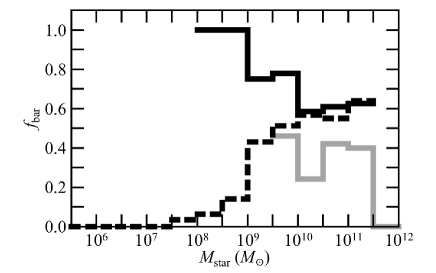
7 Summary and conclusion
In this study, we simultaneously conducted COMING, an OTF-mapping survey project, targeting 147 nearby galaxies in \atomC12\atomO, \atomC13\atomO, and \atomC\atomO18 lines using the NRO 45 m radio telescope. The spatial resolution was \timeform17”. The velocity resolution was set to . The sensitivity was typically . Each mapping region covered 70 % of the optical diameter , which was expected to encompass all CO emissions, as indicated by the previous observations. The targets were selected from nearby galaxies based on the FIR flux. In other words, they were strongly biased to the FIR brightness. Some interacting galaxies were selected despite not satisfying the selection criteria because the counterpart of the paired galaxies satisfied the criteria. We only completed observations for 147 out of the 238 galaxies in the selected sample because of the observing limitations. The fractions of the barred and non-barred galaxies in the sample were similar, but we concentrated on those with the Hubble-type Sb–Sc. The galaxies with smaller disc lengths were a dominant component of the observed sample. The FITS cubes with \timeform6” spacing in the three lines are publicly available at the JVO archive.
We developed an observation ranking system and automatic data reduction tools to optimize resource observation and ensure that reduction is fully reproducible and highly efficient. We quantified the relative positions between the direction of the telescope and the available targets and made assessments based on the target elevation and size while considering the system noise and other factors to maximize the quantity of the observed galaxies in the allotted time. This system was introduced in the last two observation seasons and resulted in the reduction of the total observing time to complete a map typically by 37 %. We also developed the tools auto-flag and auto-rebase. The former quantified the undulation of the spectral baselines and removed heavily undulated spectra in the OTF data. Meanwhile, auto-rebase determined the zero levels in the spectra with ambiguous features. These tools are a part of the COMING ART python package designed to optimize the objectivity and reproducibility of the reduction process.
The radii and the total stellar mass of the observed galaxies were measured from the WISE archival data. The radius, , was 30 % larger than the optical radius for most targets. The total stellar mass, , was measured within following the method of Wen et al. (2013). Our derived was approximately 20 % less massive than the mass derived in S4G (Sheth et al. (2010)) for 115 overlapping galaxies between our project and S4G. The offset may be caused by our conservative star masking method which masks slightly larger area than the extent of stars and background subtraction, and possibly a minor offset between the WISE band and the Spitzer band flux at a higher magnitude (Wen et al. (2013)).
The \atomC12\atomO emission was detected in most of the observed galaxies, while the \atomC13\atomO emission was detected in approximately a third of the galaxies with a low ratio. The \atomC\atomO18 emission was detected in only targets. Some integrated intensity maps in \atomC12\atomO indicated a similar distribution to the stellar distribution, while some displayed quite different morphologies. Some galaxies also showed differences in the locations of the \atomC12\atomO and \atomC13\atomO emission, although the ratio of \atomC13\atomO was rather low in most cases. This result implied that the molecular gas properties in the galactic discs were not uniform. The \atomC\atomO18 maps were only successfully created in three of our targets, namely NGC 891, NGC 1055 and NGC 3034. Additionally, the first- and second-degree moment maps in \atomC\atomO were created for the majority of our sample.
The total molecular gas mass, , measured using the standard conversion factor correlated well with over three orders of magnitude. Moreover, the ratio did not depend on the Hubble type. Galaxies with Sb and Sbc types have the tendency to host a larger or , although the scatter is considerable. The trend of relation was consistent with that in the previous works, although the scatter was considerable. However, seemed to decrease with in early-type galaxies and vice versa in late-type galaxies.
and did not show dependence on the presence of bars, but this was likely the result of our sample selection criteria. We saw no differences in the mass distribution of and between the barred and non-barred spirals; however, we found that the SB types had a lower mass tail in the and distribution. No difference of was seen between the barred and non-barred spirals, although the previous works suggested the possibility of a comparatively lower in the barred spirals (Bolatto et al. (2017)). The fraction of the barred spirals as a function of also showed a trend opposite to that in the previous works. This difference was caused by our sample selection, in which we prioritized observing the FIR bright (thus, molecular gas-rich) galaxies. The barred spirals are effective at funneling molecular gas toward their central regions, resulting in a molecular gas deficit in their discs. Thus, the molecular gas-rich barred spirals had a lower .
This survey was conducted toward approximately 150 galaxies, observing the \atomC12\atomO distribution over their entire disc area and revealing the large-scale distribution of their entire molecular gas budget. These data act as a benchmark for comparison with the targeted observations of more distant galaxies, interferometric observations of our sample galaxies, observations in higher- lines, and those with very high spatial resolutions of specific regions of external galaxies. Our sample was composed of nearby galaxies, and, as such, a wealth of archival data across multiple wavelengths was already available. Thus, COMING acts as an excellent resource for studies of the interstellar medium and star formation in galaxies on kpc scales.
Supplementary data
The following supplementary data is available at PASJ online.
Supplementary figures 1–134. WISE image, integrated intensity map, first-degree moment map and second-degree moment map of \atomC12\atomO for all the observed galaxies [panels (c) and (d) were not presented in 17 figures], integrated intensity maps of \atomC13\atomO , and \atomC\atomO18 for some galaxies are shown in each figure.
The authors thank the referee for very many and invaluable comments and suggestions, which significantly improved the manuscript. We would also like to gratefully acknowledge Alex Pettitt for his helping to improve the paper greatly. We are grateful to the NRO staff for the operation of the 45 m telescope and their continuous efforts to improve the performance of the instruments. This work is based on one of the legacy programs of the Nobeyama 45 m radio telescope, which is operated by Nobeyama Radio Observatory, a branch of National Astronomical Observatory of Japan. This research has made use of the NASA/IPAC Extragalactic Database (NED) which is operated by the Jet Propulsion Laboratory, California Institute of Technology, under contract with the National Aeronautics and Space Administration. This publication makes use of data products from the Wide-field Infrared Survey Explorer, which is a joint project of the University of California, Los Angeles, and the Jet Propulsion Laboratory/California Institute of Technology, funded by the National Aeronautics and Space Administration. HK is supported by JSPS KAKENHI Grant Number 18K13593.
References
- Alatalo et al. (2013) Alatalo, K., et al. 2013, MNRAS, 432, 1796
- Alatalo et al. (2015) Alatalo, K., et al. 2015, MNRAS, 450, 3874
- Algorry et al. (2017) Algorry, D. G., et al. 2017, MNRAS, 469, 1054
- Anderson & Ulvestad (2005) Anderson, J. M., & Ulvestad, J. S. 2005, ApJ, 627, 674
- Antonio García-Barreto & Rosado (2001) Antonio García-Barreto, J., & Rosado, M. 2001, AJ, 121, 2540
- Argyle & Eldridge (1990) Argyle, R. W., & Eldridge, P. 1990, MNRAS, 243, 504
- Arnold et al. (2014) Arnold, J. A., et al. 2014, ApJ, 791, 80
- Ball et al. (1986) Ball R. 1986, ApJ, 307, 453
- Bauermeister et al. (2013) Bauermeister, A., et al. 2013, ApJ, 768, 132
- Becker et al. (1995) Becker, R. H., White, R. L., & Helfand, D. J. 1995, ApJ, 450, 559
- Bolatto et al. (2017) Bolatto, A. D., et al. 2017, ApJ, 846, 159
- Bolatto et al. (2013) Bolatto, A. D., Wolfire, M., & Leroy, A. K. 2013, ARA&A, 51, 207
- Boselli et al. (2014a) Boselli, A., Cortese, L., & Boquien, M. 2014a, A&A, 564, 65
- Boselli, et al. (2014b) Boselli, A., Cortese, L., Boquien, M., Boissier, S., Catinella, B., Lagos, C., & Saintonge, A. 2014b, A&A, 564, 66
- Bottinelli et al. (1984a) Bottinelli, L., Gouguenheim, L., Paturel, G., & de Vaucouleurs, G. 1984a, A&AS, 56, 381
- Bottinelli et al. (1984b) Bottinelli, L., Gouguenheim, L., Paturel, G., & Teerikorpi, P. 1984b, A&A, 156, 157
- Bravo-Alfaro et al. (2004) Bravo-Alfaro, H., Brinks, E., Baker, A. J., Walter, F., & Kunth, D. 2004, AJ, 127, 264
- Bresolin et al. (2005) Bresolin, F., Schaerer, D., González, R. M., & Stasińska, G. 2005, A&A, 441, 981
- Broeils & van Woerden (1994) Broeils, A. H., & van Woerden, H. 1994, A&AS, 107, 129
- Bushouse et al. (1998) Bushouse, A. H., Telesco, C. M., & Werner, M. W. 1998, AJ, 115, 938
- Cao et al. (2017) Cao, Y., Wong, T., Xue, R., Bolatto, A. D., Blitz, L., Vogel, S. N., Leroy, A. K., & Rosolowsky, E. 2017, ApJ, 847, 33
- Caso et al. (2015) Caso, J. P., Bassino, L. P., & Gómez, M. 2015, MNRAS, 453, 4421
- Chabrier (2003) Chabrier, G. 2003, ApJ, 586, L133
- Cheung et al. (2013) Cheung, E., et al. 2013, ApJ, 779, 162
- Chown et al. (2019) Chown, R., et al. 2019, MNRAS, 484, 5192
- Chung et al. (2009a) Chung, A., van Gorkom, J. H., Kenney, J. D. P., Crowl, H., & Vollmer, B. 2009a, AJ, 138, 1741
- Chung et al. (2009b) Chung, E. J., Rhee, M. -H., Kim, H., Yun, M. S., Heyer, M., & Young, J. S. 2009b, ApJS, 184, 199
- Clements (1981) Clements, E. D. 1981, MNRAS, 197, 829
- Clements (1983) Clements, E. D. 1983, MNRAS, 204, 811
- Colombo et al. (2014) Colombo, D., et al. 2014, ApJ, 784, 3
- Condon & Broderick (1991) Condon, J. J., & Broderick, J. J. 1991, AJ, 102, 1663
- Condon et al. (1998) Condon, J. J., Cotton, W. D., Greisen, E. W., Yin, Q. F., Perley, R. A., Taylor, G. B., & Broderick, J. J. 1998, AJ, 115, 1693
- Cooray et al. (2019) Cooray, S., Takeuchi, T. T., Yoda, M., & Sorai, K. 2019, PASJ, submitted
- Cormier et al. (2018) Cormier, D., et al. 2018, MNRAS, 475, 3909
- Crosthwaite et al. (2002) Crosthwaite, L. P., Turner, J. L., Buchholz, L., Ho, P. T. P., & Martin, R. N. 2002, AJ, 123, 1892
- Daddi et al. (2010) Daddi, E., et al. 2010, ApJ, 713, 686
- Daigle et al. (2006) Daigle, O., Carignan, C., Amram, P., Hernandez, O., Chemin, L., Balkowski, C., & Kennicutt, R. 2006, MNRAS, 367, 469
- de Blok et al. (2008) de Blok, W. J. G., Walter, F., Brinks, E., Trachternach, C., Oh, S-H., & Kennicutt, R. C., Jr. 2008, AJ, 136, 2648
- Dessauges-Zavadsky et al. (2015) Dessauges-Zavadsky, M., et al. 2015, A&A, 577, 50
- Dessauges-Zavadsky et al. (2017) Dessauges-Zavadsky, M., et al. 2017, A&A, 605, 81
- de Vaucouleurs et al. (1991) de Vaucouleurs, G., de Vaucouleurs, A., Corwin Jr., H. G., Buta, R. J., Paturel, G., & Fouque, P. 1991, Third Reference Catalogue of Bright Galaxies (New York: Springer)
- Dhungana et al. (2016) Dhungana, G., et al. 2016, ApJ, 822, 6
- Díaz et al. (2003) Díaz, R. J., Dottori, H., Vera-Villamizar, N., & Carranza, G. 2003, ApJ, 597, 860
- Díaz-García et al. (2016) Díaz-García, S., Salo, H., Laurikainen, E., & Herrera-Endoqui, M. 2016, A&A, 587, 160
- Donovan Meyer et al. (2013) Donovan Meyer, J., et al. 2013, ApJ, 772, 107
- Elmegreen et al. (1995) Elmegreen, D. M., Kaufman, M., Brinks, E., Elmegreen, B. G., & Sundin, M. 1995, ApJ, 453, 100
- Emerson & Gräve (1988) Emerson, D. T., & Gräve, R., 1988, A&A, 190, 353
- Epinat et al. (2008a) Epinat, B., Amram, P., & Marcelin, M. 2008a, MNRAS, 390, 466
- Epinat et al. (2008b) Epinat, B., et al. 2008b, MNRAS, 388, 500
- Erroz-Ferrer et al. (2015) Erroz-Ferrer, et al. 2015, MNRAS, 451, 1004
- Evans et al. (2010) Evans, I. N., et al. 2010, ApJS, 189, 37
- Fingerhut et al. (2010) Fingerhut, R. L., et al. 2010, ApJ, 716, 792
- Fiorentino et al. (2013) Fiorentino, G., Musella, I., & Marconi, M. 2013, MNRAS, 434, 2866
- Fraser-McKelvie et al. (2016) Fraser-McKelvie, A., Brown, M. J. I., Pimbblet, K. A., Dolley, T., Crossett, J. P., & Bonne, J. 2016, MNRAS, 462, L11
- Friedrich et al. (2010) Friedrich, S., Davies, R. I., Hicks, E. K. S., Engel, H., Müller-Sánchez, F., Genzel, R., & Tacconi, L. J. 2010, A&A, 519, 79
- Fuentes-Carrera et al. (2004) Fuentes-Carrera, I., et al. 2004, A&A, 415, 451
- García-Burillo et al. (1993) García-Burillo, S., Guélin, M., & Cernicharo, J. 1993, A&A, 274, 123
- García-Burillo et al. (1997) García-Burillo, S., Guélin, M., & Neininger, N. 1997, A&A, 319, 450
- García Gómez & Athanassoula (1993) García Gómez, C., & Athanassoula, E. 1993, A&AS, 100, 431
- Garrido et al. (2002) Garrido, O., Marcelin, M., Amram, P., & Boulesteix, J. 2002, A&A, 387, 821
- Geha et al. (2005) Geha, M., Guhathakurta, P, & van der Marel, R. P. 2005, AJ, 129, 2617
- Guhathakurta et al. (1988) Guhathakurta, P., van Gorkom, J. H., Kotanyi, C. G., & Balkowski, C. 1988, AJ, 96, 851
- Haan et al. (2008) Haan, S., Schinnerer, E., Mundell, C. G., García-Burillo, S., & Combes, F. 2008, AJ, 135, 232
- Hatakeyama et al. (2017) Hatakeyama, T., et al. 2017, PASJ, 69, 67
- Helfer et al. (2003) Helfer, T. T., Thornley, M. D., Regan, M. W., Wong, T., Sheth, K., Vogel, S. N., Blitz, L., & Bock, D. C.-J. 2003, ApJS, 145, 259
- Helou & Walker (1988) Helou, G., & Walker, D. W. 1988, Infrared astronomical satellite (IRAS) catalogs and atlases. Volume 7
- Hernandez et al. (2005) Hernandez, O., Carignan, C., Amram, P., Chemin, L., & Daigle, O. 2005, MNRAS, 360, 1201
- Herrnstein et al. (2005) Herrnstein, J. R., Moran, J. M., Greenhill, L. J., & Trotte, A. S. 2005, ApJ, 629, 719
- Honma et al. (1995) Honma, M., Sofue, Y., & Arimoto, N. 1995, A&A, 304, 1
- Hota & Saikia (2006) Hota, A., & Saikia, D. J. 2006, MNRAS, 371, 945
- Huchra et al. (1999) Huchra, J. P., Vogeley, M. S., & Geller, M. J. 1999, ApJS, 121, 287
- Hunt et al. (2008) Hunt, L. K., et al. 2008, A&A, 482, 133
- Hunter et al. (2012) Hunter, D. A., et al. 2012, AJ, 144, 134
- Irwin & Sofue (1996) Irwin, J. A., & Sofue, Y. 1996, ApJ, 464, 738
- Jackson et al. (2007) Jackson, N., Battye, R. A., Browne, I. W. A., Joshi, S., Muxlow, T. W. B., & Wilkinson, P. N. 2007, MNRAS, 376, 371
- James et al. (2004) James, P. A., et al. 2004, A&A, 414, 23
- Jarrett et al. (2003) Jarrett, T. H., Chester, T., Cutri, R., Schneider, S. E., & Huchra, J. P. 2003, AJ, 125, 525
- Jiang et al. (2015) Jiang, X.-J., Wang, Z., Gu, Q., Wang, J., & Zhang, Z.-Y. 2015, ApJ, 799, 92
- Kamazaki et al. (2012) Kamazaki, T., et al. 2012, PASJ, 64, 29
- Kaneko et al. (2013) Kaneko, H., Kuno, N., Iono, D., Tamura, Y., Tosaki, T., Nakanishi, K., & Sawada, T. 2013, PASJ, 65, 20
- Kautsch et al. (2006) Kautsch, S. J., Grebel, E. K., Barazza, F. D., & Gallagher III, J. S. 2006, A&A, 445, 765
- Kenney & Young (1988) Kenney, J. D., & Young, J. S. 1988, ApJS, 66, 261
- Kennicutt & Edgar (1986) Kennicutt, R. C., Jr., & Edgar, B. K. 1986, ApJ, 300, 132
- Kennicutt & Evans (2012) Kennicutt, R. C., Jr., & Evans II, N. J. 2012, ARA&A, 50, 531
- Kim et al. (2012) Kim, S. C., Park, H. S., Kyeong, J., Lee, J. H., Ree, C. H., & Kim, M. 2012, PASJ, 64, 23
- King & Irwin (1997) King, D., & Irwin, J. A. 1997, New Astron., 2, 251
- Koda et al. (2009) Koda, J., et al. 2009, ApJ, 700, L132
- Koda et al. (2012) Koda, J., et al. 2012, ApJ, 761, 41
- Koda et al. (2002) Koda, J., Sofue, Y., Kohno, K., Nakanishi, H., Onodera, S., Okumura, S. K., & Irwin, J. A. 2002, ApJ, 573, 105
- Komugi et al. (2008) Komugi, S., Sofue, Y., Kohno, K., Nakanishi, H., Onodera, S., Egusa, F., & Muraoka, K. 2008, ApJS, 178, 225
- Koopmann et al. (2001) Koopmann, R. A., Kenney, J. D. P., Young, J. 2001, ApJS, 135, 125
- Kregel & Sancisi (2001) Kregel, M., & Sancisi, R. 2001, A&A, 376, 59
- Krips (2007) Krips, M. 2007, A&A, 464, 553
- Kroupa (2001) Kroupa, P. 2001, MNRAS, 322, 231
- Kuno et al. (2007) Kuno, N., et al. 2007, PASJ, 59, 117
- Kuno et al. (2011) Kuno, N., et al. 2011, General Assembly and Scientific Symposium, XXXth URSI, JP2-19
- Kuno & Nakai (1997) Kuno, N., & Nakai, N. 1997, PASJ, 49, 279
- Kuno et al. (1997) Kuno, N., Tosaki, T., Nakai, N., & Nishiyama, K. 1997, PASJ, 49, 275
- Kuzio de Naray et al. (2012) Kuzio de Naray, R., Arsenault, C. A., Spekkens, K., Sellwood, J. A., McDonald, M., Simon, J. D., & Teuben, P. 2012, MNRAS, 427, 2523
- Laine & Gottesman (1998) Laine, S., & Gottesman, S. T. 1998, MNRAS, 297, 1041
- Lelli et al. (2014) Lelli, F., Verheijen, M., & Fraternali, F. 2014, A&A, 566, 71
- Leroy et al. (2009) Leroy, A. K., et al. 2009, AJ, 137, 4670
- Leroy et al. (2013) Leroy, A. K., et al. 2013, AJ, 146, 19
- Li et al. (1993) Li, J. G., Seaquist, E. R., Wrobel, J. M., Wang, Z., & Sage, L. J. 1993, ApJ, 413, 150
- Li et al. (1998) Li, W. D., Modjaz, M., Halderson, E., Shefler, T., King, J. Y., Treffers, R. R., Filippenko, A. V. 1998, IAU Circ., 6978, 3
- Lindt-Krieg et al. (2008) Lindt-Krieg, E., Eckart, A., Neri, R., Krips, M., Pott, J. -U., García-Burillo, S., & Combes, F. 2008, A&A, 479, 377
- Liu & Bregman (2005) Liu, J.-F., & Bregman, J. N. 2005, ApJS, 157, 59
- Lynds (1980) Lynds, B. T. 1980, ApJ, 238, 17
- Masters et al. (2010) Masters, K. L., et al. 2010, MNRAS, 405, 783
- Mathewson et al. (1992) Mathewson, D. S., Ford, V. L., & Buchhorn, M. 1992, ApJS, 81, 413
- Mei et al. (2007) Mei, S., et al. 2007, ApJ, 655, 144
- Meidt et al. (2013) Meidt, S. E., et al. 2013, ApJ, 779, 45
- Minamidani et al. (2016) Minamidani, T., et al. 2016, Proc. SPIE 9914, Millimeter, Submillimeter, and Far-Infrared Detectors and Instrumentation for Astronomy VIII, 99141Z
- Minchin et al. (2010) Minchin, R. F., et al. 2010, AJ, 140, 1093
- Miyamoto et al. (2018) Miyamoto, Y., Seta, M., Nakai, N., Watanabe, Y., Salak, D., & Ishii, S. 2018, PASJ, 70, L1
- Momose et al. (2013) Momose, R., et al. 2013, ApJ, 772, L13
- Momose et al. (2010) Momose, R., Okumura, S. K., Koda, J., & Sawada, T. 2010, ApJ, 721, 383
- Monet (1998) Monet, D. 1998, USNO-A2.0, U.S. Naval Observatory
- Morokuma-Matsui & Baba (2015) Morokuma-Matsui, K., & Baba, J. 2015, MNRAS, 454, 3792
- Morokuma-Matsui et al. (2015) Morokuma-Matsui, K., Sorai, K., Watanabe, Y., & Kuno, N. 2015, PASJ, 67, 2
- Moshir et al. (1990) Moshir, M., et al. 1990, Infrared Astronomical Satellite Catalogs, The Faint Source Catalog, Version 2.0
- Mühle et al. (2005) Mühle, S., Klein, U., Wilcots, E. M., & Hüttemeister, S. 2005, AJ, 130, 524
- Mundell et al. (1995) Mundell, C. G., Pedlar, A., Axon, D. J., Meaburn, J. & Unger, S. W. 1995, MNRAS, 277, 641
- Muñoz-Mateos et al. (2013) Muñoz-Mateos, J. C., et al. 2013, ApJ, 771, 59
- Muraoka et al. (2016) Muraoka, K., et al. 2016, PASJ, 68, 89
- Muraoka et al. (2019) Muraoka, K., et al. 2019, PASJ, accepted
- Nagar et al. (2002) Nagar, N. M., Falcke, H., Wilson, A. S., & Ulvestad, J. S. 2002, A&A, 392, 53
- Nakai et al. (1994) Nakai, N., Kuno, N., Handa, T., & Sofue, Y. 1994, PASJ, 46, 527
- Nakanishi et al. (2006) Nakanishi, H., et al. 2006, ApJ, 651, 804
- NEDTEAM (1992) NEDTEAM 1992, Redshift obtained from Literature by the NED Team prior to November 1992
- NEDTEAM (2011) NEDTEAM 2011, Computations for objects requiring measurements performed by NED team members
- NEDTEAM (2012) NEDTEAM 2012, Computations for objects requiring measurements performed by NED team members
- Nilson (1973) Nilson, P. 1973, Uppsala General Catalogue of Galaxies, Acta Universitatis Upsalienis, Nova Regiae Societatis Upsaliensis, Series V: A Vol. 1
- Nishiyama & Nakai (2001) Nishiyama, K., & Nakai, N. 2001, PASJ, 53, 713
- Nishiyama et al. (2001) Nishiyama, K., Nakai, N., & Kuno, N. 2001, PASJ, 53, 757
- Oey et al. (2003) Oey, M. S., Parker, J. S., Mikles, V. J., & Zhang, X. 2003, AJ, 126, 2317
- Pan & Kuno (2017) Pan, H.-A., & Kuno, N. 2017, ApJ, 839, 133
- Paturel et al. (2000) Paturel, G., Petit, C., Garnier, R., & Prugniel, P. 2000, A&AS, 475, 480
- Paturel et al. (2003) Paturel, G., Petit, C., Prugniel, Ph., Theureau, G., Rousseau, J., Brouty, M., Dubois, P., Cambrésy, L. 2003, A&A, 412, 45
- Pejcha, & Prieto (2015) Pejcha, O., & Prieto, J. L. 2015, ApJ, 799, 215
- Petrov & Taylor (2011) Petrov, L., & Taylor, G. B. 2011, AJ, 142, 89
- Ponomareva et al. (2016) Ponomareva, A. A., Verheijen, M. A. W., & Bosma, A. 2016, MNRAS, 463, 4052
- Popping et al. (2012) Popping, G., Caputi, K. I., Somerville, R. S., & Trager, S. C. 2012, MNRAS, 425, 2386
- Popping et al. (2015) Popping, G., et al. 2015, MNRAS, 454, 2258
- Poznanski et al. (2009) Poznanski, D., et al. 2009, ApJ, 694, 1067
- Querejeta et al. (2015) Querejeta, M., et al. 2015, ApJS, 215, 5
- Rahman et al. (2012) Rahman, N., et al. 2012, ApJ, 745, 183
- Regan et al. (1996) Regan, M. W., Teuren, P. J., & Vogel, S. N. 1996, AJ, 112, 2549
- Richards et al. (2016) Richards, E. E., et al. 2016, MNRAS, 460, 689
- Riffel et al. (2015) Riffel, R. A., Storchi-Bergmann, T. & Riffel, R. 2015, MNRAS, 451, 3587
- Rodríguez et al. (2014) Rodríguez, Ó., Clocchiatti, A., & Hamuy, M. 2014, AJ, 148, 107
- Rodriguez-Rico et al. (2004) Rodriguez-Rico, C. A., Viallefond, F., Zhao, J. -H., Goss, W. M., & Anantharamaiah, K. R. 2004, ApJ, 616, 783
- Rupen (1991) Rupen, M. P. 1991, AJ, 102, 48
- Saintonge et al. (2011) Saintonge, A., et al. 2011, MNRAS, 415, 32
- Saintonge et al. (2013) Saintonge, A., et al. 2013, ApJ, 778, 2
- Saintonge et al. (2017) Saintonge, A., et al. 2017, ApJS, 233, 22
- Sakamoto et al. (1999) Sakamoto, K., Okumura, S. K., Ishizuki, S., & Scoville, N. Z. 1999, ApJS, 124, 403
- Sakamoto et al. (1997) Sakamoto, S., Hasegawa, T., Handa, T., Hayashi, M., & Oka, T. 1997, ApJ, 486, 276
- Salak et al. (2019) Salak, D., et al. 2019, PASJ, accepted
- Salo et al. (2015) Salo, H., et al. 2015, ApJS, 219, 4
- Sawada et al. (2008) Sawada, T., et al. 2008, PASJ, 60, 445
- Schinnerer et al. (2013) Schinnerer, E., et al. 2013, ApJ, 779, 42
- Schmitt et al. (1997) Schmitt, H. R., Kinney, A. L., Storchi-Bergmann, T., & Antonucci, R. 1997, ApJ, 477, 623
- Schruba et al. (2011) Schruba, A., et al. 2011, AJ, 142, 37
- Shappee et al. (2016) Shappee, B. J., et al. 2016, ApJ, 826, 144
- Sheth et al. (2010) Sheth, K., et al. 2010, PASP, 122, 1397
- Sheth et al. (2005) Sheth, K., Vogel, S. N., Regan, M. W., Thornley, M. D., & Teuben, P. J. 2005, ApJ, 632, 217
- Sil’chenko & Afanasiev (2006) Sil’chenko, O. K., & Afanasiev, V. L. 2006, Astron. Lett., 32, 534
- SDSS DR (2) Sloan Digital Sky Survey Team 2004a, Sloan Digital Sky Survey Data Release 2 as obtained Nov. 18, 2004a from http://www.sdss.org/dr2/products/spectra/getspectra.html
- SDSS DR (3) Sloan Digital Sky Survey Team 2004b, Sloan Digital Sky Survey Data Release 3 as obtained Sep. 28, 2004b from http://www.sdss.org/dr3/products/spectra/getspectra.html
- SDSS DR (4) Sloan Digital Sky Survey Team 2005, Sloan Digital Sky Survey Data Release 4 as obtained Aug. 17, 2005 from http://www.sdss.org/dr4/products/spectra/getspectra.html
- SDSS DR (5) Sloan Digital Sky Survey Team 2006, Sloan Digital Sky Survey Data Release 5 as obtained Jun. 28, 2006 from http://www.sdss.org/dr5/products/catalogs/index.htmla
- SDSS DR (6) Sloan Digital Sky Survey Team 2007, Sloan Digital Sky Survey Data Release 6 as obtained Sep. 17, 2007 from http://www.sdss.org/dr6/products/catalogs/index.html
- Smith & Wallin (1992) Smith, B. J., & Wallin, J. F. 1992, ApJ, 393, 544
- Sofue et al. (2003) Sofue, Y., Koda, J., Nakanishi, H., Onodera, S., Kohno, K., Tomita, A., & Okumura, S. K. 2003, PASJ, 55, 17
- Solomon et al. (1992) Solomon, P. M., Downes, D., & Radford, J. E. 1992, ApJ, 398, L29
- Spinoso et al. (2017) Spinoso, D., Bonoli, S., Dotti, M., Mayer, L., Madau, P., & Bellovary, J. 2017, MNRAS, 465, 3729
- Springob et al. (2005) Springob, C. M., Haynes, M. P., Giovanelli, R., & Kent, B. R. 2005, ApJS, 160, 149
- Springob et al. (2007) Springob, C. M., Masters, K. L., Haynes, M. P., Giovanelli, R., & Marinoni, C. 2007, ApJS, 172, 599
- Springob et al. (2009) Springob, C. M., Masters, K. L., Haynes, M. P., Giovanelli, R., & Marinoni, C. 2009, ApJS, 182, 474
- Stil et al. (2005) Stil, J. M., Gray, A. D., & Harnett, J. I. 2005, ApJ, 625, 130
- Stil & Israel (2002) Stil, J. M., & Israel, F. P. 2002, A&A, 392, 473
- Stone et al. (1999) Stone, R. C., Pier, J. R., & Monet, D. G. 1999, AJ, 118, 2488
- Sun et al. (2018) Sun, J., et al. 2018, ApJ, 860, 172
- Tamburro et al. (2008) Tamburro, D., Rix, H. -W., Walter, F., Brinks, E., de Blok, W. J. G., Kennicutt, R. C., & Mac Low, M. -M. 2008, AJ, 136, 2872
- Taniguchi & Ohyama (1998) Taniguchi, Y., & Ohyama, Y. 1998, ApJ, 507, L121
- Taniguchi et al. (1999) Taniguchi, Y., Ohyama, Y., & Sanders, D. B. 1999, ApJ, 522, 214
- Terry et al. (2002) Terry, J. N., Paturel, G., & Ekholm, T. 2002, A&A, 393, 57
- Theureau et al. (1998) Theureau, G., Bottinelli, L., Coudreau-Durand, N., Gouguenheim, L., Hallet, N., Loulergue, M., Paturel, G., & Teerikorpi, P. 1998, A&AS, 130, 333
- Theureau et al. (2007) Theureau, G., Hanski, M. O., Coudreau, N., Hallet, N., & Martin, J. -M. 2007, A&A, 465, 71
- Thilker et al. (2002) Thilker, D. A., Walterbos, R. A. M., Braun, R., & Hoopes, C. G. 2002, AJ, 124, 3118
- Toloba et al. (2014) Toloba, E., et al. 2014, ApJS, 215, 17
- Torres-Flores et al. (2014) Torres-Flores, S., Amram, P., Mendes de Oliveira, C., Plana, H., Balkowski, C., Marcelin, M., & Olave-Rojas, D. 2014, MNRAS, 442, 2188
- Tosaki et al. (2011) Tosaki, T., et al. 2011, PASJ, 63, 1171
- Trentham & Hodgkin (2002) Trentham, N., & Hodgkin, S. 2002, MNRAS, 333, 423
- Tully (1988) Tully, R. B. 1988, Nearby Galaxy Catalogue (Cambridge: Cambridge University Press)
- Tully et al. (2013) Tully, R. B., et al. 2013, AJ, 146, 86
- Tully et al. (2009) Tully, R. B., Rizzi, L., Shaya, E. J., Courtois, H. M., Makarov, D. I., & Jacobs, B. A. 2009, AJ, 138, 323
- Two Micron All Sky Survey Team (2000) Two Micron All Sky Survey Team 2000, 2MASS Point Source Catalog. Release 2
- Two Micron All Sky Survey Team (2003) Two Micron All Sky Survey Team 2003, 2MASS Extended objects. Final release
- Ulvestad & Wilson (1984) Ulvestad, J. S., & Wilson, A. S. 1984, ApJ, 285, 439
- Vaduvescu & McCall (2008) Vaduvescu, O., & McCall, M. L. 2008, A&A, 487, 147
- van den Bergh (1976) van den Bergh, S. 1976, ApJ, 206, 883
- van Driel & Buta (1991) van Driel, W., & Buta, R. J. 1991, A&A, 245, 7
- van Eymeren et al. (2011) van Eymeren, J., Jütte, E., Jog, C. J., Stein, Y., & Dettmar, R. -J. 2011, A&A, 530, 29
- Viallefond et al. (1980) Viallefond, F., Allen, R. J., & de Boer, J. A. 1980, A&A, 82, 207
- Vigott et al. (1989) Vigott, M., Grueff, G., Perley, R., Clark, B. G., & Bridle, A. H. 1989, AJ, 98, 419
- Villanueva et al. (2017) Villanueva, V., et al. 2017, MNRAS, 470, 3775
- Villi et al. (1998) Villi, M., Nakano, S., Aoki, M., Skiff, B. A., & Hanzl, D. 1998, IAU Circ., 6899, 1
- Walter et al. (2008) Walter, F., Brinks, E., de Blok, W. J. G., Bigiel, F., Kennicutt, Jr., R. C., Thornley, M. D., & Leroy, A. 2008, AJ, 136, 2563
- Walter et al. (2004) Walter, F., Dahlem, M., & Lisenfeld, U. 2004, ApJ, 606, 258
- Walter et al. (2002) Walter, F., Weiss, A., Martin, C., & Scoville, N. 2002, AJ, 123, 225
- Wang et al. (2004) Wang, Z., et al. 2004, ApJS, 154, 193
- Watanabe et al. (2011) Watanabe, Y., Sorai, K., Kuno, N., & Habe, A. 2011, MNRAS, 411, 1409
- Wen et al. (2013) Wen, X. -Q., Wu, H., Z., Y. -N., Lam, M. I., Wu, C. -J., Wicker, J., & Zhao, Y. -H. 2013, MNRAS, 433, 2946
- Weyant et al. (2014) Weyant, A., Michael Wood-Vasey, W., Allen, L., Garnavich, P. M., Jha, S. W., Joyce, R., & Matheson, T. 2014, ApJ, 784, 105
- Whiting et al. (2007) Whiting, A. B., Hau, G. K. T., Irwin, M., & Verdugo, M. 2007, AJ, 133, 715
- Wilson et al. (2012) Wilson, C. D., et al. 2012, MNRAS, 424, 3050
- Wright et al. (2010) Wright, E. L., et al. 2010, AJ, 140, 1868
- (220) XMM-Newton Survey Science Centre Consortium 2010, The XMM-Newton Serendipitous Source Catalogue. 2XMM v1.2 Downloaded from http://xmmssc-www.star.le.ac.uk on 1/11/2012
- Yajima et al. (2019) Yajima, Y., et al. 2019, PASJ, accepted
- Yamamura et al. (2010) Yamamura, I., Makiuti, S., Ikeda, N., Fukuda, Y., Oyabu, S., Koga, T., & White, G. J. 2010, AKARI/FIS All-Sky Survey Point Source Catalogues (ISAS/JAXA)
- Yamauchi et al. (2004) Yamauchi, A., Nakai, N., Sato, N., & Diamond, P. 2004, PASJ, 56, 605
- Young et al. (1995) Young, J. S., et al. 1995, ApJS, 98, 219
- Young & Scoville (1991) Young, J. S., & Scoville, N. Z. 1991, ARA&A, 29, 581
- Young et al. (2006) Young, L. M., Rosolowsky, E., van Gorkom, J. H., & Lamb, S. A. 2006, ApJ, 650, 166
- Zahid et al. (2012) Zahid, H. J., Dima, G. I., Kewley, L. J., Erb, D. K., & Davé, R. 2012, ApJ, 757, 54
- Zschaechner et al. (2015) Zschaechner, L. K., Rand, R. J., & Walterbos, R. 2015, ApJ, 799, 61