Tomography of a feedback measurement with photon detection
Abstract
Quantum measurement is essential to both the foundations and practical applications of quantum information science. Among many possible models of quantum measurement, feedback measurements that dynamically update their physical structure are highly interesting due to their flexibility which enables a wide range of measurements that might otherwise be hard to implement. Here we investigate by detector tomography a measurement consisting of a displacement operation combined with photon detection followed by a real time feedback operation. We design the measurement in order to discriminate the superposition of vacuum and single photon states – the single-rail qubit – and find that it can discriminate the superposition states with a certainty of 96%. Such a feedback-controlled photon counter will facilitate the realization of quantum information protocols with single-rail qubits as well as the non-locality test of certain entangled states.
Introduction.—Measurement and discrimination of quantum states plays a fundamental role in quantum information processing Helstrom (1976); Nielsen and Chuang (2000); Kok et al. (2007); Gisin and Thew (2007). The information contained in qubits or higher-dimensional encodings can only be faithfully retrieved if high-fidelity readout schemes are available: The result of a quantum computation is obtained by projective measurements of the qubit states in the computational basis Kok et al. (2007), while the message or key sent over a communication channel is extracted by measurements that can efficiently discriminate some of the quantum states used as code words Gisin and Thew (2007); Gisin et al. (2002). In some cases, it may not be easy or even possible to implement a direct measurement that attains the required performance. Therefore, more advanced but indirect measurement schemes may be needed. As an example of this, relevant to coherent optical communication, two weak coherent states cannot be optimally distinguished using standard optical measurements like homodyne, heterodyne or photon detection Helstrom (1976); Takeoka and Sasaki (2008). However, a measurement strategy consisting of photon detection preceded by a displacement operation that is dynamically updated based on the photon detector outcomes is known to attain the optimal performance possible in the limit of infinitely fast feedback Dolinar (1973); Cook et al. (2007). As a highly flexible measurement model, such a feedback measurement with its dynamically updated physical structure adapted to partial measurement outcomes may have a wide range of applications Bondurant (1993); Izumi et al. (2012, 2013); Becerra et al. (2013, 2015). Indeed, it has also been shown to enable an arbitrary two-dimensional projection measurement Takeoka et al. (2005, 2006).
A scenario where this measurement strategy will be highly beneficial is the discrimination of the two orthogonal superpositions of the vacuum and single photon state, . These are the conjugate basis states of the optical single-rail qubit where information is encoded in the photon number of a single optical mode Lund and Ralph (2002); Morin et al. (2014); Jeong et al. (2014); Ulanov et al. (2017); Drahi et al. (2019). This particular qubit encoding is interesting due to its natural relation to e.g. atomic and mechanical qubits Kurizki et al. (2015) and its convertibility with cat state qubits and polarization qubits Morin et al. (2014); Jeong et al. (2014); Ulanov et al. (2017); Drahi et al. (2019). The computational basis states can be distinguished simply by a high-efficiency photodetector, but the states of the conjugate basis are not associated with simple physical observables and can therefore not be directly measured. One discrimination strategy for the superposition states is to apply a Hadamard transform to the state (converting into or ) prior to the measurement of its photon number, but such a transformation is highly non-trivial, requiring a strong non-linearity Lund and Ralph (2002); Heaney et al. (2011). The task of making a projective measurement onto the conjugate basis for the single-rail qubit is therefore an obvious use case for the more feasible feedback measurement.
We experimentally demonstrate the implementation of a feedback measurement at telecom wavelength with parameters optimized for a projective measurement onto the vacuum and single photon superposition states . With different parameter settings, the measurement could be adapted to arbitrary projections on the single-rail qubit Bloch sphere. The measurement consists of a displacement operation, photon detection and feedback for updating the displacement amplitude. We characterize the measurement by quantum detector tomography which only requires a collection of well-calibrated coherent states. Quantum detector tomography has been demonstrated for various types of static measurements Lundeen et al. (2009); Brida et al. (2012); Zhang et al. (2012); Natarajan et al. (2013); Izumi et al. (2018a, b), but not before for a dynamically updated measurement. As a figure of merit for the performance of the measurement, we evaluate the discrimination error for the two superposition states.
Concept.—The original proposal for quantum state discrimination using a displacement based photon counter with feedback operations shown in Fig. 1(a) consists of a displacement operation, a single photon counter (SPC) and real-time feedback of the SPC’s measurement outcome to the displacement amplitude Dolinar (1973). An incoming quantum state with full time width is virtually divided into temporal mode bins with time widths for the ’th bin. The phase and amplitude of the displacement in each bin, , is dependent on the photon counting history of the earlier time bins. The measurement strategy can be equivalently analyzed using spatial modes, where the measurement consists of beam splitters (BSs) having reflectances and a displacement operation with the amplitude and a SPC in each of the spatial modes Takeoka et al. (2005, 2006), as depicted in Fig. 1(b).
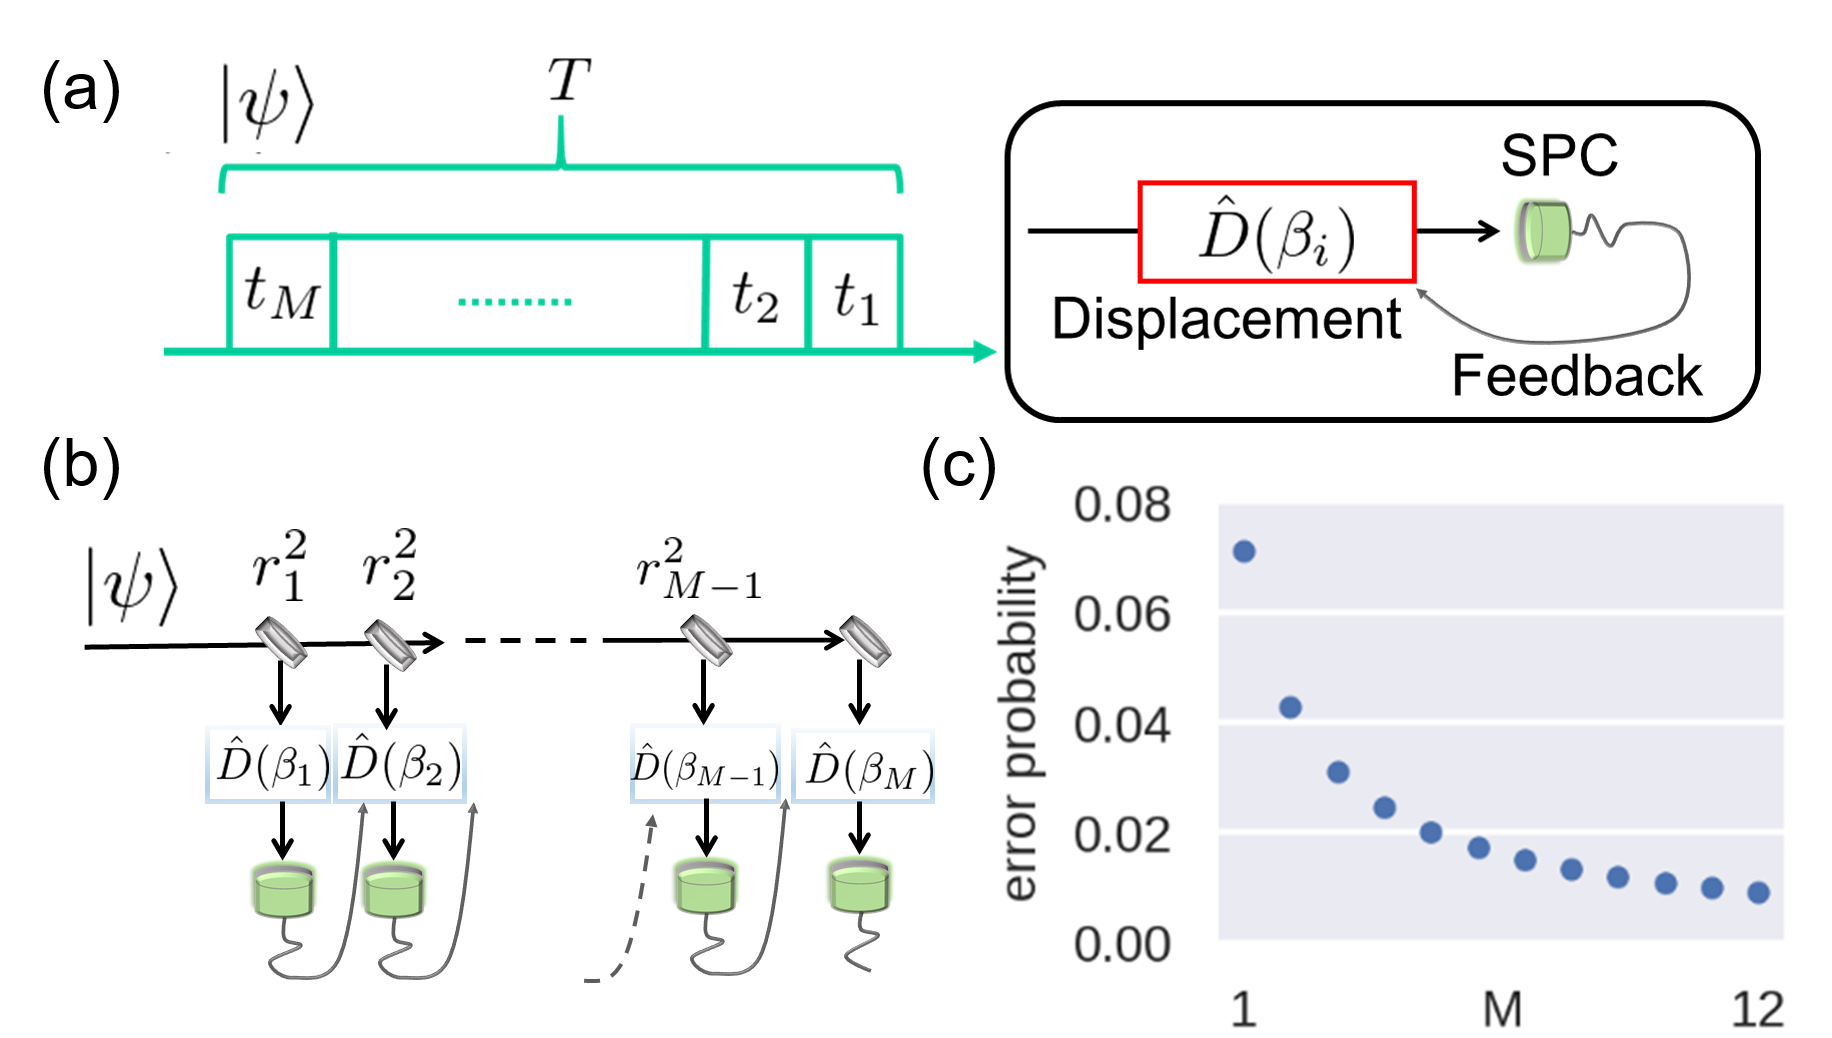
For concreteness, we will describe the protocol in the setting of discrimination of the states . The quantum state to be distinguished is split by the BSs and the first displacement operation is implemented such that the state is displaced close to the vacuum state. The displaced state is detected by the SPC, whose binary outcomes indicate whether the state is more likely to be (off) or (on). Once an outcome from the SPC is obtained, one can calculate an a posteriori probability for given outcomes , where . The displacement amplitude is controlled dependent on the a posteriori probability, i.e., the most probable state is displaced close to the vacuum state. By repeating the operations and detections recursively, we conclude whether the state is or depending on the a posteriori probability. The optimal strategy, it turns out, is to change the sign of the ’th displacement with respect to the ’th displacement if the ’th counter detects a photon and to maintain the phase otherwise. The conclusion of the state discrimination is then if the total number of “on” events is even and if it is odd Takeoka et al. (2005, 2006). The discrimination error approaches zero if . We adopt the spatial mode analysis to investigate the performance of the measurement in the finite number case.
Each stage of the measurement, consisting of beam splitter, displacement, and SPC with the outcome , can be considered as a single quantum operation on the state that was output from the previous stage. The post-measurement state of the ’th stage is then , where the normalization factor is the probability of getting the outcome . For an “off” detection, the map of the operation is , with the Kraus operator corresponding to zero photons at the detector given by with beam splitter transmittance Takeoka et al. (2005). Since the SPC cannot distinguish between one and more photons, the corresponding map for an “on” detection is with the -photon Kraus operators . The total probability for obtaining the series of detection events given an input state is then the trace of the composition of the maps for each stage, . Equivalently, the probability can be written in terms of a POVM corresponding to that specific measurement outcome, . While the former formulation is most natural for understanding and modelling the iterative detection scheme, the latter is more relevant for the process of detector tomography which returns the elements of the POVM. Thus, denoting the sets of all possible outcomes with even (odd) number of “on” events as (), the error probability for the discrimination of the superposition states is given by,
| (1) |
To illustrate the scheme and the optimizations involved, we first consider the feedback measurement of in the case of . Using the decision strategy and the expressions outlined above, we obtain the error probability for the feedback measurement with as,
| (2) | |||||
The “off” and “on” indices on indicate that the amplitude of the second displacement depends on the outcome in the first channel. The minimum achievable error probability is obtained to be at the optimized parameter values , , , . For comparison, the displacement and SPC scheme without feedback operation (i.e. ) obtains , while homodyne detection would be able to achieve an error probability of 0.101 Izumi et al. (2018b).
Finding the ultimate performance for a given requires optimization over parameters for the BS reflection coefficients and parameters for the displacement magnitudes . This problem becomes intractable for large . In a simplification of the scheme, we may assume that only the displacement phases, i.e. the sign of the ’s should depend on the outcome history, whereas the displacement magnitudes will be kept fixed at each stage, e.g. . It turns out (see later) that there is only a small penalty to pay for the error probability in using this simplified scheme. The results of the minimization are plotted in Fig. 1(c).
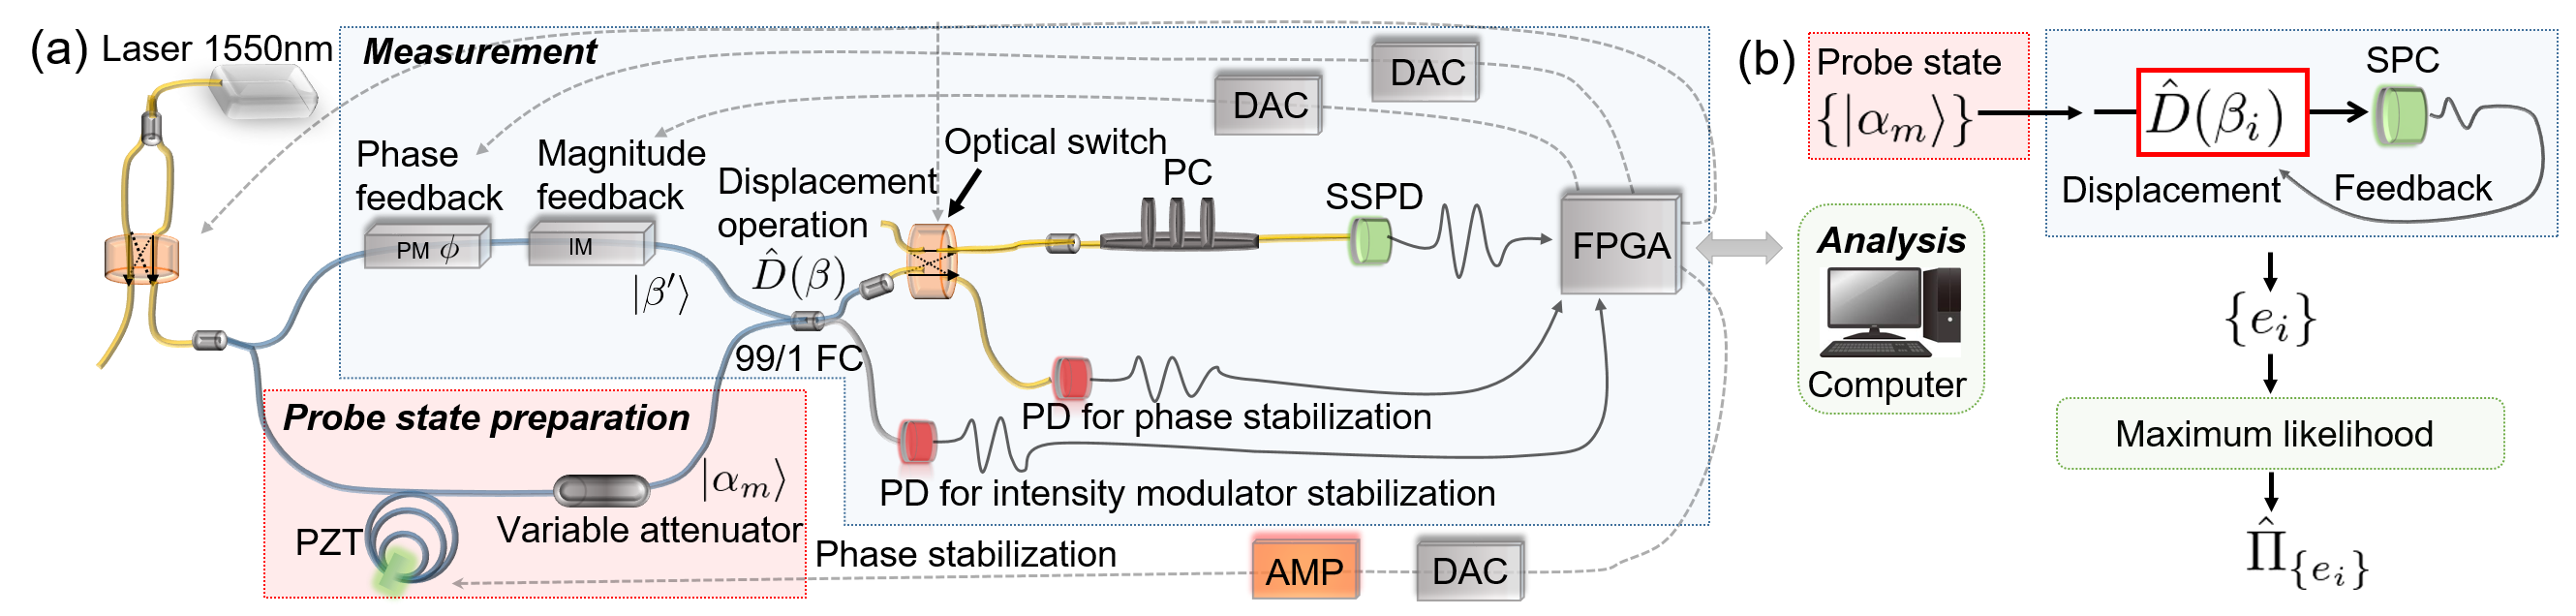
Experiment.—Fig. 2(a) illustrates our experimental setup. Quantum detector tomography requires well characterized probe states that cover the Hilbert space of interest. We use densely spaced coherent states as probes, since they are readily available and tomographically complete Lundeen et al. (2009). A continuous-wave, fiber-coupled laser at 1550 nm is split in two paths, one for preparation of the probe states and one for the reference field for the displacement operation. The laser intensity is switched between high and low for the purposes of phase calibration/stabilization and measurement, respectively. The intensity and the phase of the probe states are adjusted by a variable attenuator and a phase shifter that consists of a piezo transducer embedded in a circular mount with an optical fiber looped around. We prepare probe states with 4 weak magnitudes and 8 phase conditions as well as the vacuum state to characterize our measurement in the two-dimensional Hilbert space spanned by and . The displacement operation is physically implemented with a 99:1 fiber coupler. Its magnitude and direction is controlled by a phase and an intensity modulator. When the laser intensity is high (locking mode), a switch directs the displaced probe to a conventional photo detector for stabilization of the relative phase between probe and reference. When the intensity is low (measurement mode), the displaced probe state is detected by a superconducting nanowire single photon detector (SSPD) Miki et al. (2013); Yamashita et al. (2013). A field programmable gate array (FPGA) counts the electrical signal from the SSPD and rapidly changes—dependent on the measurement outcome—the voltages applied to the intensity and phase modulators. The procedure is repeated 10,000 times for each of the probe states. In Fig. 2(b), we show a simple schematic of detector tomography with coherent states. The POVM elements corresponding to the outcome of the measurement are reconstructed following the maximum likelihood procedure using the known density matrices of the probe states and the distribution of the outcomes Fiurášek (2001).
Losses in the switch and other optical components and the finite detection efficiency of the SSPD limit the performance of our measurement. The total transmittance from the 99:1 fiber coupler to the fiber right before the SSPD is measured to be . A benefit of the SSPD is that by changing the applied bias voltage, one can tune the trade-off between high detection efficiency and low dark count rate. We set the efficiency to 51% which results in a dark count rate of 20 counts per second. As a proof of concept and to highlight the functionality of the measurement, we choose to disregard the finite overall efficiency . In practice, we do this by calibrating the magnitude of the probe states and displacements by the actual count rate of the SSPD. This corresponds to a rescaling of the probe coherent state amplitudes, . We note that after completion of this work, we further improved the transmittance efficiency to and the visibility to while we also used another SSPD with up to detection efficiency Izumi et al. (2020).
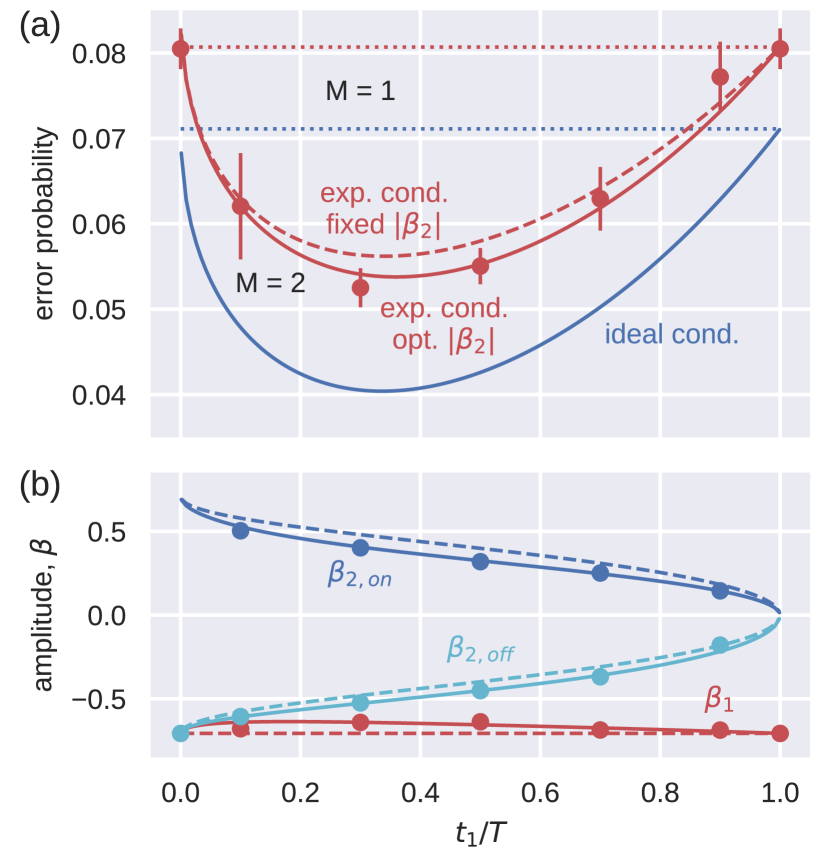
We first explore the case in detail, investigating the error probability with variable beam-splitter ratio and optimized displacement amplitudes. The quantum states of the probes are defined within a rectangular temporal mode of length = s. The feedback bandwidth of our experiment is limited by a digital analog converter whose bandwidth is roughly 1 MHz. The delay of the feedback operations degrades the discrimination error. Therefore, we discard counts observed in a s time interval after the first time bin, which corresponds to loss. The delay analysis is further discussed in Supplemental Material.
Experimental results of the estimated error probability for with various settings of (corresponding to the beam-splitter ratio in the spatial picture) are shown in Fig. 3(a). Red data points are the experimentally estimated error probabilities. The mean values and the error bars are evaluated from five independent procedures. The blue and red solid curves represent, respectively, the expected performance of the feedback measurements in the ideal case and with experimental imperfections, the non-unit visibility , the dark count noise counts/state and loss due to the feedback delay. The slightly degraded performance shown by the red dashed curve is what would be obtained by keeping the displacement magnitude fixed (). Measurement without feedback operation with and without the experimental imperfections are shown by red and blue dot lines. Figure 3(b) depicts the experimental conditions as well as the theoretical optimum values of the displacement amplitudes. The experimental results agree well with the theoretical prediction and the optimization of the feedback timing is essential to achieve the minimum error probability for a given .
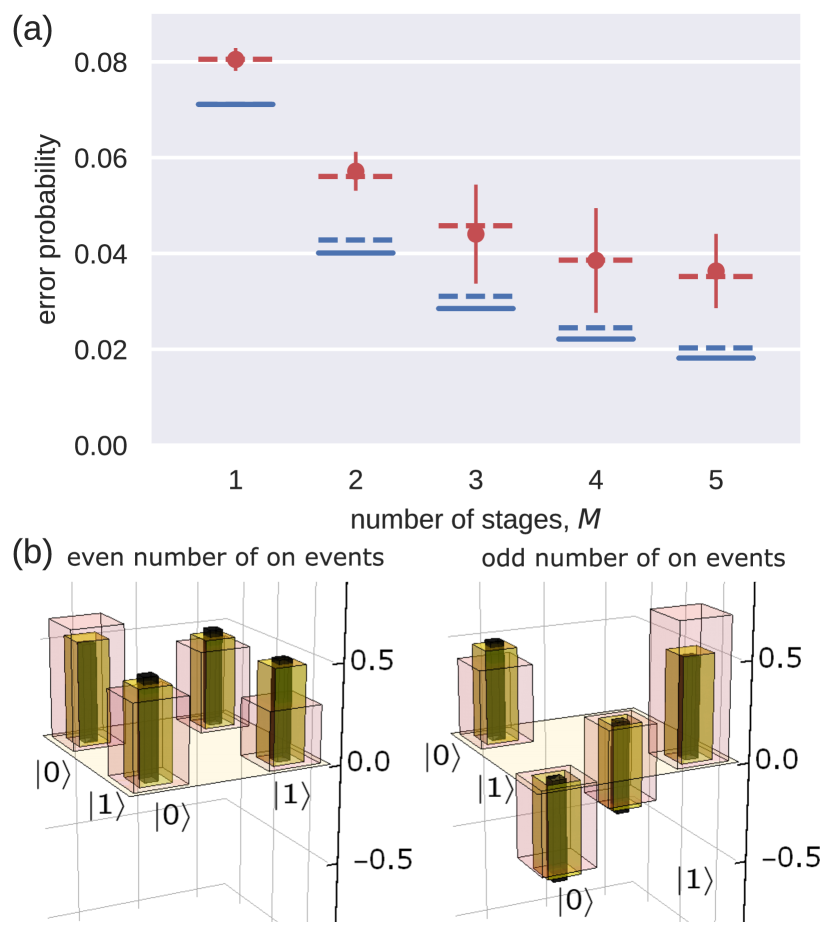
Next, we investigate the performance of the measurement scheme for up to five feedback stages. The experimentally obtained error probabilities are plotted in Fig. 4(a). The mean values and the error bars are calculated from 5 independent procedures for and 10 independent procedures for . The corresponding displacement conditions realized in the experiment are shown in Supplemental Material. The delay time becomes dominant if the number of feedback operations is increased and the improvement of the error probability owing to the feedback operation could be saturated. Therefore, we increase the time width for the probe state as s such that the delay loss can be constant 2 and decrease the bias voltage applied to the SSPD to get the constant dark counts counts/state. In Fig. 4(b), we show the real part of the experimentally reconstructed POVMs of our measurement for and in the two-dimensional Hilbert space of interest. This makes it clear how feedback and adaptively updated parameters makes it possible to attain a near-perfect projective measurement. Although the actual performance does not reach the ideal one (due to the experimental imperfections), we observe a clear improvement of the error probability by increasing the number of feedback operations.
Summary.—We experimentally demonstrated a measurement system designed for the discrimination of single-rail qubits. It is composed of a displacement operation, a single photon counter and feedback operations that depend on the outcome of the photon detections. Our measurement was characterized by quantum detector tomography using coherent state probes. We first investigated the error probability attainable by our measurement with a single feedback operation for varying timing conditions, showing the importance of optimizing this parameter. Secondly, we showed that the expected discrimination error can be improved by increasing the number of feedback operations.
We expect that our projector will pave the way for various applications in quantum information science utilizing the single-rail optical qubit. Moreover, the projector can be used to demonstrate quantum non-locality between many parties using a multi-mode delocalized single photon state (also known as a W state) Greenberger et al. (1989); Wiseman et al. (2007); Heaney et al. (2011); Chaves and Brask (2011); Laghaout and Andersen (2015), which in turn will provide device-independent security in quantum communication Acín et al. (2007); Branciard et al. (2012), and may lead to remote preparation of the superposition state Özdemir et al. (2001); Babichev et al. (2004); Ralph et al. (2005); Pozza et al. (2015).
From a practical point of view, The ultimate speed of our feedback system would be limited by the dead time of the SSPD which is about 50 ns while the current speed limitation due to the DAC can be solved by installing one with higher performance. Further improvement of the feedback bandwidth could be obtained by a multi-pixel SSPD with effectively short dead time Allman et al. (2015) or multiple SSPDs and a fast switch. If one needs to perform the feedback measurement with very short laser pulses, the spatial configuration with delay lines (Fig. 1(b)) could be a practical direction to repeatedly implement the feedback.
Acknowledgements.
We thank T. Yamashita, S. Miki, H. Terai for providing and installing the superconducting nanowire single photon detector. This project was supported by Grant-in-Aid for JSPS Research Fellow, by VILLUM FONDEN via the Young Investigator Programme (Grant no. 10119) and by the Danish National Research Foundation through the Center for Macroscopic Quantum States (bigQ DNRF142).References
- Helstrom (1976) C. W. Helstrom, Quantum Detection and Estimation Theory (Academic Press, New York, 1976).
- Nielsen and Chuang (2000) M. A. Nielsen and I. L. Chuang, Quantum Computation and Quantum Information (Cambridge University Press, New York, 2000).
- Kok et al. (2007) P. Kok, W. J. Munro, K. Nemoto, T. C. Ralph, J. P. Dowling, and G. J. Milburn, Rev. Mod. Phys. 79, 135 (2007).
- Gisin and Thew (2007) N. Gisin and R. Thew, Nature Photon. 1, 165 (2007).
- Gisin et al. (2002) N. Gisin, G. Ribordy, W. Tittel, and H. Zbinden, Rev. Mod. Phys. 74, 145 (2002).
- Takeoka and Sasaki (2008) M. Takeoka and M. Sasaki, Phys. Rev. A 78, 022320 (2008).
- Dolinar (1973) S. Dolinar, Research Laboratory of Electronics, MIT, Quarterly Progress Report p. 115 (1973).
- Cook et al. (2007) R. L. Cook, P. J. Martin, and J. M. Geremia, Nature 446, 774 (2007).
- Bondurant (1993) R. S. Bondurant, Opt. Lett. 18, 1896 (1993).
- Izumi et al. (2012) S. Izumi, M. Takeoka, M. Fujiwara, N. D. Pozza, A. Assalini, K. Ema, and M. Sasaki, Phys. Rev. A 86, 042328 (2012).
- Izumi et al. (2013) S. Izumi, M. Takeoka, K. Ema, and M. Sasaki, Phys. Rev. A 87, 042328 (2013).
- Becerra et al. (2013) F. E. Becerra, J. Fan, G. Baumgartner, J. Goldhar, J. T. Kosloski, and A. Migdall, Nature Photon. 7, 147 (2013).
- Becerra et al. (2015) F. E. Becerra, J. Fan, and A. Migdall, Nature Photon. 9, 48 (2015).
- Takeoka et al. (2005) M. Takeoka, M. Sasaki, P. van Loock, and N. Lütkenhaus, Phys. Rev. A 71, 022318 (2005).
- Takeoka et al. (2006) M. Takeoka, M. Sasaki, and N. Lütkenhaus, Phys. Rev. Lett. 97, 040502 (2006).
- Lund and Ralph (2002) A. P. Lund and T. C. Ralph, Phys. Rev. A 66, 032307 (2002).
- Morin et al. (2014) O. Morin, K. Huang, J. Liu, H. Le Jeannic, C. Fabre, and J. Laurat, Nature Photonics 8, 570 (2014).
- Jeong et al. (2014) H. Jeong, A. Zavatta, M. Kang, S.-W. Lee, L. S. Costanzo, S. Grandi, T. C. Ralph, and M. Bellini, Nature Photon. 8, 564 (2014).
- Ulanov et al. (2017) A. E. Ulanov, D. Sychev, A. A. Pushkina, I. A. Fedorov, and A. I. Lvovsky, Phys. Rev. Lett. 118, 160501 (2017).
- Drahi et al. (2019) D. Drahi, D. V. Sychev, K. K. Pirov, E. A. Sazhina, V. A. Novikov, I. A. Walmsley, and A. I. Lvovsky, arXiv:1905.08562 (2019).
- Kurizki et al. (2015) G. Kurizki, P. Bertet, Y. Kubo, K. Mølmer, D. Petrosyan, P. Rabl, and J. Schmiedmayer, Proceedings of the National Academy of Sciences 112, 3866 (2015), ISSN 0027-8424.
- Heaney et al. (2011) L. Heaney, A. Cabello, M. F. Santos, and V. Vedral, New Journal of Physics 13, 053054 (2011).
- Lundeen et al. (2009) J. S. Lundeen, A. Feito, H. Coldenstrodt-Ronge, K. L. Pregnell, C. Silberhorn, T. C. Ralph, and I. A. Walmsley, Nature Physics 5, 27 (2009).
- Brida et al. (2012) G. Brida, L. Ciavarella, I. P. Degiovanni, M. Genovese, L. Lolli, M. G. Mingolla, F. Piacentini, M. Rajteri, E. Taralli, and M. G. A. Paris, New Journal of Physics 14, 085001 (2012).
- Zhang et al. (2012) L. Zhang, H. B. Coldenstrodt-Ronge, A. Datta, G. Puentes, J. S. Lundeen, X. M. Jin, B. J. Smith, M. B. Plenio, and I. A. Walmsley, Nature Photon. 6, 364 (2012).
- Natarajan et al. (2013) C. M. Natarajan, L. Zhang, H. Coldenstrodt-Ronge, G. Donati, S. N. Dorenbos, V. Zwiller, I. A. Walmsley, and R. H. Hadfield, Optics express 21, 893 (2013).
- Izumi et al. (2018a) S. Izumi, M. Takeoka, K. Wakui, M. Fujiwara, K. Ema, and M. Sasaki, Sci. Rep. 8, 2999 (2018a).
- Izumi et al. (2018b) S. Izumi, J. S. Neergaard-Nielsen, and U. L. Andersen, Journal of Physics B: Atomic, Molecular and Optical Physics 51, 085502 (2018b).
- Miki et al. (2013) S. Miki, T. Yamashita, H. Terai, and Z. Wang, Opt. Express 21, 10208 (2013).
- Yamashita et al. (2013) T. Yamashita, S. Miki, H. Terai, and Z. Wang, Opt. Express 21, 27177 (2013).
- Fiurášek (2001) J. Fiurášek, Phys. Rev. A 64, 024102 (2001).
- Izumi et al. (2020) S. Izumi, J. S. Neergaard-Nielsen, S. Miki, H. Terai, and U. L. Andersen, arXiv:2001.05902 (2020).
- Greenberger et al. (1989) D. M. Greenberger, M. A. Horne, and A. Zeilinger, in Bell’s Theorem, Quantum Theory, and Conceptions of the Universe, edited by M. Kafatos (Kluwer Academic, Dordrecht, 1989).
- Wiseman et al. (2007) H. M. Wiseman, S. J. Jones, and A. C. Doherty, Phys. Rev. Lett. 98, 140402 (2007).
- Chaves and Brask (2011) R. Chaves and J. B. Brask, Phys. Rev. A 84, 062110 (2011).
- Laghaout and Andersen (2015) A. Laghaout and U. L. Andersen, Phys. Rev. A 92, 042118 (2015).
- Acín et al. (2007) A. Acín, N. Brunner, N. Gisin, S. Massar, S. Pironio, and V. Scarani, Phys. Rev. Lett. 98, 230501 (2007).
- Branciard et al. (2012) C. Branciard, E. G. Cavalcanti, S. P. Walborn, V. Scarani, and H. M. Wiseman, Phys. Rev. A 85, 010301 (2012).
- Özdemir et al. (2001) S. K. Özdemir, A. Miranowicz, M. Koashi, and N. Imoto, Phys. Rev. A 64, 063818 (2001).
- Babichev et al. (2004) S. A. Babichev, B. Brezger, and A. I. Lvovsky, Phys. Rev. Lett. 92, 047903 (2004).
- Ralph et al. (2005) T. C. Ralph, A. P. Lund, and H. M. Wiseman, Journal of Optics B: Quantum and Semiclassical Optics 7, S245 (2005).
- Pozza et al. (2015) N. D. Pozza, H. M. Wiseman, and E. H. Huntington, New Journal of Physics 17, 013047 (2015).
- Allman et al. (2015) M. S. Allman, V. B. Verma, M. Stevens, T. Gerrits, R. D. Horansky, A. E. Lita, F. Marsili, A. Beyer, M. D. Shaw, D. Kumor, et al., Applied Physics Letters 106, 192601 (2015).