Another Mini Solar Maximum in the Offing: A Prediction for the Amplitude of Solar Cycle 25
Abstract
We examine the temporal changes in both solar polar magnetic field (PMF) at latitudes and heliospheric magnetic field (HMF) at 1 AU during solar cycles 21–24 with emphasis on the recent activity changes after July 2015, the so called “mini solar maximum” of cycle 24. While unsigned PMF shows a solar-cycle-like variation in cycles 21 and 22, it shows an anti-solar-cycle-like variation in cycle 24. In addition, the floor level of the HMF (of 4.6 nT), i.e. the value that the HMF returns to at each solar minimum, is breached about two years prior to cycle 24 minimum, indicating a reduced HMF floor level in the upcoming cycle 24 minimum. In light of the change of unsigned PMF and the availability of a revised smoothed sunspot number (SSN) after July 2015, we have revisited the correlation of unsigned PMF and HMF at solar minimum. The correlation is used to estimate a new value of the HMF of 4.160.6 nT at the cycle 24 minimum and the amplitude of the upcoming cycle 25. The updated prediction is 828 and 13311, on the original (V1.0) and revised (V2.0) SSN scales, respectively. These better and more reliable SSN values (due to the larger data set) imply that we will witness another mini solar maximum in the upcoming cycle 25 which will be relatively stronger than cycle 24 and a little weaker than cycle 23, even if the current solar cycle minimum occurs in 2021 instead of 2020.
JGR: Space Physics
Key Laboratory of Solar Activity, National Astronomical Observatories, Chinese Academy of Sciences, Beijing - 100100, China
Physical Research Laboratory, Astronomy & Astrophysics Division, Navarangpura, Ahmedabad - 380009, India.
Electronics Science Department, Pune University, Pune, Maharasthra - 411007, India
Susanta Kumar Bisoisusanta@nao.cas.cn
Anti-solar-cycle like behaviour of unsigned solar polar magnetic fields in cycle 24
A reduced floor level of HMF in upcoming minimum of cycle 24
Prediction of a relatively stronger upcoming solar cycle 25 than cycle 24
1 Introduction
The solar cycle activity that waxes and wanes with a period of 11 years modulates the heliospheric environment and has potential implications for changes in “space weather”. It is, therefore, extremely important to understand long term changes in solar cycle activity and to accurately predict the behaviour of upcoming solar cycles. A number of satellites and space missions in the recent years including many being planned for the future require knowledge of future solar cycle activity in planning the missions properly. The current solar cycle 24 is the fourth successive cycle, since cycle 21, in a continuing trend of diminishing sunspot cycles and is also one of the weakest cycles, since cycle 14, with a peak smoothed sunspot number (SSN) of 116 in the revised sunspot scale. The maximum of solar cycle 24 is therefore known as the “mini solar maximum”. It must be clarified here that as of July 2015 a revised and updated list of the (Wolf) sunspot numbers has been adopted, referred to as SSN V2.0 (Clette \BBA Lefèvre, \APACyear2016; Cliver, \APACyear2016). Recent studies have also claimed that the Sun may move into a period of very low sunspot activity comparable with the Dalton (Zolotova \BBA Ponyavin, \APACyear2014) or even the Maunder minimum (Zachilas \BBA Gkana, \APACyear2015; Sánchez-Sesma, \APACyear2016). This has caught the attention of researchers worldwide who have attempted to predict the amplitude of solar cycle 25 (L. Upton \BBA Hathaway, \APACyear2014; Janardhan, Bisoi, Ananthakrishnan, Tokumaru\BCBL \BOthers., \APACyear2015; Cameron \BOthers., \APACyear2016; Hathaway \BBA Upton, \APACyear2016; Kakad \BOthers., \APACyear2017; Iijima \BOthers., \APACyear2017; Pesnell \BBA Schatten, \APACyear2018; Jiang \BOthers., \APACyear2018; L\BPBIA. Upton \BBA Hathaway, \APACyear2018; Petrovay \BOthers., \APACyear2018; Gopalswamy \BOthers., \APACyear2018; Macario-Rojas \BOthers., \APACyear2018; Sarp \BOthers., \APACyear2018; Bhowmik \BBA Nandy, \APACyear2018). The solar cycle 25 predictions made prior to 2016 usually used the unrevised SSN observations, referred to here onward as SSN V1.0, while the solar cycle 25 predictions made after 2016 mostly used the SSN V2.0 observations. The different estimates of SSN in V1.0 and V2.0 for the amplitude of cycle 25 along with the ratio of peak SSN of cycle 25 to cycle 24 are summarised in Table 1. Recently, Pesnell (\APACyear2018) reported that the solar cycle 25 predictions which used the SSN V1.0 observations need to be revisited as he showed that the revised SSN V2.0 observations have different values of SSN for the solar maxima and minima compared to the original SSN V1.0 observations. In our previous solar cycle prediction (Janardhan, Bisoi, Ananthakrishnan, Tokumaru\BCBL \BOthers., \APACyear2015), abbreviated henceforth as JBA15, a peak SSN of 6212 was reported for the amplitude of the upcoming solar cycle 25. For that prediction, we had used the original SSN V1.0 observations, with data for the period 1975 – mid-2014. We therefore revisit, in this paper, our earlier prediction in order to update the amplitude of solar cycle 25 using the revised SSN V2.0 observations available after July 2015.
| Authors | |||
|---|---|---|---|
| (V1.0) | (V2.0) | ||
| L. Upton \BBA Hathaway (\APACyear2014) | - | - | 1 |
| Janardhan, Bisoi, Ananthakrishnan, Tokumaru\BCBL \BOthers. (\APACyear2015) | 6212 | - | 0.83 |
| Cameron \BOthers. (\APACyear2016) | - | - | 1 |
| Hathaway \BBA Upton (\APACyear2016) | - | - | |
| Kakad \BOthers. (\APACyear2017) | 6311.3 | - | 0.84 |
| Iijima \BOthers. (\APACyear2017) | - | - | |
| Kirov \BOthers. (\APACyear2018) | 50-55 | - | 0.73 |
| Pesnell \BBA Schatten (\APACyear2018) | - | 13525 | 1.16 |
| Jiang \BOthers. (\APACyear2018) | - | 12532 | 1.08 |
| L\BPBIA. Upton \BBA Hathaway (\APACyear2018) | - | 110.6 | 0.95 |
| Petrovay \BOthers. (\APACyear2018) | - | 130 | 1.12 |
| Gopalswamy \BOthers. (\APACyear2018) | - | - | 1 |
| Macario-Rojas \BOthers. (\APACyear2018) | - | 99.6 | 0.86 |
| Sarp \BOthers. (\APACyear2018) | - | 15412 | 1.32 |
| Bhowmik \BBA Nandy (\APACyear2018) | - | 118 | 1.01 |
| 828 | 13311 | 1.00, 1.14 |
Further, we primarily used, in our earlier prediction (JBA15), a possible continuation of a steady declining trend observed in unsigned solar polar fields above latitudes of starting from 1995 until the minimum of cycle 24 to estimate a value of unsigned polar field and subsequently a value of heliospheric magnetic field (HMF) at the minimum of cycle 24. The HMF value was then used as a precursor for predicting the peak SSN of cycle 25. The study used solar photospheric magnetic fields (SPF) data covering the period 1975–mid-2014. Since then, we now have three additional years of observations (up to the current data set of Dec. 2017) of SPF. Recently, Ingale \BOthers. (\APACyear2019) have claimed that the over 20 year steady decline in unsigned polar fields reported in JBA15 showed an abrupt rise after July 2015 instead of a continuing declining trend. In this paper, we have shown that this change in the declining trend of unsigned polar fields observed after July 2015 would affect the estimated value of unsigned polar fields at the upcoming minimum of solar cycle 24 as obtained in JBA15, and in turn our estimate of the amplitude of cycle 25. In addition, it has been argued by some authors (Janardhan, Bisoi, Ananthakrishnan, Sridharan\BCBL \BBA Jose, \APACyear2015; Zachilas \BBA Gkana, \APACyear2015; Sánchez-Sesma, \APACyear2016), that we might be heading towards a Maunder like Grand minimum. In fact, sunspot numbers going back over the past 1000 solar cycles or 11,000 years in time using 14C records from tree rings and this data has been used to identify 27 grand or prolonged solar minima (Usoskin \BOthers., \APACyear2007), implying that appropriate conditions can exist on the sun to induce grand minima. Choudhuri \BBA Karak (\APACyear2012) and Karak \BBA Choudhuri (\APACyear2013) used a flux transport dynamo model to characterise the onset of grand minima seen in this 11,000 year long data set and brought out several important insights:
-
•
gradual changes in meridional flow velocity lead to a gradual onset of grand minima, while abrupt changes lead to an abrupt onset.
-
•
one or two solar cycles before the onset of grand minima, the cycle period tends to become longer.
It may be noted that surface meridional flows over cycle 23 have shown gradual variations (Hathaway \BBA Rightmire, \APACyear2010) and cycle 24 started 1.3 years later than expected. There is also evidence of longer cycles before the start of the Maunder and Spörer minimum (Miyahara \BOthers., \APACyear2010). Also, modelling studies of solar cycle 23, invoking meridional flow variations over the cycle have shown that very deep minima are generally associated with weak polar fields (Nandy \BOthers., \APACyear2011). Given these conclusions and the fact that the declining trend in photospheric magnetic fields is still continuing (Sasikumar Raja \BOthers., \APACyear2019), it is reasonable to raise the question about the peak SSN of cycle 25 if the oncoming solar minimum of cycle 24 were to take place in 2021 instead of 2020 as expected.
Thus, in this study, we re-estimate the amplitude of solar cycle 25. Importantly, we discuss the variations of unsigned polar fields and HMF after July 2014 which reveal some new findings; that are crucial in the context of recent changes in the Sun’s global magnetic field behaviour.
2 Data and Methodology
2.1 Smoothed Sunspot Number (SSN)
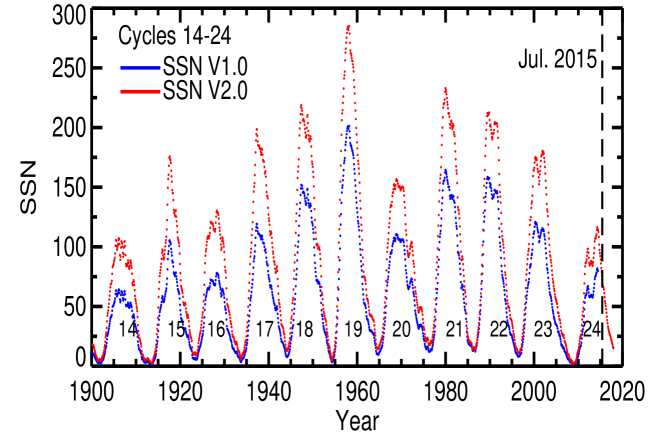
For SSN, we used SSN V1.0 and V2.0 observations obtained from the Royal Observatory of Belgium, Brussels (http://www.sidc.be/silso/datafiles). The original version SSN V1.0 was created in 1849 by R. Wolf who derived the daily total sunspot number by the formula: Rz = Ns + 10Ng, where Ns is the number of sunspots and Ng is the number of sunspot groups. The original version is maintained at Zurich observatory, while a recalibrated SSN V2.0 version was devised after Jul. 2015 and is maintained by the Royal Observatory of Belgium. Observations of the SSN are available since 1749. However, in this study, we have preferred to use SSN V1.0 and V2.0 observations from cycles 14–24 since only the HMF values of cycles 14–24 were used in this study. Figure 1 plots observations of the monthly SSN V1.0 (in blue) and SSN V2.0 (in red) spanning solar cycles 14–24. It is apparent from Fig.1 that there is no large change observed in temporal variation of SSN V2.0 except for the V2.0 values being about 40%–70% higher than V1.0. Also, there is no simple scaling factor between V1.0 and V2.0 that could be used for re-calculation of the predicted peak SSN of solar cycle 25. We have therefore obtained the peak values of SSN in V1.0 and V2.0 during the solar maxima of cycles 14–24 and listed them in Table 2. It is clear from Table 2 that the peak SSN for solar cycles 14–24 in the two versions have different values. Earlier, JBA15 directly employed the correlation equation proposed by Cliver \BBA Ling (\APACyear2011). Based on the correlation between the HMF at solar minimum (Bmin) of the preceding cycle (n-1) and the peak value of sunspot number smoothed over a period of 13-month (SSNmax) of the next cycle (n) these authors reported a correlation equation given by
| (1) |
The peak values of SSN V1.0, from solar cycles 14 to 23, used by Cliver \BBA Ling (\APACyear2011) was from the National Oceanic and Atmospheric Administration Geophysical Data Center and is listed in the fourth column of Table 2. From a comparison of the SSN values in second and fourth columns of Table 2, it is clear that the peak SSN V1.0 used in this study for cycles 14–17 are not in agreement with the peak SSN V1.0 used by Cliver \BBA Ling (\APACyear2011). We have thus, in this paper, updated the correlation between Bmin and SSNmax, derived by Cliver \BBA Ling (\APACyear2011) and consequently also updated the prediction for the amplitude of cycle 25 that was made earlier in JBA15.
| Solar Cycles | |||
|---|---|---|---|
| (V1.0) | (V2.0) | (Cliver \BBA Ling (\APACyear2011)) | |
| Cycle 14 | 64.2 | 107.1 | 77.0 |
| Cycle 15 | 105.4 | 175.7 | 126.5 |
| Cycle 16 | 78.1 | 130.2 | 93.7 |
| Cycle 17 | 119.2 | 198.6 | 143.0 |
| Cycle 18 | 151.8 | 218.7 | 151.8 |
| Cycle 19 | 201.3 | 285.0 | 201.3 |
| Cycle 20 | 110.6 | 156.6 | 110.6 |
| Cycle 21 | 164.5 | 232.9 | 164.5 |
| Cycle 22 | 158.5 | 212.5 | 158.5 |
| Cycle 23 | 120.8 | 180.3 | 120.8 |
| Cycle 24 | 81.9 | 116.4 | - |
2.2 Solar Photospheric Fields (SPF)
The SPF, for this study, were computed using medium-resolution line-of-sight (LOS) synoptic magnetograms from the National Solar Observatory, Kitt Peak (NSO/KP) and the Synoptic Optical Long-term Investigations of the Sun (NSO/SOLIS) facilities. Each synoptic magnetogram is available in standard FITS format and represents one Carrington rotation (CR) or 27.2753 day averaged SPF in units of Gauss. The synoptic magnetograms used here were from Feb. 1975 to Dec. 2017, covering CR1625–CR2197 and spanning solar cycles 21–24. We computed the unsigned values of SPF in the latitude range -, referred to here as polar magnetic fields (PMF). Details about the computation of SPF can be further referred to in Janardhan \BOthers. (\APACyear2018). It must be noted that researchers generally use the signed values of polar fields for SPF studies. However, it is to be kept in mind that in the present study the unsigned values of polar fields in the latitude range - have been used with the signed values of polar fields being used only for comparison with the unsigned polar fields. The signed or unsigned values of polar fields in the latitude range of - were estimated by taking into account the actual magnetic field values or the absolute of the actual magnetic field values, respectively.
2.3 Heliospheric Magnetic Field (HMF)
We used daily measurements of HMF obtained from the OMNI2 data base at 1 AU (http://gsfc.nasa.gov/omniweb) covering the period Feb. 1975Dec. 2017 that span solar cycles 21–24. CR averaged values of HMF were derived in order to compare and correlate them with CR averaged polar fields during solar cycle minima. We used CR averaged values for 1 year intervals around solar minima of cycles 20–23 (Wang \BOthers., \APACyear2009) corresponding to CR1642–1654, CR1771–1783, CR1905–1917, and CR2072–2084, respectively.
3 Results
3.1 Photospheric Magnetic Field (PMF)
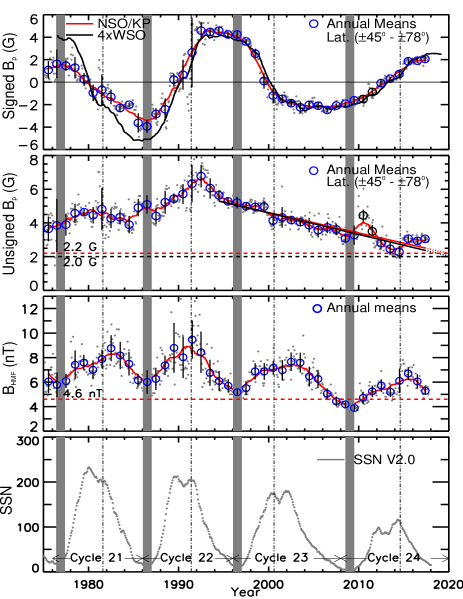
The first panel of Figure 2 plots the signed PMF in the latitude range of - for the period Feb.1975Dec.2017, covering solar cycles 21–24. We have overplotted the smoothed NSO/KP fields (solid red curve) with a 13-month running mean, while for comparison, we have also overplotted the signed WSO PMF (solid black curve) in the latitude range poleward of for the period Apr. 1976–Apr. 2019, covering solar cycles 21–24. It is clear that the overall temporal behaviour of NSO/KP signed PMF during solar cycles 21–24 show a good agreement with WSO signed PMF. Thus, the medium resolution NSO/KP signed PMF are useful to study the large scale nature of PMF. The signed PMF in each solar cycle shows a maximum strength at the start of the cycle, while at solar cycle maximum, it runs through zero and changes the sign of the field. This is known as reversal of PMF or polar reversal. Subsequently, the signed PMF again shows a maximum strength during the minimum of the cycle. Thus, typically, the signed PMF shows an anti-solar cycle behaviour. In cycle 24, after the zero-crossing or reversal of PMF, the signed PMF shows a clear rise in field strength in the year 2015 after solar cycle maximum. Thereafter, it shows a nearly constant value for the next two years in the year, i.e. 2016 and 2017. The steady value of signed PMF is evident up to Apr. 2019, about 1 year prior to the solar minimum of cycle 24, from the variations of WSO signed PMF. It is to be noted that based on zonal and meridional flow patterns during solar cycles 23 and 24, Komm \BOthers. (\APACyear2018) estimated that cycle 25 will begin in early 2020. Similar steady values of signed PMF few years before the minimum of solar cycle can also be seen during earlier solar cycles, i.e. cycles 22 and 23. Thus, besides the typical anti-solar cycle like behaviour of the signed PMF in each solar cycle it also shows steady value or a polar field plateau prior to the minimum of the solar cycle.
The second panel of Fig.2 plots the unsigned NSO/KP PMF in the latitude range of - for the period Feb.1975Dec.2017, covering solar cycles 21–24. It is evident from a careful examination of the strength of the unsigned PMF (see the solid red curve), referred to henceforth as , that unlike the signed PMF the unsigned PMF shows a totally different temporal behaviour. The unsigned PMF shows solar cycle like modulations in cycles 21 and 22, while, in cycle 23, no such solar cycle like modulation is seen. However, we see a steady decline in the field strength since the start of cycle 23 until the end of cycle 23. Again, at the start of solar cycle 24, in the years 2010 and 2011, there was an increase in the . The annual mean for the years 2010 and 2011 is shown by open black circles. After 2011, the again declined from 2012 upto 2014, only to increase again in the year 2015 after the solar maximum of cycle 24 and has been constant since then. Thus, in contrast to the behaviour in previous cycles, the value of , in cycle 24, shows an anti-solar cycle behaviour with a polar field plateau like the signed PMF, with a maximum strength at the start of the cycle attaining a minimum strength around the solar cycle maximum and again showing a rise in strength after the solar cycle maximum and thereafter attaining a steady value.
We further investigate whether the unexpected rise of during the year 2015 and the subsequent constant value for the next two years would change the declining trend. As seen in the years 2010 and 2011, we have already witnessed a rise in the strength of PMF, but the declining trend of the PMF continued after 2011. Hence, we believe that the break in the declining trend during 2015-2017 could be temporary and that the declining trend may continue. However, the increase in the could affect its rate of decline, and thus, change its expected value in 2020, i.e. at the expected minimum of cycle 24. We, therefore, re-estimate the value of in 2020 assuming a continuing declining trend. The solid red line in Fig.2 (second panel) is a least square fit to the declining trend of for all the annual means in the period 1995–2017, while the broken red line is the extrapolation until 2020. The least square fit is statistically significant with a Pearson correlation coefficient of , at a significance level of . Similarly, the solid black line in Fig.2 (second panel) is a least square fit to the declining trend for all the annual means, with the years 2010 ad 2011 being left out, and the broken black line is an extrapolation until 2020. The fit is statistically significant with a Pearson correlation coefficient of , at a significance level of . The expected values of in 2020 for the above two cases are 2.2 (0.08) G and 2.0 (0.06) G, as indicated by the dashed horizontal lines in red and black, respectively in Fig.2 (second panel). Thus, the average expected value of in 2020 would be 2.1 (0.07) G. The expected values of would be 2.1 (0.08) G and 1.9 (0.06) G if the minimum is in 2021 instead. Thus, the average expected value of in 2021 would be 2.0 (0.07) G.
3.2 Heliospheric Magnetic Field (HMF)
The third panel of Fig.2 plots the strength of HMF (BHMF) at 1 AU for the period Feb.1975Dec.2017, covering cycles 21–24. A global reduction in the BHMF from solar cycle 22 through solar cycle 23 to solar cycle 24 is evident from Fig.2 (third panel). Also, it is seen from Fig.2 (third panel) that the HMF returns to an average value at each solar minimum, which is known as the floor value of HMF. The floor level of HMF is essentially determined by the baseline flux from the slow solar wind flows. Svalgaard \BBA Cliver (\APACyear2007) estimated the floor level of 4.6 nT for HMF, indicated by a horizontal red line in Fig.2 (third panel), from a correlation of BHMF and sunspot number in the period covering cycles 20–22. However, it can be seen that the BHMF, during the minimum of cycle 23, went down well below the floor level of 4.6 nT. Further, it is interesting to note, as seen from Fig.2 (third panel) that, in cycle 24, the BHMF by the year 2018 has already approached the value of the floor level of 4.6 nT about two years prior to the minimum of cycle 24. Thus, it is expected that we could witness the floor level of HMF also going down below the proposed floor level of 4.6 nT in cycle 24. The fourth panel of Fig. 2 plots the SSN V2.0 observations as a function of time for the period Feb.1975Dec.2017, covering solar cycles 2124. As mentioned earlier, a global reduction of SSN since cycle 21 upto cycle 24 is evident from Fig.2 (fourth panel).
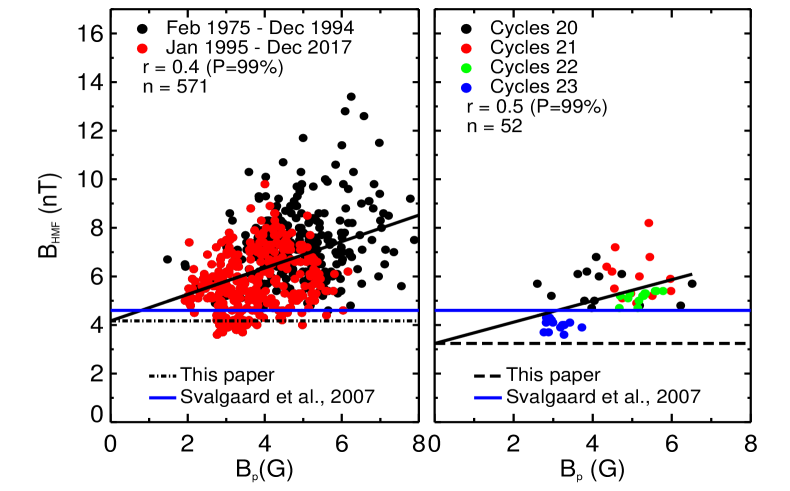
Since the HMF results from solar photospheric fields being swept out into the inner heliosphere and beyond, the declining Bp beginning around mid-1990’s during solar cycle 22, and continuing during cycles 23 and 24 would have contributed to the observed global reduction in the BHMF and the reduction in the floor level of HMF during cycles 23 and 24. A plot of BHMF vs Bp for the period Feb.1975–Dec.2017 is shown in Figure 3 (left). It is evident from Fig.3 that the BHMF values post-1995 (filled red-dots) show a clear reduction in their strength as compared to the values prior to 1995 (filled black-dots). We found a moderately statistically significant correlation of BHMF with Bp with a Pearson correlation coefficient of at a significance level of as indicated at the top right corner of Fig.3 (left). The solid black line in Fig.3 (left) is a best fit to all the data points between BHMF and Bp. The linear correlation of BHMF and Bp can thus be represented by the following equation,
| (2) |
which gives an intercept of 4.2 ( 0.2) nT for BHMF when Bp = 0. This implies that the floor level of the HMF would be 4.2 nT even if solar polar field drops to zero. We, thus, see a reduced floor value of 4.2 nT for HMF (dotted black line in Fig.3 (left panel)), unlike the proposed floor level of 4.6 nT by Svalgaard \BBA Cliver (\APACyear2007) (solid blue line in Fig.3 (left panel)), from a correlation of BHMF and Bp for the period covering solar cycles 21–24. The reduced floor value of HMF is presumably due to the observed global reduction of the BHMF post-1995.
Since solar polar fields provide most of the HMF during solar minimum (Svalgaard \BOthers., \APACyear2005), we now consider the correlation of BHMF and Bp only during solar minima as reported in JBA15 which is also shown in Fig.3 (right panel). The overall fit to all data points between cycles 20–23 is shown by a solid black line in Fig.3 (right) with an intercept of 3.2 (0.5) nT for the HMF when Bp would go to zero and represented by the equation
| (3) |
The floor level of HMF is thus, 3.2 nT indicated by a dashed black line in Fig.3 (right panel), a value that has dropped by more than 1 nT from the proposed floor level of 4.6 nT. This is also due to the reduced HMF during solar cycles 23 and 24. Thus, in order to show the contribution of the reduced HMF (due to declining Bp since the mid-1990’s), we have plotted BHMF Vs. Bp shown by filled dots of different colours for each solar cycle in Fig. 3 (right panel). It is evident from Fig.3 (right panel) that the values of BHMF are above the floor level of 4.6 nT for the minima of cycles 20–22. However, the values of BHMF (filled blue dots in Fig.3 (right panel)) have gone below the floor level of 4.6 nT during the minimum of cycle 23, and so we see the reduction in the floor level of HMF down to 3.2 nT. As stated earlier, one would expect BHMF to go below the floor level of 4.6 nT during the upcoming minimum of cycle 24 too. It means the proposed floor level could be around 3.2 nT. We thus preferred equation 3, having a better correlation than equation 2, to derive the updated expected value of BHMF at the minimum of cycle 24, which was found to be 4.16 (0.6) nT using the updated expected value of Bp at the minimum of cycle 24 of 2.1 G. The previous estimated value of BHMF in 2020 obtained in JBA15 was 3.9 (0.6) nT. If on the other hand the minimum of solar cycle 24 occurs in 2021, then BHMF in 2021 would be 4.12 (0.6) nT.
3.3 Amplitude of solar cycle 25
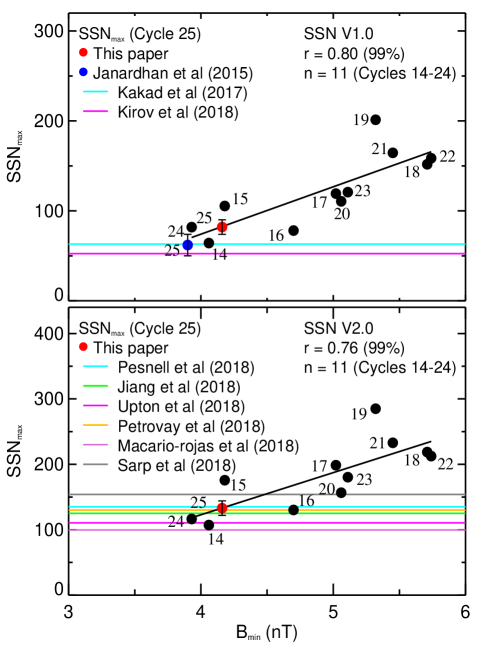
The correlations between Bmin and SSNmax using SSN V1.0 (upper panel) and SSN V2.0 (lower panel) observations are shown in Fig.4. The values of Bmin used in this study are from Cliver \BBA Ling (\APACyear2011) (see Table 2 in Cliver \BBA Ling (\APACyear2011)). The respective Pearson correlation coefficients, r = 0.80 (for V1.0) and 0.76 (for V2.0) at a significance level of 99% are indicated at the top right corner of each panel. The correlation between Bmin and SSNmax for SSN V1.0 is given by
| (4) |
Using the value of Bmin of 3.9 nT for cycle 24 in equation 1, JBA15 derived a SSNmax of 6212 for cycle 25, indicated by a solid blue dot in the upper panel of Fig.4. Using the updated value of Bmin of 4.16 nT for cycle 24 (see section 3.2) in equation 4, we predict a SSNmax of 828 for cycle 25. This value is indicated by a solid red dot with 1 sigma error-bar in the upper panel of Fig.4. The two other predictions, using SSN V1.0 observations, made by Kakad \BOthers. (\APACyear2017) and Kirov \BOthers. (\APACyear2018) have been indicated by the coloured horizontal lines in the the upper panel of Fig.4. It is, thus, seen from the upper panel of Fig.4 that the prediction made in this study, using the SSN V1.0 observations that is different from the SSN observations used in JBA15, show clearly similar or a relatively stronger cycle 25 than cycle 24 which had a SSNmax of 81.9 whereas the predictions made by JBA15 and other researchers (Kakad \BOthers., \APACyear2017; Kirov \BOthers., \APACyear2018) indicated a relatively weaker cycle 25 than cycle 24.
On the other hand, the correlation between Bmin and SSNmax for SSN V2.0 data is given by
| (5) |
Using the value of Bmin of 4.16 nT for cycle 24 in equation 5, we predict a SSNmax of 13311 for cycle 25 if the solar minimum is in 2020. This is shown by a solid red dot with 1 sigma error bar in Fig.4 (lower panel) with the differently coloured horizontal lines indicating predictions for cycle 25 by other researchers, using SSN V2.0 observations. The ratio of the values of SSNmax predicted for cycle 25 to the values of SSNmax for cycle 24 by these authors have been given in Table 1. It is already clear from both Table 1 and from Fig.4 (lower panel) as to why L\BPBIA. Upton \BBA Hathaway (\APACyear2018) and Macario-Rojas \BOthers. (\APACyear2018) argued for a solar cycle 25 that would be more or less like solar cycle 24. In contrast, the prediction reported in this study using SSN V2.0 observations with a SSNmax of 13311 for cycle 25 suggests a relatively stronger cycle 25 than cycle 24, which had a SSNmax of 116. Our prediction, in fact, agrees with the predictions made by Jiang \BOthers. (\APACyear2018), Pesnell \BBA Schatten (\APACyear2018) and Petrovay \BOthers. (\APACyear2018) who claimed a similar result for the amplitude of cycle 25. The SSNmax for cycle 25 would be 828 and 13311 in SSN V1.0 and SSN V2.0, respectively, if solar minimum happens in 2020 and 808 and 13011 in SSN V1.0 and SSN V2.0, respectively, if solar minimum happens in 2021, suggesting again a relatively stronger cycle 25 than cycle 24, which is independent of the time of occurrence of solar minimum in cycle 24.
4 Discussion and conclusions
Our study reports the temporal changes in solar photospheric fields obtained from NSO/KP and NSO/SOLIS synoptic magnetograms, covering solar cycles 21–24, specifically paying attention to the manner in which the unsigned solar polar magnetic fields at latitudes behaved after the mini-solar maximum of cycle 24. In the present study, it has been shown that after the solar cycle maximum of cycle 24, unexpectedly, there has been an increase in the unsigned solar polar field strength in the year 2015 that has subsequently shown a slow and steady change maintaining the declining trend, that had begun around the mid-1990’s, for more than about 22-years. Importantly, it appears that the unsigned solar polar fields have switched their behaviour from solar-cycle-like in cycles 21 and 22 to an anti-solar-cycle-like in cycle 24 and showing no correlation with solar cycle in between suggesting a transition phase of solar magnetic fields during cycle 23.
As per the current understanding of the solar dynamo process that gives rise to the solar cycle and as proposed by solar dynamo models (Charbonneau, \APACyear2010), sunspot or toroidal fields are generated from poloidal fields by solar differential rotation, while poloidal or polar fields are regenerated from toroidal fields by the Babcock-Leighton mechanism (Babcock, \APACyear1961; Leighton, \APACyear1969). This mechanism depends on the systematic tilt angle distribution of bipolar sunspot regions, which, in turn, is determined by the Coriolis force acting on the magnetic flux tubes that rise through the solar surface at different latitudes to produce bipolar sunspot regions (D’Silva \BBA Choudhuri, \APACyear1993). This whole process would result in a large scatter in tilt angle distribution, which along with diffusion and surface flux transport processes could change the solar polar field behaviour in any given solar cycle, therby making it totally different from the previous cycle. The sudden transition of behaviour of unsigned solar polar fields in cycle 24 can, thus, be attributed to the fluctuations in Babcock-Leighton mechanism that decide the net flux transported towards the poles, and thereby, ultimately determining the net polar field strength at the end of a cycle.
Based on the unexpected rise in solar polar fields after July 2014, we have re-estimated, in this study, the new average field strength of 2.1 G for the unsigned solar polar fields in 2020 for the upcoming solar minimum of cycle 24. This value is quite different from the estimate of unsigned solar polar fields of 1.6 G in 2020 that was reported in JBA15. A reduction in the strength of HMF at 1 AU is also clearly seen post July 2014, during solar cycle 24. Also, we have shown that the strength of HMF in cycle 24, post solar maximum and about 2 years prior to the minimum, has nearly approached the average floor level of HMF of 4.6 nT as proposed by Svalgaard \BBA Cliver (\APACyear2007). Using the correlation between the strength of HMF and the unsigned solar polar field strength during cycles 21–24, we found a floor level of 4.2 nT. This decrease in the floor level of the HMF is actually due to the observed global reduction in the HMF during the last two solar cycles 23 and 24. Using the correlation between the strength of HMF and the unsigned solar polar photospheric field strength at minima of cycles 20-23, we have estimated a value of 4.16 for the HMF in 2020 for the upcoming minimum of cycle 24. Further, based on the correlation of HMF at solar minimum and SSNmax from cycles 14–24, we estimated a value of SSNmax of 828 (V1.0) and 133 11 (V2.0) for the upcoming solar cycle 25. Also, expecting a delay in the minimum of cycle 24 by one year, i.e. 2021, we also estimated a value of SSNmax of 808 (V1.0) and 13011 (V2.0) for the upcoming solar cycle 25 if the minimum of cycle 24 would occur in 2021 instead of 2020. Our estimate suggests that the oncoming sunspot cycle 25 will be relatively stronger than cycle 24, but will be weaker than cycles 23. This is different from the prediction made by JBA15 that reported rather a relatively weaker cycle 25 than cycle 24.
Using the values of solar spectral irradiance at 10.7 cm (F10.7) and the averaged polar magnetic field, Pesnell \BBA Schatten (\APACyear2018) computed a solar dynamo amplitude (SODA) index. They used the SODA index as a precursor for predicting the next cycle’s amplitude and estimated a maximum SSN V2.0 of 13525 for cycle 25. The Fe XIV coronal green line emission appears at high latitudes ( ) just before solar cycle maximum, which subsequently drifts to the poles. This is known as rush-to-the-poles (RTTP). Based on the correlations of the rise rate of the RTTP to the delay time between the end of the RTTP and the maximum of the following cycle, Petrovay \BOthers. (\APACyear2018) estimated the maximum SSN V2.0 of cycle 25 of 130. Similarly, using the surface flux transport model Jiang \BOthers. (\APACyear2018) predict the polar field strength at the end of cycle 24 and predicted the amplitude of cycle 25 to be 12532, indicating a 10% stronger cycle 25 than cycle 24. Also, using continuous century-scale data-driven surface flux transport simulations, Bhowmik \BBA Nandy (\APACyear2018) reported a slightly stronger solar cycle 25 than cycle 24 with an SSNmax ranging between 109 and 139 (V2.0). Thus, using the revised SSN V2.0 and the other existing correlations that relate to the strength of the following cycle, the other researchers also arrived at the same conclusion for the amplitude of cycle 25 similar to the relatively stronger cycle 25 as proposed by this study. The relatively stronger upcoming cycle 25 can be understood from the fact that the axial dipole moment during cycle 24 (by Dec. 2017) has been stronger than that during cycle 23 (Jiang \BOthers., \APACyear2018). This is in keeping with the flux transport dynamo model by Choudhuri \BOthers. (\APACyear2007) wherein, the authors predicted a weaker cycle 24 based on the weaker axial dipole moment during cycle 23. With space missions like the Parker Solar Probe being operational and upcoming solar missions like the ADITYA-L1 mission, by India, planned for launch in 2020 (Janardhan \BOthers., \APACyear2017), cycle 25 is bound to reveal more crucial insights into as yet unknown aspects of the internal workings of our sun.
Acknowledgements.
This work has made use of NASA’s OMNIWEB services Data System. The authors thank the free data use policy of the National Solar Observatory (NSO/KP, NSO/SOLIS and NSO/GONG), OMNI2 from NASA and WDC-SILSO at Royal Observatory, Belgium, Brussels. SKB acknowledges the support by the PIFI (Project No. 2015PM066) program of the Chinese Academy of Sciences and the NSFC (Grant No. 11750110422, 11433006, 11790301, and 11790305). SA acknowledges an INSA Honorary Scientist position.References
- Babcock (\APACyear1961) \APACinsertmetastarBab61{APACrefauthors}Babcock, H\BPBIW. \APACrefYearMonthDay1961\APACmonth03. \BBOQ\APACrefatitleThe Topology of the Sun’s Magnetic Field and the 22-YEAR Cycle. The Topology of the Sun’s Magnetic Field and the 22-YEAR Cycle.\BBCQ \APACjournalVolNumPagesApJ133572. {APACrefDOI} 10.1086/147060 \PrintBackRefs\CurrentBib
- Bhowmik \BBA Nandy (\APACyear2018) \APACinsertmetastarBNa18{APACrefauthors}Bhowmik, P.\BCBT \BBA Nandy, D. \APACrefYearMonthDay2018\APACmonth12. \BBOQ\APACrefatitlePrediction of the strength and timing of sunspot cycle 25 reveal decadal-scale space environmental conditions Prediction of the strength and timing of sunspot cycle 25 reveal decadal-scale space environmental conditions.\BBCQ \APACjournalVolNumPagesNature Communications. {APACrefDOI} 10.1038/s41467-018-07690-0 \PrintBackRefs\CurrentBib
- Cameron \BOthers. (\APACyear2016) \APACinsertmetastarCJS16{APACrefauthors}Cameron, R\BPBIH., Jiang, J.\BCBL \BBA Schüssler, M. \APACrefYearMonthDay2016\APACmonth06. \BBOQ\APACrefatitleSolar Cycle 25: Another Moderate Cycle? Solar Cycle 25: Another Moderate Cycle?\BBCQ \APACjournalVolNumPagesApJ823L22. {APACrefDOI} 10.3847/2041-8205/823/2/L22 \PrintBackRefs\CurrentBib
- Charbonneau (\APACyear2010) \APACinsertmetastarCha10{APACrefauthors}Charbonneau, P. \APACrefYearMonthDay2010\APACmonth09. \BBOQ\APACrefatitleDynamo Models of the Solar Cycle Dynamo Models of the Solar Cycle.\BBCQ \APACjournalVolNumPagesLiving Reviews in Solar Physics73. {APACrefDOI} 10.12942/lrsp-2010-3 \PrintBackRefs\CurrentBib
- Choudhuri \BOthers. (\APACyear2007) \APACinsertmetastarCCJ07{APACrefauthors}Choudhuri, A\BPBIR., Chatterjee, P.\BCBL \BBA Jiang, J. \APACrefYearMonthDay2007\APACmonth03. \BBOQ\APACrefatitlePredicting Solar Cycle 24 With a Solar Dynamo Model Predicting Solar Cycle 24 With a Solar Dynamo Model.\BBCQ \APACjournalVolNumPagesPhysical Review Letters9813131103-+. {APACrefDOI} 10.1103/PhysRevLett.98.131103 \PrintBackRefs\CurrentBib
- Choudhuri \BBA Karak (\APACyear2012) \APACinsertmetastarCKa12{APACrefauthors}Choudhuri, A\BPBIR.\BCBT \BBA Karak, B\BPBIB. \APACrefYearMonthDay2012\APACmonth10. \BBOQ\APACrefatitleOrigin of Grand Minima in Sunspot Cycles Origin of Grand Minima in Sunspot Cycles.\BBCQ \APACjournalVolNumPagesPhysical Review Letters10917171103. {APACrefDOI} 10.1103/PhysRevLett.109.171103 \PrintBackRefs\CurrentBib
- Clette \BBA Lefèvre (\APACyear2016) \APACinsertmetastarCLe16{APACrefauthors}Clette, F.\BCBT \BBA Lefèvre, L. \APACrefYearMonthDay2016\APACmonth11. \BBOQ\APACrefatitleThe New Sunspot Number: Assembling All Corrections The New Sunspot Number: Assembling All Corrections.\BBCQ \APACjournalVolNumPagesSol. Phys.2912629-2651. {APACrefDOI} 10.1007/s11207-016-1014-y \PrintBackRefs\CurrentBib
- Cliver (\APACyear2016) \APACinsertmetastarCli16{APACrefauthors}Cliver, E\BPBIW. \APACrefYearMonthDay2016\APACmonth11. \BBOQ\APACrefatitleComparison of New and Old Sunspot Number Time Series Comparison of New and Old Sunspot Number Time Series.\BBCQ \APACjournalVolNumPagesSol. Phys.2912891-2916. {APACrefDOI} 10.1007/s11207-016-0929-7 \PrintBackRefs\CurrentBib
- Cliver \BBA Ling (\APACyear2011) \APACinsertmetastarCLi11{APACrefauthors}Cliver, E\BPBIW.\BCBT \BBA Ling, A\BPBIG. \APACrefYearMonthDay2011\APACmonth12. \BBOQ\APACrefatitleThe Floor in the Solar Wind Magnetic Field Revisited The Floor in the Solar Wind Magnetic Field Revisited.\BBCQ \APACjournalVolNumPagesSol. Phys.274285-301. {APACrefDOI} 10.1007/s11207-010-9657-6 \PrintBackRefs\CurrentBib
- D’Silva \BBA Choudhuri (\APACyear1993) \APACinsertmetastarDCh93{APACrefauthors}D’Silva, S.\BCBT \BBA Choudhuri, A\BPBIR. \APACrefYearMonthDay1993\APACmonth05. \BBOQ\APACrefatitleA theoretical model for tilts of bipolar magnetic regions A theoretical model for tilts of bipolar magnetic regions.\BBCQ \APACjournalVolNumPagesA&A272621. \PrintBackRefs\CurrentBib
- Gopalswamy \BOthers. (\APACyear2018) \APACinsertmetastarGoM18{APACrefauthors}Gopalswamy, N., Mäkelä, P., Yashiro, S.\BCBL \BBA Akiyama, S. \APACrefYearMonthDay2018\APACmonth09. \BBOQ\APACrefatitleLong-term solar activity studies using microwave imaging observations and prediction for cycle 25 Long-term solar activity studies using microwave imaging observations and prediction for cycle 25.\BBCQ \APACjournalVolNumPagesJournal of Atmospheric and Solar-Terrestrial Physics17626-33. {APACrefDOI} 10.1016/j.jastp.2018.04.005 \PrintBackRefs\CurrentBib
- Hathaway \BBA Rightmire (\APACyear2010) \APACinsertmetastarHRi10{APACrefauthors}Hathaway, D\BPBIH.\BCBT \BBA Rightmire, L. \APACrefYearMonthDay2010\APACmonth03. \BBOQ\APACrefatitleVariations in the Suns Meridional Flow over a Solar Cycle Variations in the Suns Meridional Flow over a Solar Cycle.\BBCQ \APACjournalVolNumPagesScience3271350-. {APACrefDOI} 10.1126/science.1181990 \PrintBackRefs\CurrentBib
- Hathaway \BBA Upton (\APACyear2016) \APACinsertmetastarHUp16{APACrefauthors}Hathaway, D\BPBIH.\BCBT \BBA Upton, L\BPBIA. \APACrefYearMonthDay2016\APACmonth11. \BBOQ\APACrefatitlePredicting the amplitude and hemispheric asymmetry of solar cycle 25 with surface flux transport Predicting the amplitude and hemispheric asymmetry of solar cycle 25 with surface flux transport.\BBCQ \APACjournalVolNumPagesJournal of Geophysical Research (Space Physics)12110. {APACrefDOI} 10.1002/2016JA023190 \PrintBackRefs\CurrentBib
- Iijima \BOthers. (\APACyear2017) \APACinsertmetastarIiH17{APACrefauthors}Iijima, H., Hotta, H., Imada, S., Kusano, K.\BCBL \BBA Shiota, D. \APACrefYearMonthDay2017\APACmonth11. \BBOQ\APACrefatitleImprovement of solar-cycle prediction: Plateau of solar axial dipole moment Improvement of solar-cycle prediction: Plateau of solar axial dipole moment.\BBCQ \APACjournalVolNumPagesA&A607L2. {APACrefDOI} 10.1051/0004-6361/201731813 \PrintBackRefs\CurrentBib
- Ingale \BOthers. (\APACyear2019) \APACinsertmetastarIJB19{APACrefauthors}Ingale, M., Janardhan, P.\BCBL \BBA Bisoi, S\BPBIK. \APACrefYearMonthDay2019\APACmonth08. \BBOQ\APACrefatitleBeyond the mini-solar maximum of solar cycle 24: Declining solar magnetic fields and the response of the terrestrial magnetosphere Beyond the mini-solar maximum of solar cycle 24: Declining solar magnetic fields and the response of the terrestrial magnetosphere.\BBCQ \APACjournalVolNumPagesJournal of Geophysical Research (Space Physics)1246363-6883. {APACrefDOI} 10.1029/2019JA026616 \PrintBackRefs\CurrentBib
- Janardhan, Bisoi, Ananthakrishnan, Sridharan\BCBL \BBA Jose (\APACyear2015) \APACinsertmetastarJaS15{APACrefauthors}Janardhan, P., Bisoi, S\BPBIK., Ananthakrishnan, S., Sridharan, R.\BCBL \BBA Jose, L. \APACrefYearMonthDay2015Dec. \BBOQ\APACrefatitleSolar and Interplanetary Signatures of a Maunder-like Grand Solar Minimum around the Corner - Implications to Near-Earth Space Solar and Interplanetary Signatures of a Maunder-like Grand Solar Minimum around the Corner - Implications to Near-Earth Space.\BBCQ \APACjournalVolNumPagesSun and Geosphere10147-156. \PrintBackRefs\CurrentBib
- Janardhan, Bisoi, Ananthakrishnan, Tokumaru\BCBL \BOthers. (\APACyear2015) \APACinsertmetastarJaB15{APACrefauthors}Janardhan, P., Bisoi, S\BPBIK., Ananthakrishnan, S., Tokumaru, M., Fujiki, K., Jose, L.\BCBL \BBA Sridharan, R. \APACrefYearMonthDay2015\APACmonth07. \BBOQ\APACrefatitleA 20 year decline in solar photospheric magnetic fields: Inner-heliospheric signatures and possible implications A 20 year decline in solar photospheric magnetic fields: Inner-heliospheric signatures and possible implications.\BBCQ \APACjournalVolNumPagesJournal of Geophysical Research (Space Physics)1205306-5317. {APACrefDOI} 10.1002/2015JA021123 \PrintBackRefs\CurrentBib
- Janardhan \BOthers. (\APACyear2018) \APACinsertmetastarJaF18{APACrefauthors}Janardhan, P., Fujiki, K., Ingale, M., Bisoi, S\BPBIK.\BCBL \BBA Rout, D. \APACrefYearMonthDay2018\APACmonth10. \BBOQ\APACrefatitleSolar cycle 24: An unusual polar field reversal Solar cycle 24: An unusual polar field reversal.\BBCQ \APACjournalVolNumPagesA&A618A148. {APACrefDOI} 10.1051/0004-6361/201832981 \PrintBackRefs\CurrentBib
- Janardhan \BOthers. (\APACyear2017) \APACinsertmetastarJaS17{APACrefauthors}Janardhan, P., Vadawale, S\BPBIV., Bapat, B., Subramanian, K\BPBIP., Chakrabarty, D.\BCBL \BBA et al. \APACrefYearMonthDay2017\APACmonth11. \BBOQ\APACrefatitleProbing the heliosphere using in-situ payloads on-board Aditya-L1 Probing the heliosphere using in-situ payloads on-board Aditya-L1 .\BBCQ \APACjournalVolNumPagesCurrent Science113620-624. {APACrefDOI} 10.18520/cs/v113/i04/620-624 \PrintBackRefs\CurrentBib
- Jiang \BOthers. (\APACyear2018) \APACinsertmetastarJiW18{APACrefauthors}Jiang, J., Wang, J\BHBIX., Jiao, Q\BHBIR.\BCBL \BBA Cao, J\BHBIB. \APACrefYearMonthDay2018\APACmonth08. \BBOQ\APACrefatitlePredictability of the Solar Cycle Over One Cycle Predictability of the Solar Cycle Over One Cycle.\BBCQ \APACjournalVolNumPagesApJ863159. {APACrefDOI} 10.3847/1538-4357/aad197 \PrintBackRefs\CurrentBib
- Kakad \BOthers. (\APACyear2017) \APACinsertmetastarKKR17{APACrefauthors}Kakad, B., Kakad, A.\BCBL \BBA Ramesh, D\BPBIS. \APACrefYearMonthDay2017\APACmonth07. \BBOQ\APACrefatitleShannon Entropy-Based Prediction of Solar Cycle 25 Shannon Entropy-Based Prediction of Solar Cycle 25.\BBCQ \APACjournalVolNumPagesSol. Phys.29295. {APACrefDOI} 10.1007/s11207-017-1119-y \PrintBackRefs\CurrentBib
- Karak \BBA Choudhuri (\APACyear2013) \APACinsertmetastarKCh13{APACrefauthors}Karak, B\BPBIB.\BCBT \BBA Choudhuri, A\BPBIR. \APACrefYearMonthDay2013\APACmonth11. \BBOQ\APACrefatitleStudies of grand minima in sunspot cycles by using a flux transport solar dynamo model Studies of grand minima in sunspot cycles by using a flux transport solar dynamo model.\BBCQ \APACjournalVolNumPagesResearch in Astronomy and Astrophysics131339-1357. {APACrefDOI} 10.1088/1674-4527/13/11/005 \PrintBackRefs\CurrentBib
- Kirov \BOthers. (\APACyear2018) \APACinsertmetastarKiA18{APACrefauthors}Kirov, B., Asenovski, S., Georgieva, K., Obridko, V\BPBIN.\BCBL \BBA Maris-Muntean, G. \APACrefYearMonthDay2018\APACmonth09. \BBOQ\APACrefatitleForecasting the sunspot maximum through an analysis of geomagnetic activity Forecasting the sunspot maximum through an analysis of geomagnetic activity.\BBCQ \APACjournalVolNumPagesJournal of Atmospheric and Solar-Terrestrial Physics17642-50. {APACrefDOI} 10.1016/j.jastp.2017.12.016 \PrintBackRefs\CurrentBib
- Komm \BOthers. (\APACyear2018) \APACinsertmetastarKHH18{APACrefauthors}Komm, R., Howe, R.\BCBL \BBA Hill, F. \APACrefYearMonthDay2018\APACmonth10. \BBOQ\APACrefatitleSubsurface Zonal and Meridional Flow During Cycles 23 and 24 Subsurface Zonal and Meridional Flow During Cycles 23 and 24.\BBCQ \APACjournalVolNumPagesSol. Phys.293145. {APACrefDOI} 10.1007/s11207-018-1365-7 \PrintBackRefs\CurrentBib
- Leighton (\APACyear1969) \APACinsertmetastarLei69{APACrefauthors}Leighton, R\BPBIB. \APACrefYearMonthDay1969\APACmonth04. \BBOQ\APACrefatitleA Magneto-Kinematic Model of the Solar Cycle A Magneto-Kinematic Model of the Solar Cycle.\BBCQ \APACjournalVolNumPagesApJ1561. {APACrefDOI} 10.1086/149943 \PrintBackRefs\CurrentBib
- Macario-Rojas \BOthers. (\APACyear2018) \APACinsertmetastarMSR18{APACrefauthors}Macario-Rojas, A., Smith, K\BPBIL.\BCBL \BBA Roberts, P\BPBIC\BPBIE. \APACrefYearMonthDay2018\APACmonth09. \BBOQ\APACrefatitleSolar activity simulation and forecast with a flux-transport dynamo Solar activity simulation and forecast with a flux-transport dynamo.\BBCQ \APACjournalVolNumPagesMNRAS4793791-3803. {APACrefDOI} 10.1093/mnras/sty1625 \PrintBackRefs\CurrentBib
- Miyahara \BOthers. (\APACyear2010) \APACinsertmetastarMiK10{APACrefauthors}Miyahara, H., Kitazawa, K., Nagaya, K., Yokoyama, Y., Matsuzaki, H., Masuda, K.\BDBLMuraki, Y. \APACrefYearMonthDay2010\APACmonth06. \BBOQ\APACrefatitleIs the Sun heading for another Maunder Minimum? - Precursors of the grand solar minima Is the Sun heading for another Maunder Minimum? - Precursors of the grand solar minima.\BBCQ \APACjournalVolNumPagesJournal of Cosmology81970-1982. \PrintBackRefs\CurrentBib
- Nandy \BOthers. (\APACyear2011) \APACinsertmetastarNMM11{APACrefauthors}Nandy, D., Muñoz-Jaramillo, A.\BCBL \BBA Martens, P\BPBIC\BPBIH. \APACrefYearMonthDay2011\APACmonth03. \BBOQ\APACrefatitleThe unusual minimumof sunspot cycle 23 caused by meridional plasma flow variations The unusual minimumof sunspot cycle 23 caused by meridional plasma flow variations.\BBCQ \APACjournalVolNumPagesNature. {APACrefDOI} 10.1038/nature09786 \PrintBackRefs\CurrentBib
- Pesnell (\APACyear2018) \APACinsertmetastarPes18{APACrefauthors}Pesnell, W\BPBID. \APACrefYearMonthDay2018\APACmonth12. \BBOQ\APACrefatitleEffects of Version 2 of the International Sunspot Number on Naïve Predictions of Solar Cycle 25 Effects of Version 2 of the International Sunspot Number on Naïve Predictions of Solar Cycle 25.\BBCQ \APACjournalVolNumPagesSpace Weather161997-2003. {APACrefDOI} 10.1029/2018SW002080 \PrintBackRefs\CurrentBib
- Pesnell \BBA Schatten (\APACyear2018) \APACinsertmetastarPSc18{APACrefauthors}Pesnell, W\BPBID.\BCBT \BBA Schatten, K\BPBIH. \APACrefYearMonthDay2018\APACmonth07. \BBOQ\APACrefatitleAn Early Prediction of the Amplitude of Solar Cycle 25 An Early Prediction of the Amplitude of Solar Cycle 25.\BBCQ \APACjournalVolNumPagesSol. Phys.293112. {APACrefDOI} 10.1007/s11207-018-1330-5 \PrintBackRefs\CurrentBib
- Petrovay \BOthers. (\APACyear2018) \APACinsertmetastarPeN18{APACrefauthors}Petrovay, K., Nagy, M., Gerják, T.\BCBL \BBA Juhász, L. \APACrefYearMonthDay2018\APACmonth09. \BBOQ\APACrefatitlePrecursors of an upcoming solar cycle at high latitudes from coronal green line data Precursors of an upcoming solar cycle at high latitudes from coronal green line data.\BBCQ \APACjournalVolNumPagesJournal of Atmospheric and Solar-Terrestrial Physics17615-20. {APACrefDOI} 10.1016/j.jastp.2017.12.011 \PrintBackRefs\CurrentBib
- Sánchez-Sesma (\APACyear2016) \APACinsertmetastarSan16{APACrefauthors}Sánchez-Sesma, J. \APACrefYearMonthDay2016\APACmonth07. \BBOQ\APACrefatitleEvidence of cosmic recurrent and lagged millennia-scale patterns and consequent forecasts: multi-scale responses of solar activity (SA) to planetary gravitational forcing (PGF) Evidence of cosmic recurrent and lagged millennia-scale patterns and consequent forecasts: multi-scale responses of solar activity (SA) to planetary gravitational forcing (PGF).\BBCQ \APACjournalVolNumPagesEarth System Dynamics7583-595. {APACrefDOI} 10.5194/esd-7-583-2016 \PrintBackRefs\CurrentBib
- Sarp \BOthers. (\APACyear2018) \APACinsertmetastarSaK18{APACrefauthors}Sarp, V., Kilcik, A., Yurchyshyn, V., Rozelot, J\BPBIP.\BCBL \BBA Ozguc, A. \APACrefYearMonthDay2018\APACmonth12. \BBOQ\APACrefatitlePrediction of solar cycle 25: a non-linear approach Prediction of solar cycle 25: a non-linear approach.\BBCQ \APACjournalVolNumPagesMNRAS4812981-2985. {APACrefDOI} 10.1093/mnras/sty2470 \PrintBackRefs\CurrentBib
- Sasikumar Raja \BOthers. (\APACyear2019) \APACinsertmetastarSaJ19{APACrefauthors}Sasikumar Raja, K., Janardhan, P., Bisoi, S\BPBIK., Ingale, M., Subramanian, P., Fujiki, K.\BCBL \BBA Maksimovic, M. \APACrefYearMonthDay2019\APACmonth09. \BBOQ\APACrefatitleGlobal Solar Magnetic Field and Interplanetary Scintillations During the Past Four Solar Cycles Global Solar Magnetic Field and Interplanetary Scintillations During the Past Four Solar Cycles.\BBCQ \APACjournalVolNumPagesSol. Phys.294123. {APACrefDOI} 10.1007/s11207-019-1514-7 \PrintBackRefs\CurrentBib
- Svalgaard \BBA Cliver (\APACyear2007) \APACinsertmetastarSCl07{APACrefauthors}Svalgaard, L.\BCBT \BBA Cliver, E\BPBIW. \APACrefYearMonthDay2007\APACmonth06. \BBOQ\APACrefatitleA Floor in the Solar Wind Magnetic Field A Floor in the Solar Wind Magnetic Field.\BBCQ \APACjournalVolNumPagesApJ661L203-L206. {APACrefDOI} 10.1086/518786 \PrintBackRefs\CurrentBib
- Svalgaard \BOthers. (\APACyear2005) \APACinsertmetastarSCK05{APACrefauthors}Svalgaard, L., Cliver, E\BPBIW.\BCBL \BBA Kamide, Y. \APACrefYearMonthDay2005\APACmonth01. \BBOQ\APACrefatitleSunspot cycle 24: Smallest cycle in 100 years? Sunspot cycle 24: Smallest cycle in 100 years?\BBCQ \APACjournalVolNumPagesGeophys. Res. Lett.321104-+. {APACrefDOI} 10.1029/2004GL021664 \PrintBackRefs\CurrentBib
- L. Upton \BBA Hathaway (\APACyear2014) \APACinsertmetastarUHa14{APACrefauthors}Upton, L.\BCBT \BBA Hathaway, D\BPBIH. \APACrefYearMonthDay2014\APACmonth01. \BBOQ\APACrefatitlePredicting the Sun’s Polar Magnetic Fields with a Surface Flux Transport Model Predicting the Sun’s Polar Magnetic Fields with a Surface Flux Transport Model.\BBCQ \APACjournalVolNumPagesApJ7805. {APACrefDOI} 10.1088/0004-637X/780/1/5 \PrintBackRefs\CurrentBib
- L\BPBIA. Upton \BBA Hathaway (\APACyear2018) \APACinsertmetastarUHa18{APACrefauthors}Upton, L\BPBIA.\BCBT \BBA Hathaway, D\BPBIH. \APACrefYearMonthDay2018\APACmonth08. \BBOQ\APACrefatitleAn Updated Solar Cycle 25 Prediction With AFT: The Modern Minimum An Updated Solar Cycle 25 Prediction With AFT: The Modern Minimum.\BBCQ \APACjournalVolNumPagesGeophys. Res. Lett.458091-8095. {APACrefDOI} 10.1029/2018GL078387 \PrintBackRefs\CurrentBib
- Usoskin \BOthers. (\APACyear2007) \APACinsertmetastarUSK07{APACrefauthors}Usoskin, I\BPBIG., Solanki, S\BPBIK.\BCBL \BBA Kovaltsov, G\BPBIA. \APACrefYearMonthDay2007\APACmonth08. \BBOQ\APACrefatitleGrand minima and maxima of solar activity: new observational constraints Grand minima and maxima of solar activity: new observational constraints.\BBCQ \APACjournalVolNumPagesA&A471301-309. {APACrefDOI} 10.1051/0004-6361:20077704 \PrintBackRefs\CurrentBib
- Wang \BOthers. (\APACyear2009) \APACinsertmetastarWRS09{APACrefauthors}Wang, Y\BHBIM., Robbrecht, E.\BCBL \BBA Sheeley, N\BPBIR., Jr. \APACrefYearMonthDay2009\APACmonth12. \BBOQ\APACrefatitleOn the Weakening of the Polar Magnetic Fields during Solar Cycle 23 On the Weakening of the Polar Magnetic Fields during Solar Cycle 23.\BBCQ \APACjournalVolNumPagesApJ7071372-1386. {APACrefDOI} 10.1088/0004-637X/707/2/1372 \PrintBackRefs\CurrentBib
- Zachilas \BBA Gkana (\APACyear2015) \APACinsertmetastarZGk15{APACrefauthors}Zachilas, L.\BCBT \BBA Gkana, A. \APACrefYearMonthDay2015\APACmonth05. \BBOQ\APACrefatitleOn the Verge of a Grand Solar Minimum: A Second Maunder Minimum? On the Verge of a Grand Solar Minimum: A Second Maunder Minimum?\BBCQ \APACjournalVolNumPagesSol. Phys.2901457-1477. {APACrefDOI} 10.1007/s11207-015-0684-1 \PrintBackRefs\CurrentBib
- Zolotova \BBA Ponyavin (\APACyear2014) \APACinsertmetastarZPo14{APACrefauthors}Zolotova, N\BPBIV.\BCBT \BBA Ponyavin, D\BPBII. \APACrefYearMonthDay2014\APACmonth05. \BBOQ\APACrefatitleIs the new Grand minimum in progress? Is the new Grand minimum in progress?\BBCQ \APACjournalVolNumPagesJournal of Geophysical Research (Space Physics)1193281-3285. {APACrefDOI} 10.1002/2013JA019751 \PrintBackRefs\CurrentBib