| Obs. in bins of (relative to upper cut-off) | |||||||
| Council | 0.05 | 0.10 | 0.15 | ||||
| Municipal population | members | Below | Above | Below | Above | Below | Above |
| (1) | (2) | (3) | (4) | (5) | (6) | (7) | (8) |
| 0-5000 | 7 | 62 | 91 | 125 | 152 | 178 | 211 |
| 5001-10000 | 9 | 104 | 126 | 231 | 243 | 350 | 351 |
| 10001-20000 | 11 | 84 | 91 | 197 | 174 | 322 | 268 |
| 20001-50000 | 13 | 40 | 34 | 79 | 64 | 121 | 89 |
| 50001-100000 | 15 | 20 | 15 | 35 | 26 | 50 | 40 |
| 100001-250000 | 17 | 2 | 7 | 9 | 12 | 14 | 18 |
| 250001-1000000 | 19 | 1 | 0 | 2 | 0 | 4 | 2 |
More than 1 million & 21 0 0 0 0 0 0 Notes: Columns 1 and 2 summarize the mapping of municipal populations to council sizes as prescribed by Law 136 of 1994: if a municipality’s population is less than or equal to 5,000, the council must consist of seven members; if the population is greater than 5,000 but less than or equal to 10,000, the council size must be nine members, and so on. Columns 3-8 show the number of observations for different bandwidths (the widths of the “window” of observations around the respective population thresholds). As is discussed in Section LABEL:empiricalstrategy, the analysis focuses on municipalities with a population of at least 15,000 inhabitants.
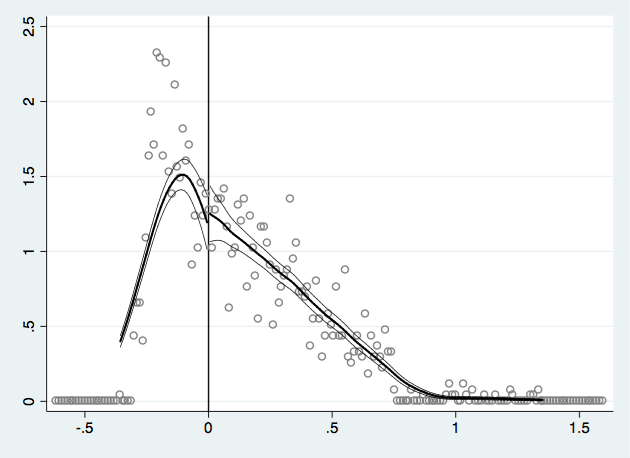
This figure shows a finely-gridded histogram of the population smoothed using local linear regressions, separately on either side of the cutoff of the density function of the population. The figure pools all years, uses data only around the normalized population threshold, and includes municipalities with a population of at least 15,000 inhabitants. The estimate of the difference in the height at the threshold and robust manipulation p-value (as implemented in Stata by the command rddensity.ado, (see Cattaneo et al., 2018a) is 0.025 (s.e. 0.142) and p-value 0.577.
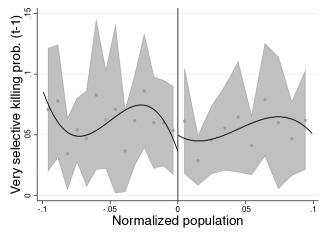
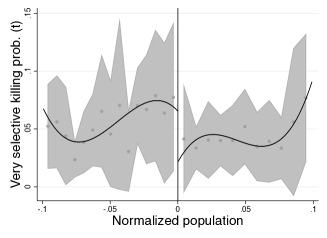
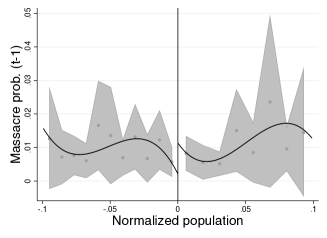
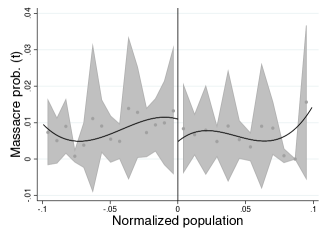
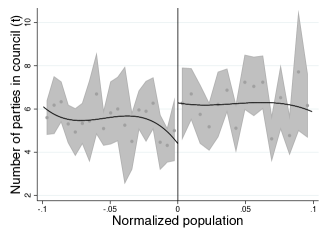
These figures show conflict-related killings by normalized population size, with a negative value indicating smaller councils. The bandwidth (h) is chosen optimally using the algorithm by Calonico et al. (2014b) as implemented in Stata by the command rdplot.ado. No controls or fixed effects are included. The shaded regions represent the 95% confidence interval.
RD Estimate -1.099 -0.921∗ -0.126 -3.580 (0.712) (0.471) (0.291) (4.078) Observations 2355 2355 2355 2325 Eff. Number of obs 544 548 657 569 BW Loc. Poly. (h) 0.093 0.093 0.111 0.097 Robust p-value 0.134 0.071 0.637 0.471 Panel C: rate RD Estimate -2.829 -2.955∗ -0.010 -4.488 (2.408) (1.744) (0.982) (9.656) Observations 2355 2355 2355 2318 Eff. Number of obs 558 583 598 589 BW Loc. Poly. (h) 0.095 0.097 0.100 0.101 Robust p-value 0.292 0.097 0.936 0.696 Notes: All columns report the RD estimates of having a larger council from Eq. (LABEL:rdbaseline) when the respective characteristic is used as the dependent variable. The dependent variable in panel A is the average over the electoral term of a dummy variable equal to 1 if the particular type of killing is observed in a municipality in a quarter of a year. The dependent variable in panels B and C is the average of the total number of killings and killings per 100,000 people, respectively. The bandwidth (h) is chosen optimally using the algorithm by Calonico et al. (2014b) as implemented in Stata by the command rdrobust.ado, and includes fixed effects for population threshold, electoral term and region. Standard errors clustered by municipality are reported in parentheses. * significant at 10%, ** significant at 5%, *** significant at 1%.
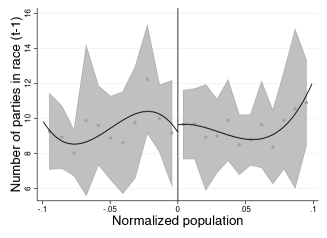
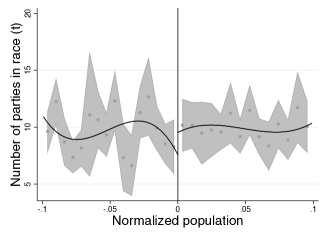
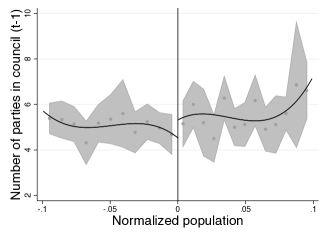
These figures show electoral outcomes by normalized population size, with a negative value indicating smaller councils. The bandwidth (h) is chosen optimally using the algorithm by Calonico et al. (2014b) as implemented in Stata by the command rdplot.ado. No controls or fixed effects are included. The shaded regions represent the 95% confidence interval.
Mayoralty (entire sample) RD Estimate -0.061 -0.093 -0.007 -0.045∗∗∗ -0.040∗∗∗ -0.005 (0.098) (0.089) (0.005) (0.016) (0.015) (0.004) Observations 212 212 212 2143 2143 2143 Eff. Number of obs 39 44 22 688 648 579 BW Loc. Poly. (h) 0.069 0.076 0.052 0.126 0.119 0.108 Robust p-value 0.360 0.223 0.157 0.014 0.020 0.269 Panel C: Mayoralty (close victory) RD Estimate -0.151∗ -0.144∗ -0.007∗ -0.024 -0.021 -0.003 (0.087) (0.086) (0.004) (0.027) (0.028) (0.003) Observations 77 77 77 96 96 96 Eff. Number of obs 25 24 20 30 29 28 BW Loc. Poly. (h) 0.095 0.093 0.065 0.118 0.117 0.110 Robust p-value 0.108 0.104 0.031 0.556 0.649 0.190 Notes: All columns report the RD estimates of having a larger council from Eq. (LABEL:rdbaseline) when the respective characteristic is used as the dependent variable. The bandwidth (h) is chosen optimally using the algorithm by Calonico et al. (2014b) as implemented in Stata by the command rdrobust.ado, and includes fixed effects for population threshold, electoral term and region. Standard errors clustered by municipality are reported in parentheses. * significant at 10%, ** significant at 5%, *** significant at 1%
% of votes in next Senate elections (only 2002 and 2006 elections) RD Estimate 4.646 -2.731 0.565 6.990∗ -1.063 (3.835) (1.911) (3.755) (4.031) (5.210) Observations 1016 1016 1016 498 518 Eff. Number of obs 271 235 253 111 137 BW Loc. Poly. (h) 0.118 0.100 0.109 0.103 0.111 Robust p-value 0.251 0.120 0.777 0.090 0.853 Notes: All columns report the RD estimates of having a larger council from Eq. (LABEL:rdbaseline) when the respective characteristic is used as the dependent variable. The bandwidth (h) is chosen optimally using the algorithm by Calonico et al. (2014b) as implemented in Stata by the command rdrobust.ado, and includes fixed effects for population threshold, electoral term and region. Standard errors clustered by municipality are reported in parentheses. * significant at 10%, ** significant at 5%, *** significant at 1%.
References
- Acemoglu et al. (2013) Acemoglu, D., Robinson, J. A. and Santos, R. J. (2013). The monopoly of violence: Evidence from colombia. Journal of the European Economic Association, 11, 5–44.
- Avila (2010) Avila, A. (2010). Injerencia polÃtica de los grupos armados ilegales. In C. Lopez (ed.), Y Refundaron la Patria.. De como mafiosos y politicos reconfiguraron el Estado Colombiano, Debate.
- Avila and Velasco (2012) — and Velasco, J. D. (2012). Parapoliticos, narcos, guerrilleros y votos: revisitando el problema de la teoria democratica a partir del caso colombiano. Papel Politico, 17 (2), 371–421.
- Basset (2008) Basset, Y. (2008). La izquierda colombiana en tiempos de uribe. Nueva sociedad, (214), 4–13.
- Bates et al. (2002) Bates, R., Greif, A. and Singh, S. (2002). Organizing violence. Journal of Conflict Resolution, 46 (5), 599–628.
- Bertanha (2020) Bertanha, M. (2020). Regression discontinuity design with many thresholds. Journal of Econometrics, 218 (1), 216 – 241.
- Brutus (2003) Brutus (2003). Letter no. 3. In T. Ball (ed.), The Federalist: with Letters of Brutus, Cambridge University Press.
- Buchanan and Tullock (1962) Buchanan, J. M. and Tullock, G. (1962). The Calculus of Consent: Logical Foundations of Constitutional Democracy. University of Michigan Press.
- Calonico et al. (2014a) Calonico, S., Cattaneo, M. D. and Titiunik, R. (2014a). Robust data-driven inference in the regression-discontinuity design. Stata Journal, 14 (4), 909–946.
- Calonico et al. (2014b) —, — and — (2014b). Robust nonparametric confidence intervals for regression discontinuity designs. Econometrica, 82 (6), 2295–2326.
- Cattaneo et al. (2020a) Cattaneo, M. D., Idrobo, N. and Titiunik, R. (2020a). A Practical Introduction to Regression Discontinuity Designs: Foundations. Elements in Quantitative and Computational Methods for the Social Sciences, Cambridge University Press.
- Cattaneo et al. (2018a) Cattaneo, M. D., Jansson, M. and Ma, X. (2018a). Manipulation testing based on density discontinuity. The Stata Journal, 18 (1), 234–261.
- Cattaneo et al. (2018b) —, — and Ma, X. (2018b). Simple Local Polynomial Density Estimators. arXiv e-prints, arXiv:1811.11512.
- Cattaneo et al. (2016) Cattaneo, M. D., Keele, L., Titiunik, R. and Vazquez-Bare, G. (2016). Interpreting regression discontinuity designs with multiple cutoffs. The Journal of Politics, 78 (4), 1229–1248.
- Cattaneo et al. (2020b) —, —, — and — (2020b). Extrapolating treatment effects in multi-cutoff regression discontinuity designs.
- Chavarro (2013) Chavarro, A. (2013). La creación de municipios en colombia después de la constitución de 1991. Administración & Desarrollo, 41 (57), 73–91.
- CINEP (2008) CINEP (2008). Marco Conceptual. Banco de Datos sobre Derechos Humanos y Violencia PolÃtica. Tech. rep., Centro de Investigación y Educación Popular - CINEP.
- Clarin (2007) Clarin (2007). Entrevista al segundo jefe de las farc. https://www.clarin.com/ediciones-anteriores/farc-podrian-participar-administracion-socialdemocrata_0_SyfGekxyCtl.html, online; consulted 17 May 2019.
- Clark and Golder (2006) Clark, W. R. and Golder, M. (2006). Rehabilitating duverger’s theory: Testing the mechanical and strategic modifying effects of electoral laws. Comparative Political Studies, 39 (6), 679–708.
- Coppedge et al. (2011) Coppedge, M., Gerring, J., Altman, D., Bernhard, M., Fish, S., Hicken, A., Kroenig, M., Lindberg, S. I., McMann, K., Paxton, P. and et al. (2011). Conceptualizing and measuring democracy: A new approach. Perspectives on Politics, 9 (2), 247–267.
- DANE (2009) DANE (2009). Metodologia Proyecciones de Poblacion y Estudios Demograficos. Coleccion Documentos 81, Departamento Administrativo Nacional de Estadistica (DANE).
- Deas (2015) Deas, M. (2015). The colombian conflict: A historical perspective. In B. M. Bagley and J. D. Rosen (eds.), Colombia’s Political Economy at the Outset of the Twenty-First Century: From Uribe to Santos and Beyond, Lexington Books.
- Dube and Vargas (2013) Dube, O. and Vargas, J. F. (2013). Commodity Price Shocks and Civil Conflict: Evidence from Colombia. Review of Economic Studies, 80 (4), 1384–1421.
- Duncan (2015) Duncan, G. (2015). Exclusión, insurrección y crimen. In Contribución al entendimiento del conflicto armado en Colombia, Comisi’on Hist’orica del Conflicto y sus Víctima.
- Duque (2008) Duque, J. (2008). Las organizaciones políticas étnicas en colombia. los indígenas y las elecciones 1990-2006. iberoamericana, 8 (32), 7–30.
- Duverger ([1951] 1992) Duverger, M. ([1951] 1992). Les Partis politiques.
- Eggers et al. (2018) Eggers, A. C., Freier, R., Grembi, V. and Nannicini, T. (2018). Regression discontinuity designs based on population thresholds: Pitfalls and solutions. American Journal of Political Science, 62 (1), 210–229.
- ElTiempo (2009) ElTiempo (2009). Convergencia ciudadana cambia de nombre, ahora será el partido de integración nacional. https://www.eltiempo.com/archivo/documento/CMS-6549307, online; consulted 17 May 2019.
- Fergusson et al. (2017) Fergusson, L., Querubín, P., Ruiz, N. A. and Vargas, J. F. (2017). The Real Winner’s Curse. Documentos CEDE 015279, Universidad de los Andes - CEDE.
- Fergusson and Vargas (2013) — and Vargas, J. F. (2013). Don’t make war, make elections: Franchise extension and violence in XIXth-century Colombia. Documentos de Trabajo 010545, Universidad del Rosario.
- Fiscalia (2012) Fiscalia (2012). Entre alcaldes, exalcaldes y exconcejales mas de 470 vinculados por nexos con autodefensas. Fiscalía General de la Nación, http://www.fiscalia.gov.co/colombia/noticias/entre-alcaldes-exalcaldes-y-exconcejales-mas-de-470-vinculados-por-nexos-con-autodefensas/.
- Francois et al. (2015) Francois, P., Rainer, I. and Trebbi, F. (2015). How is power shared in africa? Econometrica, 83 (2), 465–503.
- Gafaro et al. (2014) Gafaro, M., Ibanez, A. M. and Justino, P. (2014). Local Institutions and Armed Group Presence in Colombia. HiCN Working Papers 178, Households in Conflict Network.
- Garay et al. (2008) Garay, L., Salcedo-Albarín, E., León-Beltrán, I. and Guerrero, B. (2008). La captura y reconfiguración cooptada del estado en Colombia. Fundación Método, Fundación Avina and Transparencia por Colombia.
- GMH (2013a) GMH (2013a). Basta ya! Colombia: memorias de guerra y dignidad. Informe General. Grupo de Memoria Historica; Imprenta Nacional.
- GMH (2013b) — (2013b). Guerrilla y Población Civil. Trayectoria de las FARC 1949-2013. Grupo de Memoria Historica, Imprenta Nacional.
- Gutierrez (2015) Gutierrez, F. (2015). Conexiones coactivas: Paramilitares y alcaldes en colombia. Análisis Político, 28 (85), 131–157.
- Gutierrez (2019) — (2019). Clientelistic Warfare: Paramilitaries and the State in Colombia (1982–2007). Peter Lang Ltd.
- Gutierrez and Baron (2005) — and Baron, M. (2005). Re-stating the State: Paramilitary territorial control and political order in Colombia, 1978-2004. Working paper 66, Development Research Center, LSE, [Online; accessed 7 July 2015].
- Harari and La Ferrara (2013) Harari, M. and La Ferrara, E. (2013). Conflict, Climate and Cells: A Disaggregated Analysis. CEPR Discussion Papers 9277, C.E.P.R. Discussion Papers.
- Hartzell and Hoddie (2003) Hartzell, C. and Hoddie, M. (2003). Institutionalizing peace: Power sharing and post-civil war conflict management. American Journal of Political Science, 47 (2), pp. 318–332.
- Ibanez and Velez (2008) Ibanez, A. M. and Velez, C. E. (2008). Civil conflict and forced migration: The micro determinants and welfare losses of displacement in colombia. World Development, 36 (4), 659 – 676.
- Indepaz (2012) Indepaz (2012). Parapolitica en el senado 2006-2010. http://www.indepaz.org.co/wp-content/uploads/2012/04/Parapolitica-27-abril-2012.pdf, online; consulted 17 May 2019.
- Kalyvas (2006) Kalyvas, S. N. (2006). The Logic of Violence in Civil War. Cambridge University Press.
- Kitschelt (1986) Kitschelt, H. P. (1986). Political opportunity structures and political protest: Anti-nuclear movements in four democracies. British Journal of Political Science, 16 (1), 57–85.
- Laurent (2010) Laurent, V. (2010). Con bastones de mando o en el tarjeton. movilizaciones politicas indigenas en colombia. Colombia Internacional, (71).
- Lijphart (1977) Lijphart, A. (1977). Democracy in Plural Societies. A Comparative Exploration. Yale University Press.
- Lijphart (1994) — (1994). Electoral Systems and Party Systems: A Study of Twenty-Seven Democracies, 1945-1990.
- Lopez (2010) Lopez, C. (2010). La refundacion de la patria, de la teoria a la evidencia. In C. Lopez (ed.), Y Refundaron la Patria.. De como mafiosos y politicos reconfiguraron el Estado Colombiano, Debate.
- Lopez and Sevillano (2008) — and Sevillano, O. (2008). Balance político de la parapolítica. Arcanos, pp. 62–87.
- Madison (2003) Madison, J. (2003). Federalist papers no. 10 and 55. In T. Ball (ed.), The Federalist: with Letters of Brutus, Cambridge University Press.
- McCrary (2008) McCrary, J. (2008). Manipulation of the running variable in the regression discontinuity design: A density test. Journal of Econometrics, 142 (2), 698–714.
- MOE (2013) MOE (2013). Misión de observación electoral: Parapolítica histórica desde 1995 a 2013. http://moe.org.co/home/doc/moe_mre/2013/Parapoliticaactualizadofebrero2013.pdf, online; consulted 17 May 2019.
- Neto and Cox (1997) Neto, O. A. and Cox, G. W. (1997). Electoral institutions, cleavage structures, and the number of parties. American Journal of Political Science, 41 (1), 149–174.
- North et al. (2009) North, D. C., Wallis, J. J. and Weingast, B. R. (2009). Violence and Social Orders. A Conceptual Framework for Interpreting Recorded Human History. Cambridge University Press.
- Olson (1993) Olson, M. (1993). Dictatorship, democracy, and development. The American Political Science Review, 87 (3), pp. 567–576.
- Palacios and Safford (2002) Palacios, M. and Safford, F. (2002). Colombia: Fragmented Land, Divided Society. Oxford University Press.
- Powell (2013) Powell, R. (2013). Monopolizing violence and consolidating power. Quarterly Journal of Economics, 128.
- Rae (1967) Rae, D. (1967). The Political Consequences of Electoral Laws.
- Restrepo et al. (2004) Restrepo, J., Spagat, M. and Vargas, J. (2004). The Dynamics of the Columbian Civil Conflict: A New Dataset. Homo Oeconomicus, 21, 396–429.
- Reynal-Querol (2002a) Reynal-Querol, M. (2002a). Ethnicity, political systems, and civil wars. Journal of Conflict Resolution, 46 (1), 29–54.
- Reynal-Querol (2002b) — (2002b). Political systems, stability and civil wars. Defence and Peace Economics, 13 (6), 465–483.
- Reynal-Querol (2005) — (2005). Does democracy preempt civil wars? European Journal of Political Economy, 21 (2), 445–465.
- Romero (2005) Romero, M. (2005). Paramilitares y Autodefensas, 1982-2003. Instituto de Estudios Politicos y Relationes Internacionales.
- Rousseau (2012) Rousseau, J.-J. (2012). The Major Political Writings of Jean-Jacques Rousseau: The Two Discourses and the Social Contract. University Of Chicago Press.
- Sanchez and Palau (2006) Sanchez, F. and Palau, M. (2006). Conflict, Decentralisation and Local Governance in Colombia, 1974-2004. HiCN Working Papers 14, Households in Conflict Network.
- Sanchez (2001) Sanchez, G. (2001). Problems of violence, prospects for peace. In C. W. Bergquist, G. Sanchez and R. Penaranda (eds.), Violence in Colombia, 1990-2000: Waging War and Negotiating Peace, Wilmington, Del.: SR Books.
- Sanchez de la Sierra (2015) Sanchez de la Sierra, R. (2015). On the Origins of States: Stationary Bandits and Taxation in Eastern Congo. Tech. rep.
- Semana (2000) Semana (2000). Banderas alternativas. https://www.semana.com/nacion/articulo/banderas-alternativas/43516-3, online; consulted 17 May 2019.
- Semana (2007) — (2007). Dieb maloof - movimiento colombia viva. https://www.semana.com/on-line/articulo/dieb-maloof-movimiento-colombia-viva/88713-3, online; consulted 17 May 2019.
- Semana (2011) — (2011). Renace la izquierda. https://www.semana.com/nacion/articulo/renace-izquierda/248956-3, online; consulted 17 May 2019.
- Spinoza (2016) Spinoza, B. d. (2016). The Collected Works of Spinoza, Volume II. Princeton University Press.
- Taagepera and Shugart (1989) Taagepera, R. and Shugart, M. S. (1989). Seats and votes: The effects and determinants of electoral systems.
- Valencia (2007) Valencia, L. (2007). Los caminos de la allianza entre los paramilitaries y los politicos. In M. Romero (ed.), Para Politica: La Ruta de la Expansion Paramilitar y los Acuerdos Politicos, Corporacion Nuevo Arco Iris: Intermedio.
- Verdad Abierta (2012) Verdad Abierta (2012). Las sumas y restas de la justicia frente a la parapolÃtica. http://www.verdadabierta.com/component/content/article/4276-las-sumas-y-restas-de-la-justicia-frente-a-la-parapolitica.
- Waldron (1999) Waldron, J. (1999). The Dignity of Legislation. Cambridge University Press.
Appendix A : Supplemental Figures and Tables

Frequency of municipalities by population size. The vertical lines show the population thresholds used to determine the council size. To facilitate the exposition, it includes municipalities with a population up to 275,000.
All figures pool all years, and show finely-gridded histograms of the population smoothed using local linear regression, separately on either side of the cutoff of the density function of the population. Each figure uses data only around the corresponding population threshold. The estimates of the difference in the height at the threshold and robust manipulation p-values (as implemented in Stata by the command rddensity.ado, (see Cattaneo et al., 2018a), are: (a) 0.092 (s.e. 0.177) and p-value 0.2549; (b) -0.055 (s.e. 0.304) and p-value 0.5612; (c) -0.316 (s.e. 0.441) and p-value 0.6704; (d) -0.207 (s.e. 0.669) and p-value 0.2358.
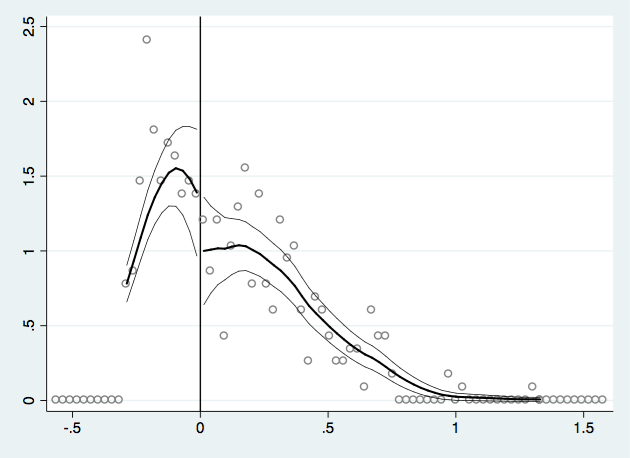
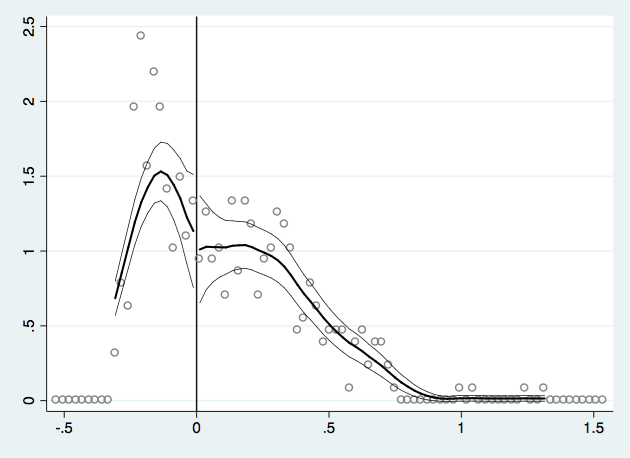
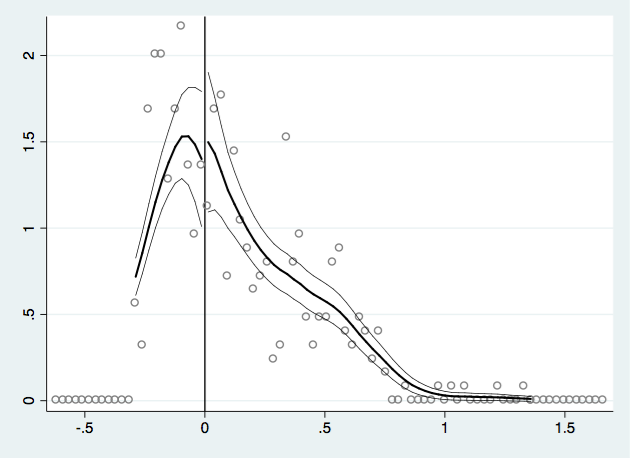
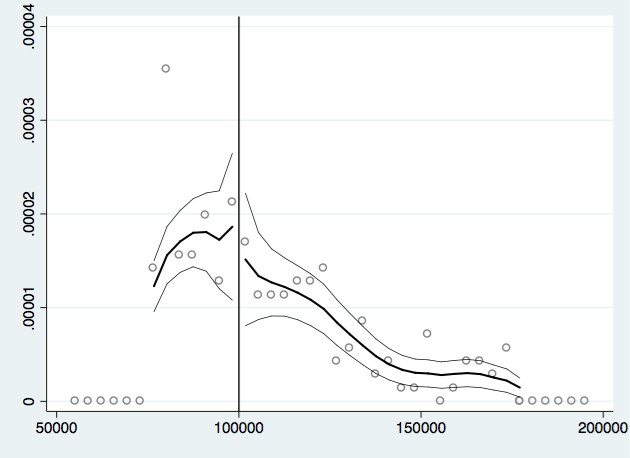
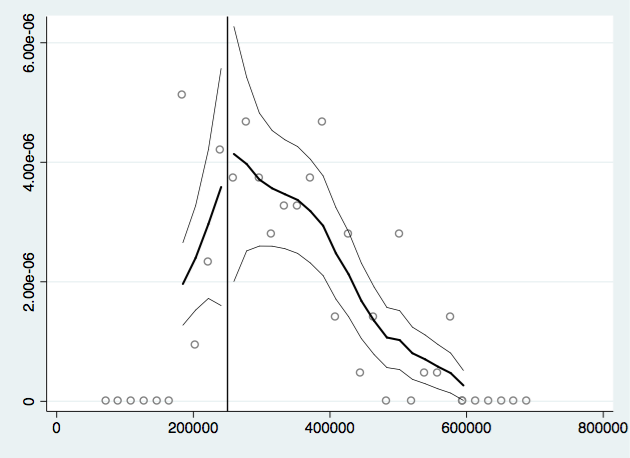
All figures show finely-gridded histograms of the population smoothed using local linear regression, separately on either side of the cutoff of the density function of the population McCrary (2008); Cattaneo et al. (2018a). Each figure uses data only around the corresponding population threshold, and includes municipalities with a population of at least 15,000 inhabitants. The estimates of the difference in the height at the threshold and robust manipulation p-values (as implemented in Stata by the command rddensity.ado, (see Cattaneo et al., 2018a), are: (a) -0.299 (s.e. 0.273) and p-value 0.266, (b) 0.112 (s.e. 0.263) and p-value 0.732, (c) -0.073 (s.e. 0.284) and p-value 0.391, (d) 0.133 (s.e. 0.220) and p-value 0.271.
All figures pool all years, and show finely-gridded histograms of the population smoothed using local linear regression, separately on either side of the cutoff of the density function of the population. Each figure uses data only around the corresponding population threshold. The estimates of the difference in the height at the threshold and robust manipulation p-values (as implemented in Stata by the command rddensity.ado, (see Cattaneo et al., 2018a), are: (a) 0.326 (s.e. 0.190) and p-value 0.0685; (b) 0.350 (s.e. 0.176) and p-value 0.0613.
Panel (a) shows the scatterplot of municipal category by population size; panel (b) shows the scatterplot averaged over 1,000-inhabitant bins plus running-mean smoothing performed separately in each interval between two thresholds. The vertical lines identify the population thresholds used in the determination of the council size. To facilitate the exposition it includes municipalities with a population of 250,000 or less.
Panel (a) shows the scatterplot of current spending by population size; panel (b) shows the scatterplot averaged over 1,000-inhabitant bins plus running-mean smoothing performed separately in each interval between two thresholds. The vertical lines identify the population thresholds used in the determination of the council size. To facilitate the exposition it includes municipalities with a population of 250,000 or less.
Excluding 100,000 threshold RD Estimate 0.018 0.672 0.861∗ 0.764∗ (0.032) (0.859) (0.463) (0.459) Observations 1350 1743 1743 1743 Eff. Number of obs 329 379 412 370 BW Loc. Poly. (h) 0.100 0.089 0.096 0.086 Robust p-value 0.607 0.593 0.098 0.118 Notes: All columns report the RD estimates of having a larger council from Eq. (LABEL:rdbaseline) when the respective characteristic is used as the dependent variable. The bandwidth (h) is chosen optimally using the algorithm by Calonico et al. (2014b) as implemented in Stata by the command rdrobust.ado, and includes fixed effects for population threshold, electoral term and region. Standard errors clustered by municipality are reported in parentheses. * significant at 10%, ** significant at 5%, *** significant at 1%.
[H]
| Political | % of senators | |
| party | prosecuted or convicted | |
| 1 | Colombia Viva1 | 100% |
| 2 | Colombia Democratica2 | 100% |
| 3 | Convergencia Popular Cívica | 100% |
| 4 | Convergencia Ciudadana3 | 63% |
| 5 | Alas-Equipo Colombia4 | 60% |
| 6 | Cambio Radical | 47% |
| 7 | Partido de la U | 37% |
| 8 | Conservador | 22% |
| Notes: The data on senators prosecuted or convicted because of close ties to paramilitary groups are from Lopez and Sevillano (2008), Indepaz (2012) and MOE (2013), which report information obtained from justice authorities. The baseline definition includes the first five parties listed, where the majority of the leaders were involved in the parapolitics scandal. An alternative definition also includes the Cambio Radical. | ||
-
1
Includes the Integracion Popular, whose leaders it incorporated (Semana, 2007).
-
2
Includes the Mov. Popular Unido, Mov. Nacional Progresista and Moral from which it originated, and the Mov. de Inclusion y Oportunidades to which it was renamed (see Lopez and Sevillano, 2008).
-
3
Includes the Integracion Nacional, to which it was renamed (see ElTiempo, 2009).
-
4
Includes the parties ALAS and Equipo Colombia, from which it originated (see Lopez and Sevillano, 2008).
[H]
| Political Party | |||
| 1 | Union Patriotica | 9 | Frente Social y Politico |
| 2 | Polo Democratico Alternativo | 10 | Movimiento 19 de abril |
| 3 | Polo Democratico Independiente | 11 | Socialdemocrata Colombiano |
| 4 | Partido Comunista | 12 | Independiente Frente de Esperanza |
| 5 | Alianza Nacional Popular ANAPO | 13 | Movimiento Ciudadano |
| 6 | Alianza Democratica M19 | 14 | Alternativa Democratica |
| 7 | MOIR | 15 | Unidad Democratica |
| 8 | Frente Social y Politico | 16 | Vamos Ipiales |
| Notes: The classification of left-wing parties mainly follows (see Fergusson et al., 2017), and adds the Partido Comunista and excludes the Autoridades Indigenas de Colombia, which may be described as an ethnic party (see Duque, 2008; Laurent, 2010). An alternative definition also includes the parties Via Alterna and Socialismo Democratico (see Semana, 2000, 2011). Fergusson et al. (2017) propose a classification of the ideology of 505 different parties that either won or came second in mayoral elections during the period I focus on. Since Fergusson et al. (2017) focus on parties that are relevant in mayoral elections (while I focus on council elections), the estimates that use this measure may be less precise than with perfect data. However, it is reasonable to think that if a local party is relevant in mayoral elections, it is also relevant in council elections. | |||
Appendix B Omitted Robustness Checks
In this Appendix, I provide additional details about the robustness exercises reported in the text.
Tables LABEL:tableRDconflictrobustnescontrolcrime to LABEL:tableRDconflictavnpqdcl show that the results in Section LABEL:mainresults are robust to a variety of additional specifications. Table LABEL:tableRDconflictrobustnescontrolcrime includes controls for previous crime rates. Table LABEL:tableRDconflictbaselinyearly uses yearly averages instead of averages over the electoral period. Table LABEL:tableRDconflictnothresholds3or5 excludes the 20,000 and 100,000 population thresholds (since some key pre-treatment variables may change discontinuously at these thresholds, or other policies may serve as confounding factors). Table LABEL:tableRDconflictbaselineextendeperiod includes the 2011 and 2015 elections (using the data from the NCHM described in the footnote LABEL:dataNCHM). All the estimates are consistent with those in Table LABEL:tableRDconflictbaseline, and many of them are more precise.
Table LABEL:tableRDconflictrobustnessratio examines the robustness of the results in Table LABEL:tableRDconflictbaseline to the use of an alternative dependent variable: the ratio of conflict-related killings to total killings. Notably, the estimates for selective killings are again negative, statistically significant and more precise than the estimates in Panel C in Table LABEL:tableRDconflictbaseline. Table LABEL:tableRDconflictavnpqdcl examines whether there is an effect on other types of conflict-related violence. It looks at combatant deaths and unintended civilian casualties. No estimates are statistically different from zero, which provides additional evidence that the effect of larger councils on conflict-related violence is specific to killings that deliberately target civilians.
RD Estimate -1.177∗∗ -1.082∗∗∗ -0.048 (0.493) (0.298) (0.219) Observations 7128 7128 7128 Eff. Number of obs 1604 1552 2010 BW Loc. Poly. (h) 0.091 0.087 0.113 Robust p-value 0.015 0.001 0.800 Panel C: Rate RD Estimate -3.526∗∗ -4.068∗∗∗ 0.157 (1.616) (1.075) (0.738) Observations 7128 7128 7128 Eff. Number of obs 1567 1391 1552 BW Loc. Poly. (h) 0.088 0.078 0.087 Robust p-value 0.035 0.000 0.667 Notes: All columns report the RD estimates of having a larger council from Eq. (LABEL:rdbaseline) when the respective characteristic is used as the dependent variable. The dependent variable in panel A is the average over the years following an election of a dummy variable equal to 1 if the particular type of killing is observed in a municipality in a quarter of a year. The dependent variable in panels B and C is the average of the total number of killings and killings per 100,000 people, respectively. The bandwidth (h) is chosen optimally using the algorithm by Calonico et al. (2014b) as implemented in Stata by the command rdrobust.ado, and includes fixed effects for population threshold, year and region. Standard errors clustered by municipality are reported in parentheses. * significant at 10%, ** significant at 5%, *** significant at 1%.
Excluding 100,000 threshold RD Estimate -0.037∗∗ -0.032∗ -0.005 (0.019) (0.017) (0.006) Observations 1743 1743 1743 Eff. Number of obs 537 551 411 BW Loc. Poly. (h) 0.126 0.128 0.096 Robust p-value 0.071 0.096 0.397 Notes: All columns report the RD estimates of having a larger council from Eq. (LABEL:rdbaseline) when the respective characteristic is used as the dependent variable. The bandwidth (h) is chosen optimally using the algorithm by Calonico et al. (2014b) as implemented in Stata by the command rdrobust.ado, and includes fixed effects for population threshold, electoral term (or year) and region. Standard errors clustered by municipality are reported in parentheses. * significant at 10%, ** significant at 5%, *** significant at 1%.