11email: nils.ryde@astro.lu.se 22institutetext: Materials Science and Applied Mathematics, Malmö University, SE-205 06 Malmö, Sweden 33institutetext: INAF-Arcetri Astrophysical Observatory, Largo E. Fermi 5, I-50125 Firenze (Italy)
33email: oliva@arcetri.astro.it 44institutetext: INAF - Osservatorio di Astrofisica e Scienza dello Spazio di Bologna, Via Gobetti 93/3, I-40129, Bologna, (Italy) 55institutetext: Dipartimento di Fisica e Astronomia, Universitá degli Studi di Roma Tor Vergata, Via della Ricerca Scientifica 1, I-00133, Roma (Italy) 66institutetext: INAF - Osservatorio Astronomico di Roma, Via Frascati 33, I-00040, Monte Porzio Catone (Italy)
Stellar population astrophysics (SPA) with the TNG††thanks: Based on observations made with the Italian Telescopio Nazionale Galileo (TNG) operated on the island of La Palma by the Fundación Galileo Galilei of the INAF (Istituto Nazionale di Astrofisica) at the Spanish Observatorio del Roque de los Muchachos of the Instituto de Astrofisica de Canarias. This study is part of the Large Program titled SPA - Stellar Population Astrophysics: the detailed, age-resolved chemistry of the Milky Way disk (PI: L. Origlia), granted observing time with HARPS-N and GIANO-B echelle spectrographs at the TNG.
Abstract
Context. In the advent of new infrared, high-resolution spectrometers, accurate and precise atomic data in the infrared is urgently needed. Identifications, wavelengths, strengths, broadening and hyper-fine splitting parameters of stellar lines in the near-IR are in many cases not accurate enough to model observed spectra, and in other cases even non existing. Some stellar features are unidentified.
Aims. The aim with this work is to identify a spectral feature at nm or nm seen in spectra of stars of different spectral types, observed with the GIANO-B spectrometer.
Methods. Searching for spectral lines to match the unidentified feature in linelists from standard atomic databases was not successful. However, by investigating the original, published laboratory data we were able to identify the feature and solve the problem. To confirm its identification, we model the presumed stellar line in the solar intensity spectrum and find an excellent match.
Results. We find that the observed spectral feature is a stellar line originating from the 4s’–4p’ transition in S I, and that the reason for its absence in atomic line databases is a neglected air-to-vacuum correction in the original laboratory measurements from 1967 for this line only. From interpolation we determine the laboratory wavelength of the S I line to be nm or nm, and the excitation energy of the upper level to be 9.74978 eV.
Key Words.:
Physical data and processes: atomic data – Instrumentation: spectrographs – Galaxy: solar neighbourhood – Stars: abundances1 Introduction
In recent years several new cross-dispersed, near-infrared spectrometers have been developed. These can capture large portions of one or more infrared bands (Y, J, H, K, L and/or M bands) simultaneously, which in principle increases the near-IR observing efficiency dramatically. Examples of high-resolution () spectrometers are GIANO-B (Origlia et al. 2014), IGRINS (Yuk et al. 2010), WINERED (Ikeda et al. 2018), and CRIRES+ (Follert et al. 2014; Brucalassi et al. 2018) spectrometers. Also several medium-resolution () spectrometers, such as APOGEE (Majewski et al. 2016, 2017) and NIRSPEC (McLean 2005) can record large parts of a near-IR band in one setting. This will also be the case of the MOONS spectrometer (Cirasuolo & MOONS Consortium 2016; Taylor et al. 2018) which is under development and will be placed at the VLT. Furthermore, the next generation of extremely large telescopes with their huge apertures will provide enhanced sensitivity in medium-high resolution near-IR spectroscopy, thanks to spectrometers such as MOSAIC (; Jagourel et al. 2018) and HIRES (; Oliva et al. 2018b) for the ELT.
The near-IR spectral region is therefore emerging as a spectral domain for versatile astrophysical use in an efficient way. However, since the near-IR wavelength region has not been as explored as the optical region for astrophysical use, the spectral data, such as line identifications, wavelengths, strengths, broadening and hyper-fine splitting parameters, are lagging behind. These data are, nevertheless, vitally needed for any spectral investigation, both at high and low spectral resolution (see e.g. Ruffoni & Pickering 2015).
Experimental and theoretical progress is, however, being made to ameliorate the situation. Recent work include, for instance, experimental oscillator strengths of 28 Fe i lines in the H band (m), following an urgent need from the APOGEE survey (Ruffoni et al. 2013) and measurements of line strengths of magnesium (Pehlivan Rhodin et al. 2017) and scandium (Pehlivan et al. 2015). These Sc data were vital in, for example, the discussion on K-band Sc abundances in the Nuclear Star Cluster by Thorsbro et al. (2018). Other examples are the works on WINERED spectra by Kondo et al. (2019) who investigated Fe-lines at m in spectra of red giants and their usefulness for determining the metallicity and microturbulence and the work by Fukue et al. (2015) concerning the development of the line-depth ratio method to determine effective temperatures of classical Cepheids in the H band. Furthermore, in the K band, not many measurements on relevant atomic data, such as wavelengths and lines strengths, from laboratory spectra exist at all and the line wavelengths in the VALD database (e.g. Piskunov et al. 1995) are often uncertain. An example taken from Thorsbro (2016) is a Si i line at 2114.4 nm with atomic physics parameters estimated theoretically (Kurucz 2007). This line can be identified in the solar spectrum to have a wavelength shift of as much as 0.1 nm. Correcting the wavelength and checking against other stars, like Arcturus, shows that its identification is correct. Thorsbro (2016) further shows that there is a clear difference in the wavelength accuracy in the K band for different elements, sulphur having the smallest spread, and silicon and calcium requiring the largest corrections in order to match the solar spectrum.
| Name | Spectral Type | [Fe/H] | reference | ||
|---|---|---|---|---|---|
| HD15316 | A2Iab | 8770 | 1.7 | - | Verdugo et al. (1999) |
| HD13784 | F0II2 | 7080 | 2.1 | 0.0 | Luck (2014) |
| HD40457 (CO Aur) | F5Ib (classical Cepheid) | 6620 | 2.5 | -0.1 | Luck (2014) |
| HD187921 (SV Vul) | F8Ia (classical Cepheid) | 4900 - 6330 | 0.29 - 1.28 | 0.0 | Luck (2018) |
| HD12650 | G2II | 5325 | 2.7 | - | Hohle et al. (2010) |
| HD14346 | K0II | 4585 | 2.2 | - | Hohle et al. (2010) |
In the same spirit, we present in this paper the identification of an unidentified feature at nm in a range of stellar spectra observed at high spectral resolution with the GIANO-B spectrometer. We discuss the line’s behaviour with stellar effective temperature and finally identify it as a S i line. We also discuss why it was missed in earlier works.
2 Observations and spectral analysis
Six giants and supergiants of spectral types from A to K were observed with GIANO-B, the high resolution (R50,000) infrared (950–2450 nm) spectrometer (Oliva et al. 2012b, a; Origlia et al. 2014) of the Telescopio Nazionale Galileo (TNG). The stars and their stellar parameters are provided in Table 1.
GIANO was designed for direct feeding of light at a dedicated focus of the TNG. In 2012 the instrument was provisionally commissioned and used in the ”GIANO-A” configuration; with the spectrometer positioned on the rotating building and fed via a pair of fibers connected to another focal station (Tozzi et al. (2014)). In 2016 the spectrometer was eventually moved to the originally foreseen configuration (called ”GIANO-B”) where it can also be used in the ”GIARPS” mode for simultaneous observations with HARPS-N (Tozzi et al. 2016).
GIANO provides a fully automated online data reduction pipeline based on the ”GOFIO” reduction software (Rainer et al. (2018)) that processes all the observed data; from the calibrations (darks, flats and U-Ne lamps taken in day-time) to the scientific frames. The main feature of the GOFIO data reduction is the optimal spectral extraction and wavelength calibration based on a physical model of the spectrometer that accurately matches instrumental effects such a variable slit tilt and orders curvature over the echellogram (Oliva et al. 2018a).
The spectra presented here were collected in November 2018 with the spectrometer in the ”GIARPS” configuration. For an optimal subtraction of the detector artifacts and background, the spectra were collected nodding the star along the slit; i.e. with the target alternatively positioned at 1/4 (position A) and 3/4 (position B) of the slit length. Integration time was 5 minutes per A,B position. The nodding sequences were repeated to achieve a total integration time between 40 and 60 minutes per target.
The telluric absorption features were corrected using the spectra of a telluric standard (O-type star) taken at different airmasses during the same nights. The normalized spectra of the telluric standard taken at low and high airmass values were combined with different weights to match the depth of the telluric lines in the stellar spectra.
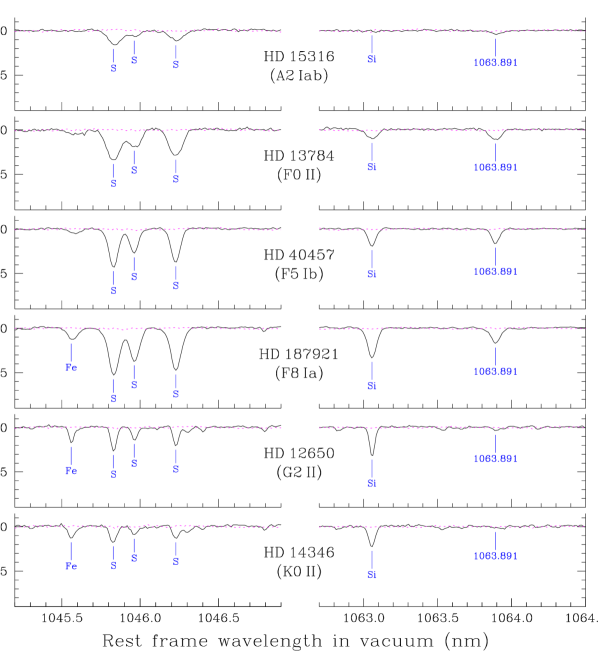
Figure 1 shows the normalized GIANO-B spectra of stars with different temperatures. The telluric correction applied is shown as a dashed line; it is negligible in the spectral region of interest here. The positions of the stronger atomic lines are marked. The wavelength scale is in the rest frame of each star, determined using standard cross-correlation techniques including the full GIANO-B spectrum (970 - 2450 nm). The final accuracy in the spectral region of interest here is 0.001 nm rms.
3 Discussion and conclusions
The unidentified feature at nm ( nm) resembles a single spectral line, broadened similarly as nearby spectral lines, especially in the four cooler stars (see Figure 1). Due to the fact that the telluric spectra do not show appreciable features in this region and the fact that the feature is at the same stellar rest-wavelength in all stars, the possibility of it being a telluric line is excluded and it therefore has to be a stellar feature.
The feature becomes very shallow at temperatures below 5000 K and above 8000 K. This is a typical behaviour of a highly excited spectral line of a neutral ion; it disappears at high temperatures due to the ionization equilibrium and at lower temperatures the line gets weaker due to lower degree of excitation. However, no known line lies at this wavelength according to the NIST (Kramida et al. 2018) and VALD (Piskunov et al. 1995) databases. The closest lines are much further away than any reasonable uncertainty of measured laboratory wavelengths of any known atom, or the uncertainty of the wavelength scale of the observed spectra.
A first clue as to the origin of the spectral feature can be found in the similar behaviour of the close-by sulphur-line triplet at 1046 nm, lines with an excitation energy of eV. These lines originate from the transitions, have been measured in the laboratory by Zerne et al. (1997), and were successfully used in a work on the galactic chemical evolution of sulphur in the galaxy (e.g. Caffau et al. 2007; Jönsson et al. 2011). They change in strength in a similar way as the feature at nm, see Figure 1. We have therefore searched for measured S i lines in the literature.
In the NIST database there is indeed an S i line at (). This line has only slightly higher excitation energy than the triplet at 1046 nm, namely eV and would fit in nicely with the line strength variation with effective temperatures of the observed stars. The wavelength of the line is, however, too far away for being accommodated within a random uncertainty in the wavelength measurement.
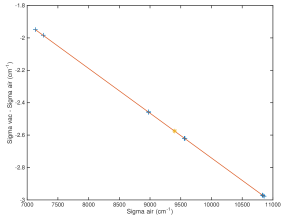
The relevant laboratory data for S i, on which the NIST spectral data are derived, is from the work by Jakobsson (1967). They used a high-frequency discharge with sulfur dioxide as a light source to produce the sulfur lines. Since the wavelength region studied was the ’extraphotographic infrared’, the light was fed into a 1 m scanning grating spectrograph operated with a nitrogen-cooled PbS-detector which fed a pen recorder producing the spectrum. Their primary data are the air wavenumbers, , subsequently converted to air wavelengths, , and vacuum wavenumbers, , in their Table 1. As can be seen there, for the 4s’ 1D2 - 4p’ 1F3 line the vacuum wavenumber, denoted by , was not corrected for the refractive index to provide = 1063.5993 nm (), while the correction has been properly applied to all the other lines. The correction amounts to about 2.6 cm-1, which can fully account for the observed wavelength mismatch.
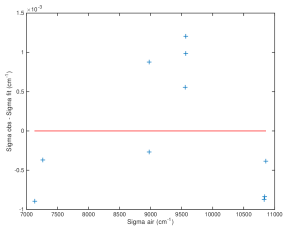
Unfortunately, neither the procedure for the conversion to vacuum data, nor the value used for the refractive index is presented in the paper. Since is slowly varying with wavenumber, we use the laboratory data of the neighbouring lines to interpolate the true laboratory data for the missing line, as presented in Figure 2. We find a wavenumber shift () of cm-1. We thus derive a new value of cm-1(=1063.8908 nm).
As is seen in the right panel of Figure 2, the difference between the laboratory value and the fitted value is around 0.001 cm-1 or less, corresponding to 1 mÅ. This is an order of magnitude smaller compared to the stated uncertainty of the laboratory data, well justifying the linear interpolation. For the discussed lines, measured by Jakobsson (1967) by a photoelectric setup, they estimate the wavenumber accuracy to be better than 0.01 cm-1, corresponding to 10 mÅ or 0.001 nm at these wavelengths. We estimate the uncertainty in our new values to be of the same magnitude. In addition, we choose to report the same number of digits for the numbers as the original reference. The new atomic wavelengths and wavenumber are reported in Table 2, along with the oscillator strength as listed in the NIST database (Kramida et al. 2018), from the calculations by Zatsarinny & Bartschat (2006). The uncertainty of this value, quoted by the authors, is 2%.
The energy of the 1F3 level (upper level of the transition) is, due to the sparse number of lines, derived only from one line (i.e. the one under investigation in this paper). Since the current value is based on the the wrong wavenumber, we thus use the new wavenumber to derive a corrected energy of the 3s23p3(2D)4p 1F3 level. The new excitation energy of the level is = 78637.303 cm-1 = 9.7497830(10) eV
| Spices | S I |
|---|---|
| Wavelength (in vacuum) | 1063.8908(11) nm |
| Wavelength (in air) | 1063.5993(11) nm |
| Wavenumber | 9399.461(10) cm-1 |
| (NIST: Zatsarinny & Bartschat 2006) | 0.391(10) |
| (lower) (Jakobsson 1967) | 8.5844037(10) eV |
| (upper) | 78637.303(10) cm-1 |
| (upper) | 9.7497830(10) eV |
| Lower level Term | |
| Higher level Term |
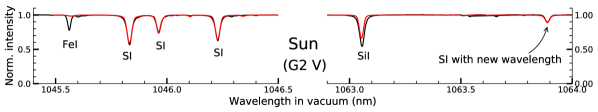
Being confident that the published wavelength of the S i line from the original reference (Jakobsson 1967) is wrong, due to an air to vacuum conversion mistake, we finally check our new wavelength by synthesizing the solar-center intensity-spectrum observed with the Fourier Transform Spectrometer at the McMath/Pierce Solar Telescope at Kitt Peak (Wallace et al. 1993) for the wavelength region around the S i line. To do this we use the spectral synthesis code Spectroscopy Made Easy, SME (Valenti & Piskunov 1996, 2012), in which the radiative transfer and line formation is calculated for a model atmosphere defined by the fundamental stellar parameters of the Sun. SME uses a grid of model atmospheres in which the code interpolates for a given set of fundamental parameters of the analyzed star. We use 1-dimensional MARCS models, which are hydrostatic model photospheres in plane-parallel geometry, computed assuming LTE, chemical equilibrium, homogeneity, and conservation of the total flux (radiative plus convective, the convective flux being computed using the mixing-length recipe) (Gustafsson et al. 2008). We calculate the synthetic spectrum of the solar spectrum as an intensity spectrum of the solar center.
In Figure 3 we show our synthesised solar spectra together with the observed intensity spectrum of the solar center. As can be seen the previously unidentified line fits well and in tandem with the sulfur triplet at 1046 nm. We can thus confidently move the S i line in the NIST database to its correct wavelength as determined from the GIANO-B spectra. The final parameters of this S i line are summarized in Table 2.
Acknowledgements.
This research has been partly supported by the Royal Physiographic Society in Lund through Stiftelsen Walter Gyllenbergs fond and Märta och Erik Holmbergs donation. Data is used from the Fourier Transform Spectrometer at the McMath/Pierce Solar Telescope situated on Kitt Peak, Arizona, operated by the National Solar Observatory, a Division of the National Optical Astronomy Observatories. NOAO is administered by the Association of Universities for Research in Astronomy, Inc., under cooperative agreement with the National Science Foundation.References
- Brucalassi et al. (2018) Brucalassi, A., Dorn, R. J., Follert, R., et al. 2018, in Society of Photo-Optical Instrumentation Engineers (SPIE) Conference Series, Vol. 10702, Ground-based and Airborne Instrumentation for Astronomy VII, 1070239
- Caffau et al. (2007) Caffau, E., Faraggiana, R., Bonifacio, P., Ludwig, H. G., & Steffen, M. 2007, A&A, 470, 699
- Cirasuolo & MOONS Consortium (2016) Cirasuolo, M. & MOONS Consortium. 2016, in Astronomical Society of the Pacific Conference Series, Vol. 507, Multi-Object Spectroscopy in the Next Decade: Big Questions, Large Surveys, and Wide Fields, ed. I. Skillen, M. Balcells, & S. Trager, 109
- Follert et al. (2014) Follert, R., Dorn, R. J., Oliva, E., et al. 2014, in Society of Photo-Optical Instrumentation Engineers (SPIE) Conference Series, Vol. 9147, Ground-based and Airborne Instrumentation for Astronomy V, 914719
- Fukue et al. (2015) Fukue, K., Matsunaga, N., Yamamoto, R., et al. 2015, ApJ, 812, 64
- Grevesse et al. (2007) Grevesse, N., Asplund, M., & Sauval, A. J. 2007, Space Sci. Rev., 130, 105
- Gustafsson et al. (2008) Gustafsson, B., Edvardsson, B., Eriksson, K., et al. 2008, A&A, 486, 951
- Hohle et al. (2010) Hohle, M. M., Neuhäuser, R., & Schutz, B. F. 2010, Astronomische Nachrichten, 331, 349
- Ikeda et al. (2018) Ikeda, Y., Kobayashi, N., Kondo, S., et al. 2018, in Society of Photo-Optical Instrumentation Engineers (SPIE) Conference Series, Vol. 10702, Ground-based and Airborne Instrumentation for Astronomy VII, 107025U
- Jagourel et al. (2018) Jagourel, P., Fitzsimons, E., Hammer, F., et al. 2018, in Society of Photo-Optical Instrumentation Engineers (SPIE) Conference Series, Vol. 10702, Ground-based and Airborne Instrumentation for Astronomy VII, 10702A4
- Jakobsson (1967) Jakobsson, L. R. 1967, Arkiv för Fysik (Stockholm), 34, 19
- Jönsson et al. (2011) Jönsson, H., Ryde, N., Nissen, P. E., et al. 2011, A&A, 530, A144
- Kondo et al. (2019) Kondo, S., Fukue, K., Matsunaga, N., et al. 2019, ApJ, 875, 129
- Kramida et al. (2018) Kramida, A., Yu. Ralchenko, Reader, J., & and NIST ASD Team. 2018, NIST Atomic Spectra Database (ver. 5.6.1), [Online]. Available: https://physics.nist.gov/asd [2019, June 10]. National Institute of Standards and Technology, Gaithersburg, MD.
- Kurucz (2007) Kurucz, R. L. 2007, Robert L. Kurucz on-line database of observed and predicted atomic transitions
- Luck (2014) Luck, R. E. 2014, AJ, 147, 137
- Luck (2018) Luck, R. E. 2018, AJ, 156, 171
- Majewski et al. (2016) Majewski, S. R., APOGEE Team, & APOGEE-2 Team. 2016, Astronomische Nachrichten, 337, 863
- Majewski et al. (2017) Majewski, S. R., Schiavon, R. P., Frinchaboy, P. M., et al. 2017, AJ, 154, 94
- McLean (2005) McLean, I. S. 2005, in High Resolution Infrared Spectroscopy in Astronomy, ed. H. U. Käufl, R. Siebenmorgen, & A. F. M. Moorwood, 25
- Oliva et al. (2012a) Oliva, E., Biliotti, V., Baffa, C., et al. 2012a, in Society of Photo-Optical Instrumentation Engineers (SPIE) Conference Series, Vol. 8453, High Energy, Optical, and Infrared Detectors for Astronomy V, 84532T
- Oliva et al. (2012b) Oliva, E., Origlia, L., Maiolino, R., et al. 2012b, in Society of Photo-Optical Instrumentation Engineers (SPIE) Conference Series, Vol. 8446, Ground-based and Airborne Instrumentation for Astronomy IV, 84463T
- Oliva et al. (2018a) Oliva, E., Sanna, N., Rainer, M., et al. 2018a, in Society of Photo-Optical Instrumentation Engineers (SPIE) Conference Series, Vol. 10702, Ground-based and Airborne Instrumentation for Astronomy VII, 1070274
- Oliva et al. (2018b) Oliva, E., Tozzi, A., Ferruzzi, D., et al. 2018b, in Society of Photo-Optical Instrumentation Engineers (SPIE) Conference Series, Vol. 10702, Ground-based and Airborne Instrumentation for Astronomy VII, 107028O
- Origlia et al. (2014) Origlia, L., Oliva, E., Baffa, C., et al. 2014, in Society of Photo-Optical Instrumentation Engineers (SPIE) Conference Series, Vol. 9147, Ground-based and Airborne Instrumentation for Astronomy V, 91471E
- Pehlivan et al. (2015) Pehlivan, A., Nilsson, H., & Hartman, H. 2015, A&A, 582, A98
- Pehlivan Rhodin et al. (2017) Pehlivan Rhodin, A., Hartman, H., Nilsson, H., & Jönsson, P. 2017, A&A, 598, A102
- Piskunov et al. (1995) Piskunov, N. E., Kupka, F., Ryabchikova, T. A., Weiss, W. W., & Jeffery, C. S. 1995, A&AS, 112, 525
- Rainer et al. (2018) Rainer, M., Harutyunyan, A., Carleo, I., et al. 2018, in Society of Photo-Optical Instrumentation Engineers (SPIE) Conference Series, Vol. 10702, Ground-based and Airborne Instrumentation for Astronomy VII, 1070266
- Ruffoni & Pickering (2015) Ruffoni, M. & Pickering, J. C. 2015, in IAU General Assembly, Vol. 29, 2254967
- Ruffoni et al. (2013) Ruffoni, M. P., Allende Prieto, C., Nave, G., & Pickering, J. C. 2013, ApJ, 779, 17
- Taylor et al. (2018) Taylor, W., Cirasuolo, M., Afonso, J., et al. 2018, in Society of Photo-Optical Instrumentation Engineers (SPIE) Conference Series, Vol. 10702, Ground-based and Airborne Instrumentation for Astronomy VII, 107021G
- Thorsbro (2016) Thorsbro, B. 2016, The Near-Infrared as a Spectral Hunting Ground, Tech. rep., Lund Observatory
- Thorsbro et al. (2018) Thorsbro, B., Ryde, N., Schultheis, M., et al. 2018, ApJ, 866, 52
- Tozzi et al. (2016) Tozzi, A., Oliva, E., Iuzzolino, M., et al. 2016, in Society of Photo-Optical Instrumentation Engineers (SPIE) Conference Series, Vol. 9908, Ground-based and Airborne Instrumentation for Astronomy VI, 99086C
- Tozzi et al. (2014) Tozzi, A., Oliva, E., Origlia, L., et al. 2014, in Society of Photo-Optical Instrumentation Engineers (SPIE) Conference Series, Vol. 9147, Ground-based and Airborne Instrumentation for Astronomy V, 91479N
- Valenti & Piskunov (1996) Valenti, J. A. & Piskunov, N. 1996, A&AS, 118, 595
- Valenti & Piskunov (2012) Valenti, J. A. & Piskunov, N. 2012, SME: Spectroscopy Made Easy, astrophysics Source Code Library
- Verdugo et al. (1999) Verdugo, E., Talavera, A., & Gómez de Castro, A. I. 1999, A&A, 346, 819
- Wallace et al. (1993) Wallace, L., Hinkle, K., & Livingston, W. C. 1993, APS Meeting Abstracts
- Yuk et al. (2010) Yuk, I.-S., Jaffe, D. T., Barnes, S., et al. 2010, in Society of Photo-Optical Instrumentation Engineers (SPIE) Conference Series, Vol. 7735, Society of Photo-Optical Instrumentation Engineers (SPIE) Conference Series
- Zatsarinny & Bartschat (2006) Zatsarinny, O. & Bartschat, K. 2006, Journal of Physics B Atomic Molecular Physics, 39, 2861
- Zerne et al. (1997) Zerne, R., Caiyan, L., Berzinsh, U., & Svanberg, S. 1997, Phys. Scr, 56, 459