Correlations between Word Vector Sets
Abstract
Similarity measures based purely on word embeddings are comfortably competing with much more sophisticated deep learning and expert-engineered systems on unsupervised semantic textual similarity (STS) tasks. In contrast to commonly used geometric approaches, we treat a single word embedding as e.g. 300 observations from a scalar random variable. Using this paradigm, we first illustrate that similarities derived from elementary pooling operations and classic correlation coefficients yield excellent results on standard STS benchmarks, outperforming many recently proposed methods while being much faster and trivial to implement. Next, we demonstrate how to avoid pooling operations altogether and compare sets of word embeddings directly via correlation operators between reproducing kernel Hilbert spaces. Just like cosine similarity is used to compare individual word vectors, we introduce a novel application of the centered kernel alignment (CKA) as a natural generalisation of squared cosine similarity for sets of word vectors. Likewise, CKA is very easy to implement and enjoys very strong empirical results.
1 Introduction
Distributed representations of text have had a massive impact on the natural language processing (NLP), information retrieval (IR), and machine learning (ML) communities, thanks in part to their ability to capture rich notions of semantic similarity. While this work originally began with word embeddings (Bengio et al., 2003; Mikolov et al., 2013a; Pennington et al., 2014; Bojanowski et al., 2017; Joulin et al., 2017), there is now an ever-increasing number of representations for longer units of text based on simple aggregations of word vectors (Mitchell and Lapata, 2008; De Boom et al., 2016; Arora et al., 2017; Wieting et al., 2016; Wieting and Gimpel, 2018; Zhelezniak et al., 2019b) as well as complex neural architectures (Le and Mikolov, 2014; Kiros et al., 2015; Hill et al., 2016; Conneau et al., 2017; Gan et al., 2017; Tang et al., 2017; Pagliardini et al., 2018; Zhelezniak et al., 2018; Subramanian et al., 2018; Cer et al., 2018; Devlin et al., 2018).
By contrast, relatively little effort has been directed towards understanding the similarity measures used to compare these textual embeddings, for which cosine similarity remains a convenient and widespread, yet somewhat arbitrary default, despite some emerging research into the alternatives (Camacho-Collados et al., 2015; De Boom et al., 2015; Santus et al., 2018; Zhelezniak et al., 2019b, a). Part of the appeal of cosine similarity perhaps lies in the simple geometric interpretation behind it. However, as embeddings are ultimately just arrays of numbers, we are free to take alternative viewpoints other than the geometric ones, if they lead to illuminating insights or strong-performing methods.
Following Zhelezniak et al. (2019a), we treat a word embedding not as a geometric vector but as a statistical sample (of e.g. 300 observations) from a scalar random variable, and indeed find insights that are both intriguing and noteworthy. We first illustrate that similarities derived from elementary pooling operations and classic univariate correlation coefficients yield excellent results on standard semantic textual similarity (STS) benchmarks, outperforming many recently proposed methods while being much faster and simpler to implement. This empirically validates the advantages of the statistical perspective on word embeddings over the geometric interpretations. In the process, we provide more evidence that departures from normality, and in particular the presence of outliers, can have severe negative effects on the performance of some correlation coefficients. We show how to overcome these complications, by selecting an outlier-removing pooling operation such as max-pooling, applying a more robust correlation coefficient such as Spearman’s , or simply clipping (winsorizing) the word vectors.
Next, we demonstrate how to avoid pooling operations completely and compare sets of word embeddings directly via correlation operators between reproducing kernel Hilbert spaces (RKHS). We introduce a novel application of the kernel alignment (KA) and the centered kernel alignment (CKA) as a natural generalisation of the squared cosine similarity and Pearson correlation for the sets of word embeddings. These multivariate correlation coefficients are very easy to implement and also enjoy very strong empirical results.
2 Related Work
Several lines of research seek to combine the strength of pretrained word embeddings and the elegance of set- or bag-of-words (BoW) representations. Any method that determines semantic similarity between sentences by comparing the corresponding sets of word embeddings is directly related to our work.
Perhaps the most obvious such approaches are based on elementary pooling operations such as average-, max- and min-pooling (Mitchell and Lapata, 2008; De Boom et al., 2015, 2016). While seemingly over-simplistic, numerous studies have confirmed their impressive performance on the downstream tasks (Arora et al., 2017; Wieting et al., 2016; Wieting and Gimpel, 2018; Zhelezniak et al., 2019b)
One step further, Zhao and Mao (2017); Zhelezniak et al. (2019b) introduce fuzzy bags-of-words (FBoW) where degrees of membership in a fuzzy set are given by the similarities between word embeddings. Zhelezniak et al. (2019b) show a close connection between FBoW and max-pooled word vectors.
Some approaches do not seek to build an explicit representation and instead focus directly on designing a similarity function between sets. Word Mover’s Distance (WMD) (Kusner et al., 2015) is an instance of the Earth Mover’s Distance (EMD) computed between normalised BoW, with the cost matrix given by Euclidean distances between word embeddings. In the soft cardinality framework of (Jimenez et al., 2010, 2015), the contribution of a word to the cardinality of a set depends on its similarities to other words in the same set. Such sets are then compared using an appropriately defined Jaccard index or related measures. DynaMax (Zhelezniak et al., 2019b) uses universe-constrained fuzzy sets designed explicitly for similarity computations.
Approaches that see word embeddings as statistical objects are very closely related to our work. Virtually all of them treat word embeddings as observations from some -variate parametric family, where is the embedding dimension. Arora et al. (2016, 2017) introduce a latent discourse model and show the maximum likelihood estimate (MLE) for the discourse vector to be the weighted average of word embeddings in a sentence, where the weights are given by smooth inverse frequencies (SIF). Nikolentzos et al. (2017); Torki (2018) treat sets of word embeddings as observations from -variate Gaussians, and compare such sets with cosine similarity between the parameters (means and covariances) estimated by maximum likelihood. Vargas et al. (2019) measure semantic similarity through penalised likelihood ratio between the joint and factorised models and explore Gaussian and von Mises–Fisher likelihoods.
Cosine similarity between covariances is an instance of the RV coefficient and its uncentered version was applied in the context of word embeddings before (Botev et al., 2017). We arrive at a similar coefficient (but with different centering) as a special case of CKA, which in the general case makes no parametric assumptions about disbtributions whatsoever. In particular our version is suitable for comparing sets containing just one word vector, whereas the method of Nikolentzos et al. (2017); Torki (2018) requires at least two vectors in each set. Very recently, Kornblith et al. (2019) used CKA to compare representations between layers of the same or different neural networks. This is again an instance of treating such representations as observations from a -variate distribution, where is the dimension of the hidden layer in question. Our use of CKA is completely different from theirs.
Unlike all of the above approaches, (Zhelezniak et al., 2019a) see each word embedding itself as (e.g. 300) observations from some scalar random variable. They cast semantic similarity as correlations between these random variables and study their properties using simple tools from univariate statistics. While they consider correlations between individual word vectors and averaged word vectors, they do not formally explore correlations between word vector sets. We review their framework in Section 3 and then proceed to formalise and generalise it to the case of sets of word embeddings.
3 Background: Correlation Coefficients and Semantic Similarity
Suppose we have a word embeddings matrix , where is the number of words in the vocabulary and is the embedding dimension (usually 300). In other words, each row of is a -dimensional word vector. When applying statistical analysis to these vectors, one might choose to treat each as an observation from some -variate distribution and model it with a Gaussian or a Gaussian Mixture. While such analysis helps in studying the overall geometry of the embedding space (how dimensions correlate and how embeddings cluster), is not directly useful for semantic similarity between individual words.
For the latter, Zhelezniak et al. (2019a) proposed to look at the transpose and the corresponding distribution . Under this perspective, each word vector is now a sample of (e.g. 300) observations from a scalar random variable . Luckily, in applications we are usually not interested in the full joint distribution but only in the similarity between two words, i.e. the bivariate marginal . In practice, we make inferences about this marginal from the paired sample through visualisations (histograms, Q-Q plots, scatter plots, etc.) as well as various statistics.
Zhelezniak et al. (2019a) found that for all common models (GloVe, fastText, word2vec) the means across word embeddings are tightly concentrated around zero (relative to their dimensions), thus making the widely used cosine similarity practically equivalent to Pearson correlation. However, while word2vec vectors seem mostly normal, GloVe and fastText vectors are highly non-normal, likely due to the presence of heavy univariate and bivariate outliers (as suggested by visualisations mentioned earlier). Quantitatively, the majority of GloVe and fastText vectors fail the Shapiro-Wilk normality test at significance level 0.05. Therefore, while Pearson’s (and thus cosine similarity) may be acceptable for word2vec, it is preferable to resort to more robust non-parametic correlation coefficients such as Spearman’s or Kendall’s as a similarity measure between GloVe and fastText vectors.
Finally, very similar conclusions were shown to hold for sentence representations obtained by word vector averaging, also referred to as mean-pooling. In particular, averaged fastText vectors compared with rank correlation coefficients already show impressive results on standard STS tasks, rivaling much more sophisticated systems.
4 Correlations between Word Vector Sets
We are interested in applying the statistical framework from Section 3 to measure the semantic similarity between two sentences and given by the sets (or bags) and of word embeddings respectively. To formalise this new setup, we may see each set of word embeddings as a sample (of e.g. 300 observations) from some theoretical set of scalar random variables . In light of the above, our task then lies in finding correlation coefficients between and and their empirical estimates obtained from the paired sample , hoping that such coefficients will serve as a good proxy for semantic similarity. Recall that for single-word sets the task simply reduces to computing a univariate correlation between word vectors and , where the choice of the coefficient (Pearson’s , Spearman’s , etc.) is made based on the statistics exhibited by the word embeddings matrix. While generalising this to sets of more than one variable is not particularly hard, there are several ways to do so, each with its own advantages and downsides. In the present work, we group these approaches into two broad families: pooling-based and pooling-free correlation coefficients.
4.1 Correlations between Pooled Variables
Pooling-based approaches first reduce a set of random variables to a single scalar random variable and then apply univariate correlation coefficients between the pooled variables. In practice this would correspond to pooling word embeddings (along ) into one fixed vector , followed by computing univariate sample correlations. Certainly, these approaches are empirically attractive: not only are they very simple computationally (e.g. see Algorithm 1) but they also keep us in the realm of univariate statisics, where we have an entire arsenal of effective tools for making inferences about .
Unfortunately, it is not always clear a priori what should dictate our choice of the pooling function (though, as we will see shortly, for certain functions some statistical justifications do exist). By far the most common pooling operations for word embedding found in the literature are mean-, max- and min-pooling. It is also very common, with some exceptions, to treat these various pooled representation in a completely identical fashion, e.g. by comparing them all with cosine similarity. Intuitively, however, we suggest that the statistics of must heavily depend on the pooling function and thus each such pooled random variable should be studied in its own right. To illustrate this point, we would like to reveal the very different nature of mean- and max- and min-pooled sentence vectors though a practical example.
4.2 Statistics of the Pooled Representations: A Practical Analysis
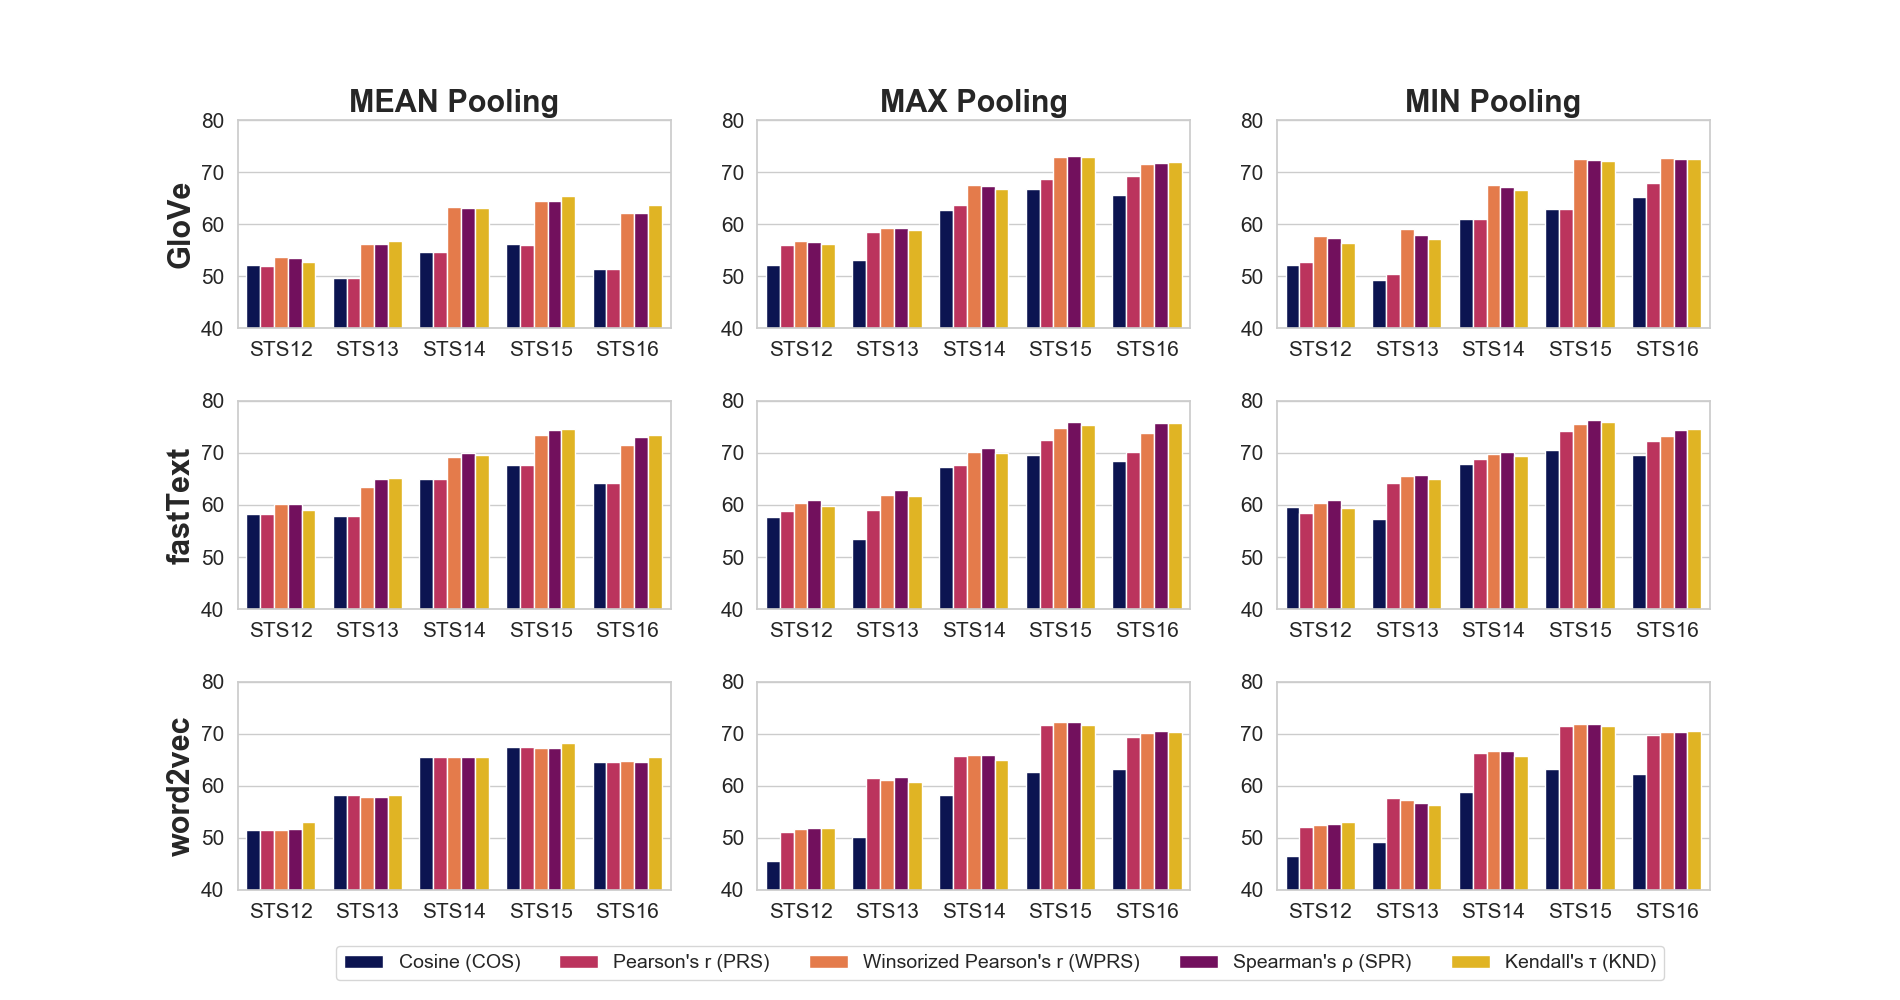
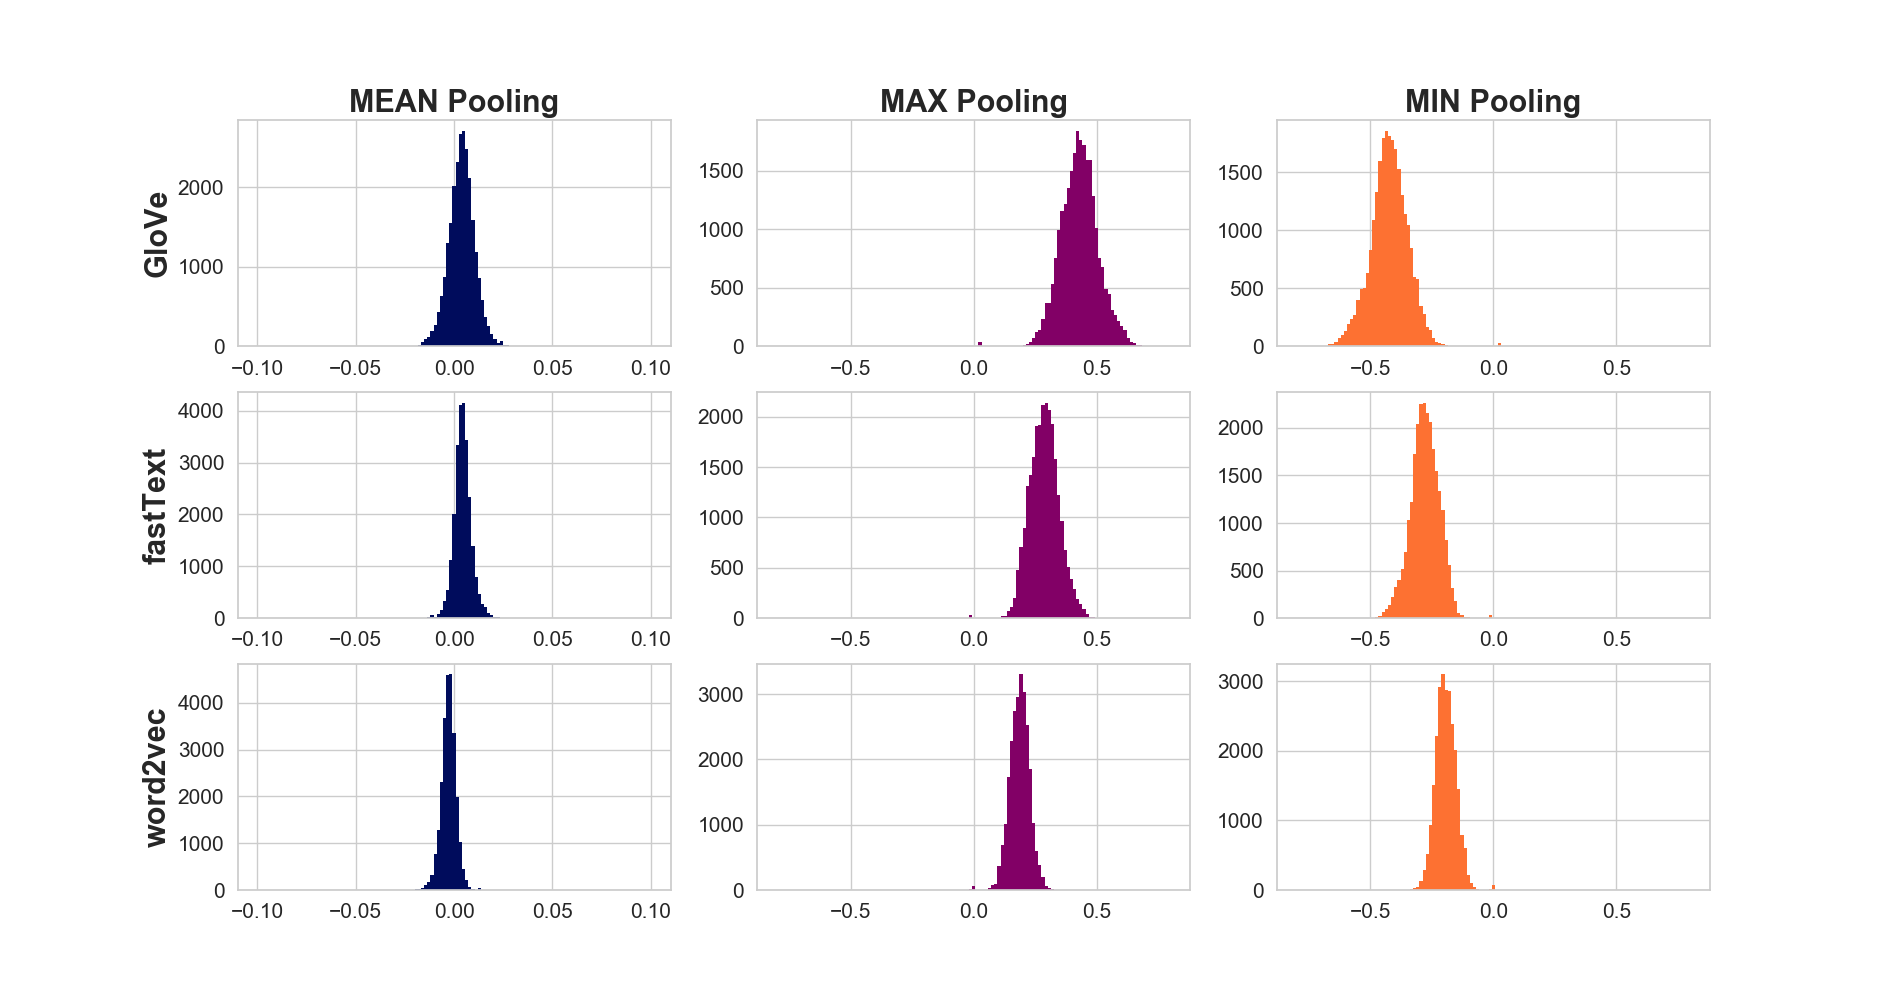
Let us begin by examining sentence vectors obtained through mean-pooling. Recall that for common word embedding models, the mean across 300 dimensions of a single word embedding happens to be close to zero (relative to the dimensions). By the linearity of expectation, we have that , and so the mean across will also be close to zero at least for small . In practice, this seems to hold even for moderate in naturally occurring sentences, as seen in Figure 1. Based on this, we expect Pearson correlation and cosine similarity to have almost identical performance on the downstream tasks, which is confirmed in Figure 2.
On the other hand, intuition tells us that the means of the max-pooled vectors will be shifted to the right because of the max operation, which we see in Figure 1. In this case, cosine similarity and Pearson correlation will yield different results and, in fact, Pearson’s considerably outperforms cosine on the downstream tasks (Figure 2). This in turn empirically adds weight to the statistical interpretation (correlation) over its geometrical counterpart (angle between vectors).
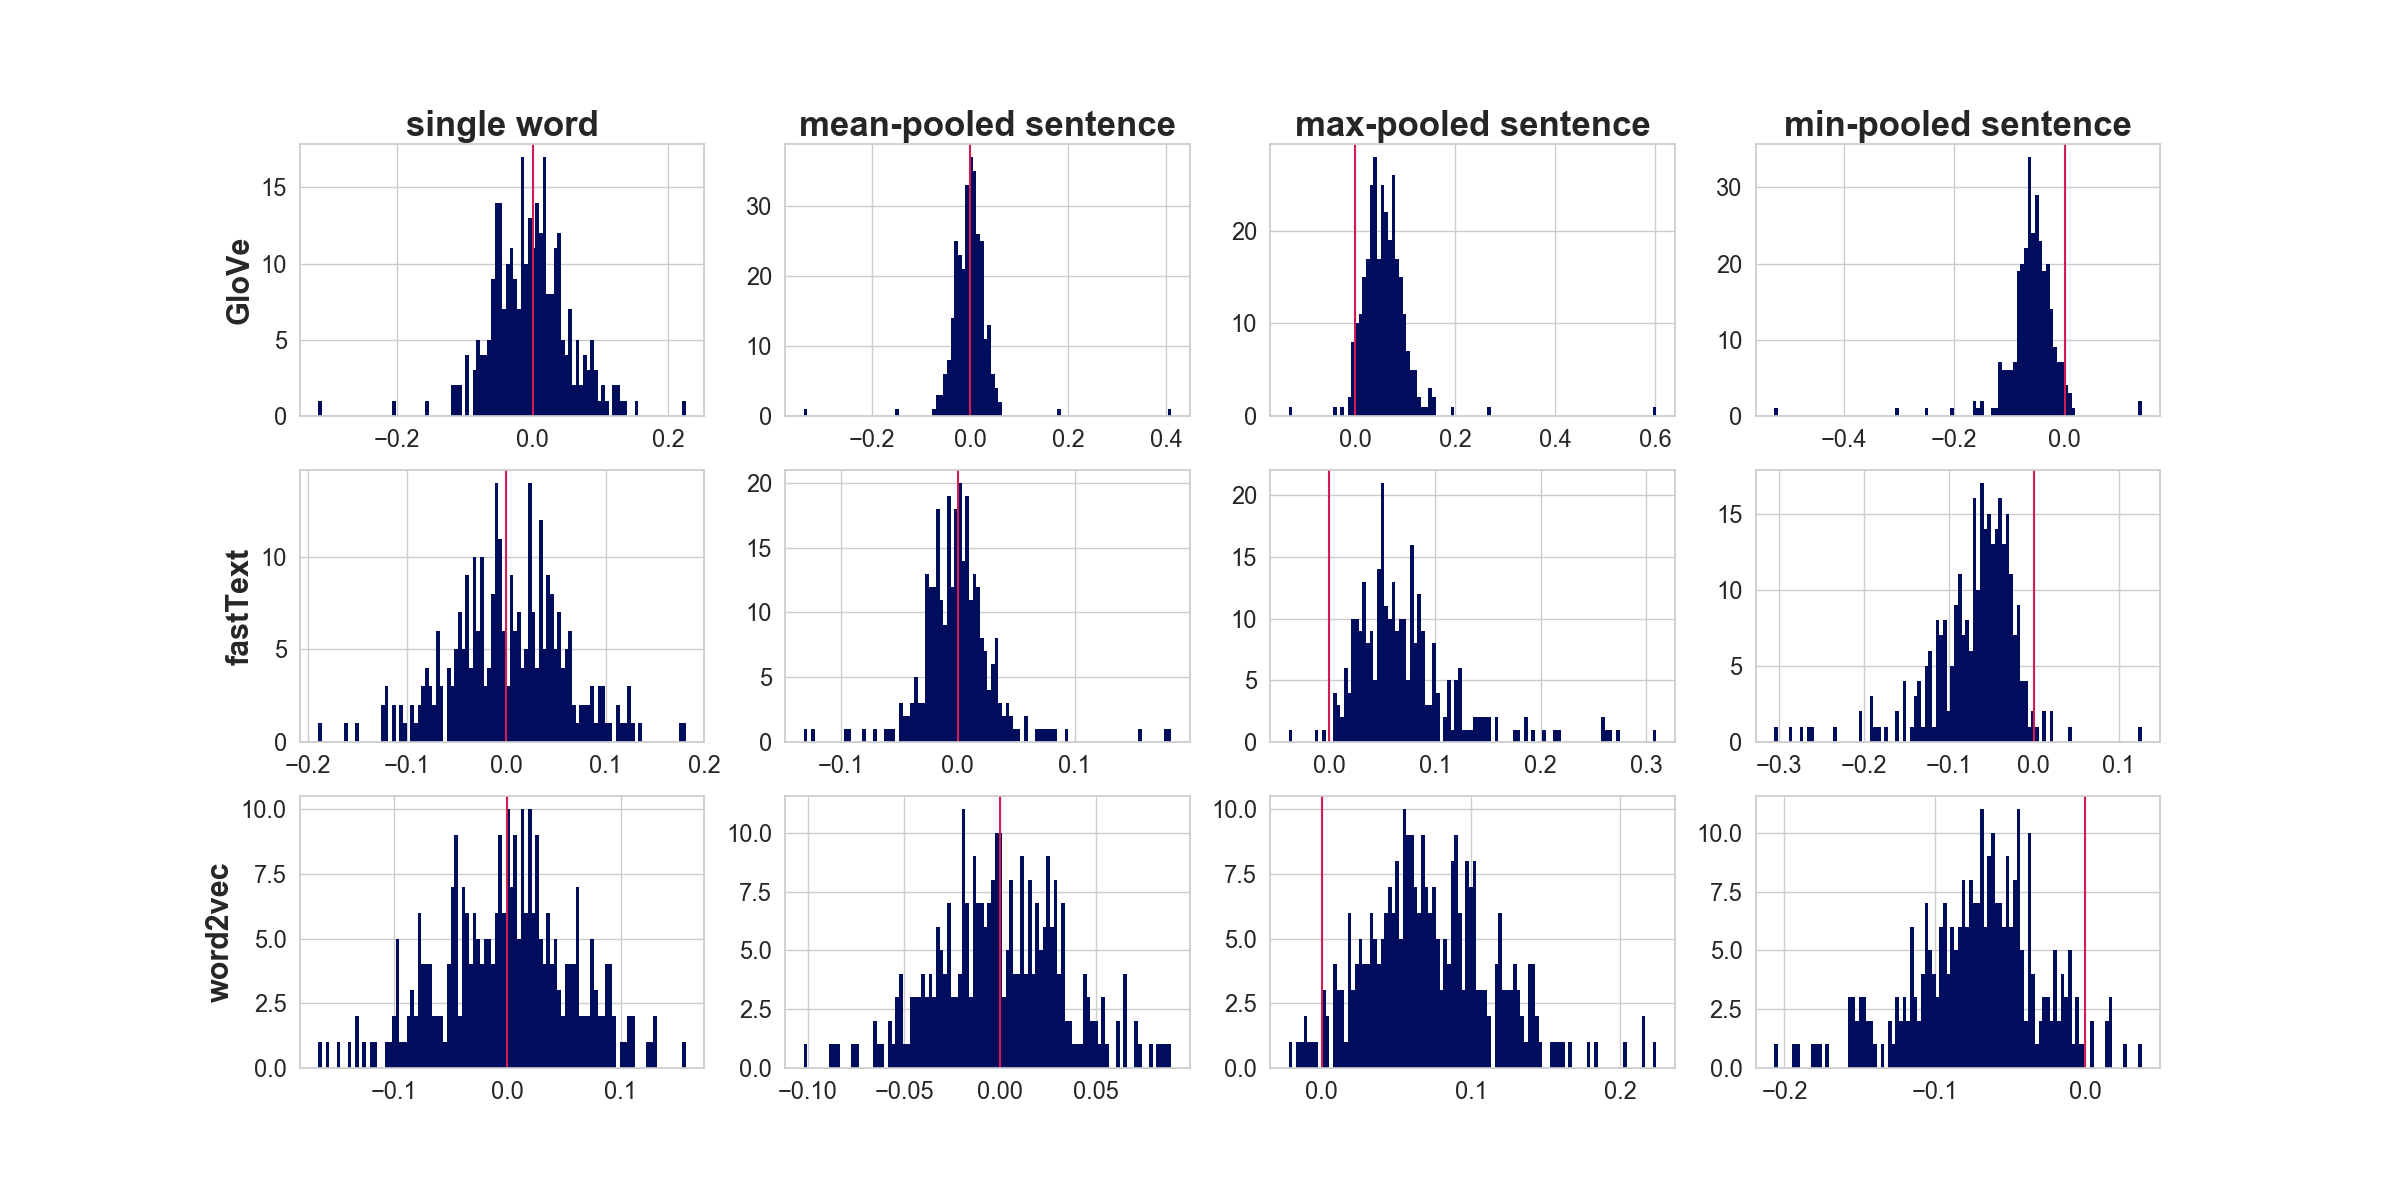
Recall also that unlike word2vec, GloVe and fastText vectors feature heavy univariate outliers, and the same can be expected to hold for the pooled representations; an example is shown in Figure 3. In case of mean-pooled vectors, this particular departure from normality can be successfully detected by the Shapiro-Wilk normality test, informing the appropriate choice of the correlation coefficient (Pearson’s or robust rank correlation). By contrast, such procedure cannot be readily applied to max-pooled and min-pooled vectors as by construction they exhibit additional departures from normality, such as positive and negative skew respectively. It is always a good idea to consult visualisations for such vectors, such as the ones in Figure 3. Interestingly though, we do observe the some noteworthy regularities, which we describe further in Section 5.
The above example is meant to illustrate that even the simplest pooled random variables show strikingly different statistics depending on the aggregation. While the abundance of various pooling operations may be intimidating, the resulting vectors are always subject to the many tools of univariate statistics. As we hope to have shown, even crude analysis can shed light on the nature of these textual representations, which in turn has notable practical implications, as we will see in Section 5.
4.3 Correlations between Random Vectors
Exactly as before, suppose we have two sentences and and the corresponding random vectors and . At this point it is important to emphasise again that we relate each word vector to a random variable and treat the dimensions of as observations from that variable, and similarly for and . In contrast with the pooling-based approaches, our task here is to find a suitable correlation coefficient directly between the random vectors and . We begin by recalling the expression for the basic univariate Pearson’s :
| (1) |
where
and similarly for and . The covariance term in the numerator is readily generalised to random vectors by the following cross-covariance operator between reproducing kernel Hilbert spaces (RKHS) and
| (2) |
where denotes the tensor product and , . Here and are the feature maps such that and , where and are the kernels associated with RKHS and respectively. Note that if and are the identity maps, the cross-covariance operator (2) simply becomes the cross-covariance matrix
Gretton et al. (2005a) define the Hilbert-Schmidt independence criterion (HSIC) to be the squared Hilbert-Schmidt norm of (2) and derive an expression for it in terms of kernels and
They also show the empirical estimate of it to be
| (3) |
where is the centering matrix and are the kernel (Gram) matrices of observations. Crucially, the kernel evaluations for take place between and and not between the individual word embeddings and , and similarly for . Thus, both and are square matrices of dimension . Indeed, for (3) to make sense, the dimensions of and must match. The matching dimension in our case is the word embedding dimension , while the number of words and in the sentences may vary. This is in line with our formalism, which models word vectors as random variables and their dimensions as observations.
Finally, the Centered Kernel Alignment (CKA) (Cortes et al., 2012) is simply defined as
| (4) |
We see now that CKA not only generalises the squared Pearson correlation to the multivariate case, it also allows it to operate in high-dimensional feature spaces, as commonly done in the kernel literature. The reason this is useful is that under certain conditions (when and are characteristic kernels), HSIC can detect any existing dependence with high probability, as the sample size increases (Gretton et al., 2005b). One can also consider the Uncentered Kernel Alignment (or simply KA) (Cristianini et al., 2002), which can then be seen as a similar generalisation but for the univariate cosine similarity. To the best of our knowledge, KA and CKA in general have never been applied before to measure semantic similarity between sets of word embeddings; therefore this work seeks to introduce them as standard definitions for squared Pearson’s and cosine similarity for such sets.
| Approach STS | 12 | 13 | 14 | 15 | 16 |
|---|---|---|---|---|---|
| Deep Learning Approaches | |||||
| ELMo (BoW) | 55 | 53 | 63 | 68 | 60 |
| Skip-Thought | 41 | 29 | 40 | 46 | 52 |
| InferSent | 61 | 56 | 68 | 71 | 71 |
| USE (DAN) | 59 | 59 | 68 | 72 | 70 |
| USE (Transformer) | 61 | 64 | 71 | 74 | 74 |
| STN (multitask) | 60.6 | 54.7† | 65.8 | 74.2 | 66.4 |
| BERT-Base | 46.9 | 52.8 | 57.2 | 63.5 | 64.5 |
| BERT-Large | 42.6 | 47.4 | 49.3 | 55.6 | 60.4 |
| Set-based Approaches | |||||
| WMD | 53.0 | 45.9 | 57.2 | 66.9 | 63.1 |
| SoftCardinality | 55.9 | 50.5 | 59.0 | 66.2 | 65.1 |
| DynaMax | 60.9 | 60.3 | 69.5 | 76.7 | 74.6 |
| SIF+PCA | 58.6 | 67.3 | 70.5 | 73.5 | 71.7 |
| MeanPool+COS | 58.3 | 57.9 | 64.9 | 67.6 | 64.3 |
| MaxPool+COS | 57.7 | 53.5 | 67.2 | 69.5 | 68.5 |
| MeanPool+SPR | 60.2 | 65.1 | 70.1 | 74.4 | 73.0 |
| MaxPool+SPR⚒ | 61.0 | 62.9 | 70.9 | 75.9 | 75.8 |
| CKA Linear⚒ | 59.8 | 62.1 | 69.5 | 74.6 | 70.3 |
| CKA Gaussian⚒ | 60.5 | 63.8 | 71.6 | 76.3 | 73.7 |
| CKA dCor⚒ | 61.0 | 63.2 | 71.5 | 75.6 | 72.4 |
5 Experiments
We now empirically demonstrate the power of the methods and statistical analysis presented in Section 4, through a set of evaluations on the Semantic Textual Similarity (STS) tasks series 2012-2016 (Agirre et al., 2012, 2013, 2014, 2015, 2016; Cer et al., 2017). For methods involving pretrained word embeddings, we use fastText (Bojanowski et al., 2017) trained on Common Crawl (600B tokens), as previous evaluations have indicated that fastText vectors have uniformly the best performance on these tasks out of commonly-used pretrained unsupervised word vectors (Conneau et al., 2017; Perone et al., 2018; Zhelezniak et al., 2019a, b). We provide experiments and significance analysis for additional word vector in the Appendix. The success metric for the STS tasks is the Pearson correlation between the sentence similarity scores provided by human annotators and the scores generated by a candidate algorithm. Note that the dataset for the STS13 SMT subtask is no longer publicly available, so the mean Pearson correlation for STS13 reported in our experiments has been re-calculated accordingly. The code for our experiments builds on the SentEval toolkit (Conneau and Kiela, 2018) and is available on GitHub111https://github.com/Babylonpartners/corrsim.
We first conduct a set of experiments to validate the observations of Sections 4.2 and 4.1 regarding the performance of cosine similarity and various univariate correlation coefficients when applied to pooled word vectors. These results are depicted in Figure 2, for which we can make the following observations.
First, max and min-pooled vectors consistently outperform mean-pooled vectors when all three representations are compared with Pearson correlation. We hypothesise that this is in part because max and min-pooling remove the outliers (to which Pearson’s is very sensitive) from at least one tail of the distribution whereas mean-pooled vectors have outliers in both tails. This outlier-removing property, however, cannot be taken as a sole explanation behind excellent performance of max-pooled vectors, as max-pooling still tends to outperform mean-pooling when both are compared with correlations that are robust to outliers, as well as on word vectors that have very few outliers to begin with (e.g. word2vec).
In addition, the strong performance of rank correlation coefficients (Spearman’s and Kendall’s ) comes solely from their robustness to outliers, as clipping (winsorizing) the top and bottom 5% of the values and then proceeding with Pearson’s closes the gap almost completely. Consistently, on vectors with few outliers (word2vec), Pearson’s achieves the same performance as rank correlations even without winsorization. However, unlike outliers, positive (negative) skew of max- (min-) pooled vectors does not seem to hurt Pearson’s on STS tasks.
Next, we conduct evaluations of the methods proposed in this work alongside other deep learning and set-based similarity measures for STS from the literature. The methods we compare are as follows:
-
•
Deep representation approaches: BoW with ELMo embeddings (Peters et al., 2018), Skip-Thought (Kiros et al., 2015), InferSent (Conneau et al., 2017), Universal Sentence Encoder both DAN and Transformer (Cer et al., 2018), STN multitask embeddings (Subramanian et al., 2018), and BERT 12- and 24-layer models (Devlin et al., 2018).
-
•
Set-based similarity measures: Word Mover’s Distance (WMD) (Kusner et al., 2015), soft-cardinality with Jaccard coefficient (Jimenez et al., 2012), DynaMax with Jaccard (Zhelezniak et al., 2019b), mean- and max-pooled word vectors with cosine similarity (COS), and mean-pooled word vectors with Spearman correlation (SPR) (Zhelezniak et al., 2019a).
-
•
Proposed set-based approaches: max-pooled word vectors with Spearman correlation, CKA with linear kernel (also known as RV-coefficient), CKA with Gaussian kernel (median estimation for ), and CKA with distance kernel (distance correlation).
Note that for BERT we evaluated all pooling strategies available in bert-as-service (Xiao, 2018) applied to either the last or second-to-last layers and report results for the best-performing combination, which was mean-pooling on the last layer for both model sizes.
| Approach | Time complexity |
|---|---|
| MaxPool+SPR | |
| CKA | |
| DynaMax | |
| SoftCard | |
| WMD | |
| WMD (relaxed) |
Our results are presented in Table 1. We can clearly see that deep learning-based methods do not shine on STS tasks, while simple compositions of word vectors can perform extremely well, especially when an appropriate correlation coefficient is used as the similarity measure. Indeed, the performance of max-pooled vectors with Spearman correlation approaches or exceeds that of more expensive or offline methods like that of Arora et al. (2017), which performs PCA computations on the entire test set. Additionally, while the multivariate correlation methods such as CKA are more computationally expensive than pooling-based approaches (see Table 2), they can provide performance boost on some tasks, making the cost worth it depending on the application. Finally, we conducted an exploratory error analysis and found that many errors are due to the well-known inherent weaknesses of word embeddings. For example, the proposed approaches heavily overestimate similarity when two sentences contain antonyms or when one sentence is the negation of the other. We illustrate these and other cases in the Appendix.
6 Conclusion
In this work we investigate the application of statistical correlation coefficients to sets of word vectors as a method for computing semantic textual similarity (STS). This can be done either by pooling these word vectors and computing univariate correlations between the resulting representations, or by applying multivariate correlation coefficients to the sets of vectors directly.
We provide further empirical evidence that outliers in word vector distributions disrupt performance of set-based similarity metrics as previously shown Zhelezniak et al. (2019a). We also show working methods for solving or avoiding the issue through vector pooling operations, robust correlations or winsorization. In addition, we found that pooling operations in conjunction with univariate correlation coefficients yield one of the strongest results on downstream STS tasks, while being computationally much more efficient than competing set-based methods. Our findings are supported by a combination of statistical analysis, practical examples and visualisations, and empirical evaluation on standard benchmark datasets.
Both proposed families of approaches serve as strong baselines for future research into STS, as well as useful algorithms for the practitioner, being efficient and simple to implement.
We believe our findings speak to the efficacy of the statistical perspective on word embeddings, which we hope will encourage others to explore further implications of not only this particular framework, but also completely novel interpretations of textual representations.
Acknowledgements
We would like to thank the three anonymous reviewers for their useful feedback and suggestions.
References
- Agirre et al. (2015) Eneko Agirre, Carmen Banea, Claire Cardie, Daniel Cer, Mona Diab, Aitor Gonzalez-Agirre, Weiwei Guo, Inigo Lopez-Gazpio, Montse Maritxalar, Rada Mihalcea, German Rigau, Larraitz Uria, and Janyce Wiebe. 2015. Semeval-2015 task 2: Semantic textual similarity, english, spanish and pilot on interpretability. In Proceedings of the 9th International Workshop on Semantic Evaluation (SemEval 2015), pages 252–263. Association for Computational Linguistics.
- Agirre et al. (2014) Eneko Agirre, Carmen Banea, Claire Cardie, Daniel Cer, Mona Diab, Aitor Gonzalez-Agirre, Weiwei Guo, Rada Mihalcea, German Rigau, and Janyce Wiebe. 2014. Semeval-2014 task 10: Multilingual semantic textual similarity. In Proceedings of the 8th International Workshop on Semantic Evaluation (SemEval 2014), pages 81–91. Association for Computational Linguistics.
- Agirre et al. (2016) Eneko Agirre, Carmen Banea, Daniel Cer, Mona Diab, Aitor Gonzalez-Agirre, Rada Mihalcea, German Rigau, and Janyce Wiebe. 2016. Semeval-2016 task 1: Semantic textual similarity, monolingual and cross-lingual evaluation. In Proceedings of the 10th International Workshop on Semantic Evaluation (SemEval-2016), pages 497–511. Association for Computational Linguistics.
- Agirre et al. (2012) Eneko Agirre, Daniel Cer, Mona Diab, and Aitor Gonzalez-Agirre. 2012. Semeval-2012 task 6: A pilot on semantic textual similarity. In *SEM 2012: The First Joint Conference on Lexical and Computational Semantics – Volume 1: Proceedings of the main conference and the shared task, and Volume 2: Proceedings of the Sixth International Workshop on Semantic Evaluation (SemEval 2012), pages 385–393. Association for Computational Linguistics.
- Agirre et al. (2013) Eneko Agirre, Daniel Cer, Mona Diab, Aitor Gonzalez-Agirre, and Weiwei Guo. 2013. *sem 2013 shared task: Semantic textual similarity. In Second Joint Conference on Lexical and Computational Semantics (*SEM), Volume 1: Proceedings of the Main Conference and the Shared Task: Semantic Textual Similarity, pages 32–43. Association for Computational Linguistics.
- Arora et al. (2016) Sanjeev Arora, Yuanzhi Li, Yingyu Liang, Tengyu Ma, and Andrej Risteski. 2016. A latent variable model approach to pmi-based word embeddings. Transactions of the Association for Computational Linguistics, 4:385–399.
- Arora et al. (2017) Sanjeev Arora, Yingyu Liang, and Tengyu Ma. 2017. A Simple but Tough-to-Beat Baseline for Sentence Embeddings. International Conference on Learning Representations.
- Bengio et al. (2003) Yoshua Bengio, Réjean Ducharme, Pascal Vincent, and Christian Jauvin. 2003. A neural probabilistic language model. Journal of Machine Learning Research, 3:1137–1155.
- Bojanowski et al. (2017) Piotr Bojanowski, Edouard Grave, Armand Joulin, and Tomas Mikolov. 2017. Enriching word vectors with subword information. Transactions of the Association for Computational Linguistics, 5:135–146.
- Botev et al. (2017) Viktor Botev, Kaloyan Marinov, and Florian Schäfer. 2017. Word importance-based similarity of documents metric (wisdm): Fast and scalable document similarity metric for analysis of scientific documents. In Proceedings of the 6th International Workshop on Mining Scientific Publications, WOSP 2017, pages 17–23, New York, NY, USA. ACM.
- Camacho-Collados et al. (2015) José Camacho-Collados, Mohammad Taher Pilehvar, and Roberto Navigli. 2015. Nasari: a novel approach to a semantically-aware representation of items. In Proceedings of the 2015 Conference of the North American Chapter of the Association for Computational Linguistics: Human Language Technologies, pages 567–577. Association for Computational Linguistics.
- Cer et al. (2017) Daniel Cer, Mona Diab, Eneko Agirre, Inigo Lopez-Gazpio, and Lucia Specia. 2017. Semeval-2017 task 1: Semantic textual similarity multilingual and crosslingual focused evaluation. In Proceedings of the 11th International Workshop on Semantic Evaluation (SemEval-2017), pages 1–14. Association for Computational Linguistics.
- Cer et al. (2018) Daniel Cer, Yinfei Yang, Sheng-yi Kong, Nan Hua, Nicole Limtiaco, Rhomni St. John, Noah Constant, Mario Guajardo-Cespedes, Steve Yuan, Chris Tar, Brian Strope, and Ray Kurzweil. 2018. Universal sentence encoder for english. In Proceedings of the 2018 Conference on Empirical Methods in Natural Language Processing: System Demonstrations, pages 169–174. Association for Computational Linguistics.
- Conneau and Kiela (2018) Alexis Conneau and Douwe Kiela. 2018. Senteval: An evaluation toolkit for universal sentence representations. In Proceedings of the Eleventh International Conference on Language Resources and Evaluation (LREC-2018). European Language Resource Association.
- Conneau et al. (2017) Alexis Conneau, Douwe Kiela, Holger Schwenk, Loïc Barrault, and Antoine Bordes. 2017. Supervised learning of universal sentence representations from natural language inference data. In Proceedings of the 2017 Conference on Empirical Methods in Natural Language Processing, pages 670–680. Association for Computational Linguistics.
- Cortes et al. (2012) Corinna Cortes, Mehryar Mohri, and Afshin Rostamizadeh. 2012. Algorithms for learning kernels based on centered alignment. Journal of Machine Learning Research, 13(Mar):795–828.
- Cristianini et al. (2002) Nello Cristianini, John Shawe-Taylor, Andre Elisseeff, and Jaz S Kandola. 2002. On kernel-target alignment. In Advances in neural information processing systems, pages 367–373.
- De Boom et al. (2015) C. De Boom, S. Van Canneyt, S. Bohez, T. Demeester, and B. Dhoedt. 2015. Learning semantic similarity for very short texts. In 2015 IEEE International Conference on Data Mining Workshop (ICDMW), pages 1229–1234.
- De Boom et al. (2016) Cedric De Boom, Steven Van Canneyt, Thomas Demeester, and Bart Dhoedt. 2016. Representation learning for very short texts using weighted word embedding aggregation. Pattern Recogn. Lett., 80(C):150–156.
- Devlin et al. (2018) Jacob Devlin, Ming-Wei Chang, Kenton Lee, and Kristina Toutanova. 2018. Bert: Pre-training of deep bidirectional transformers for language understanding. arXiv preprint arXiv:1810.04805.
- Efron (1987) Bradley Efron. 1987. Better bootstrap confidence intervals. Journal of the American Statistical Association, 82(397):171–185.
- Gan et al. (2017) Zhe Gan, Yunchen Pu, Ricardo Henao, Chunyuan Li, Xiaodong He, and Lawrence Carin. 2017. Learning generic sentence representations using convolutional neural networks. In Proceedings of the 2017 Conference on Empirical Methods in Natural Language Processing, pages 2390–2400. Association for Computational Linguistics.
- Gretton et al. (2005a) Arthur Gretton, Olivier Bousquet, Alex Smola, and Bernhard Schölkopf. 2005a. Measuring statistical dependence with hilbert-schmidt norms. In International conference on algorithmic learning theory, pages 63–77. Springer.
- Gretton et al. (2005b) Arthur Gretton, Ralf Herbrich, Alexander Smola, Olivier Bousquet, and Bernhard Schölkopf. 2005b. Kernel methods for measuring independence. Journal of Machine Learning Research, 6(Dec):2075–2129.
- Hill et al. (2016) Felix Hill, Kyunghyun Cho, and Anna Korhonen. 2016. Learning distributed representations of sentences from unlabelled data. In Proceedings of the 2016 Conference of the North American Chapter of the Association for Computational Linguistics: Human Language Technologies, pages 1367–1377. Association for Computational Linguistics.
- Hill et al. (2015) Felix Hill, Roi Reichart, and Anna Korhonen. 2015. Simlex-999: Evaluating semantic models with (genuine) similarity estimation. Computational Linguistics, 41(4):665–695.
- Jimenez et al. (2012) Sergio Jimenez, Claudia Becerra, and Alexander Gelbukh. 2012. Soft cardinality: A parameterized similarity function for text comparison. In Proceedings of the First Joint Conference on Lexical and Computational Semantics - Volume 1: Proceedings of the Main Conference and the Shared Task, and Volume 2: Proceedings of the Sixth International Workshop on Semantic Evaluation, SemEval ’12, pages 449–453, Stroudsburg, PA, USA. Association for Computational Linguistics.
- Jimenez et al. (2010) Sergio Jimenez, Fabio Gonzalez, and Alexander Gelbukh. 2010. Text comparison using soft cardinality. In String Processing and Information Retrieval, pages 297–302, Berlin, Heidelberg. Springer Berlin Heidelberg.
- Jimenez et al. (2015) Sergio Jimenez, Fabio A. Gonzalez, and Alexander Gelbukh. 2015. Soft cardinality in semantic text processing: Experience of the SemEval international competitions. Polibits, 51:63–72.
- Joulin et al. (2017) Armand Joulin, Edouard Grave, Piotr Bojanowski, and Tomas Mikolov. 2017. Bag of tricks for efficient text classification. In Proceedings of the 15th Conference of the European Chapter of the Association for Computational Linguistics: Volume 2, Short Papers, pages 427–431. Association for Computational Linguistics.
- Kiros et al. (2015) Ryan Kiros, Yukun Zhu, Ruslan R Salakhutdinov, Richard Zemel, Raquel Urtasun, Antonio Torralba, and Sanja Fidler. 2015. Skip-Thought Vectors. In Advances in Neural Information Processing Systems, pages 3294–3302.
- Kornblith et al. (2019) Simon Kornblith, Mohammad Norouzi, Honglak Lee, and Geoffrey Hinton. 2019. Similarity of neural network representations revisited. In ICML.
- Kusner et al. (2015) Matt J. Kusner, Yu Sun, Nicholas I. Kolkin, and Kilian Q. Weinberger. 2015. From word embeddings to document distances. In Proceedings of the 32Nd International Conference on International Conference on Machine Learning, volume 37 of ICML’15, pages 957–966. JMLR.org.
- Le and Mikolov (2014) Quoc Le and Tomas Mikolov. 2014. Distributed Representations of Sentences and Documents. In International Conference on Machine Learning, pages 1188–1196.
- Mikolov et al. (2013a) Tomas Mikolov, Kai Chen, Greg Corrado, and Jeffrey Dean. 2013a. Efficient Estimation of Word Representations in Vector Space. arXiv preprint arXiv:1301.3781.
- Mikolov et al. (2013b) Tomas Mikolov, Ilya Sutskever, Kai Chen, Greg S Corrado, and Jeff Dean. 2013b. Distributed representations of words and phrases and their compositionality. In Advances in Neural Information Processing Systems, pages 3111–3119.
- Mikolov et al. (2013c) Tomas Mikolov, Wen-tau Yih, and Geoffrey Zweig. 2013c. Linguistic Regularities in Continuous Space Word Representations. In Proceedings of the 2013 Conference of the North American Chapter of the Association for Computational Linguistics: Human Language Technologies, pages 746–751.
- Mitchell and Lapata (2008) Jeff Mitchell and Mirella Lapata. 2008. Vector-based models of semantic composition. In Proceedings of ACL-08: HLT, pages 236–244. Association for Computational Linguistics.
- Mohammad et al. (2008) Saif Mohammad, Bonnie Dorr, and Graeme Hirst. 2008. Computing word-pair antonymy. In Proceedings of the 2008 Conference on Empirical Methods in Natural Language Processing, pages 982–991, Honolulu, Hawaii. Association for Computational Linguistics.
- Mrkšić et al. (2016) Nikola Mrkšić, Diarmuid Ó Séaghdha, Blaise Thomson, Milica Gašić, Lina M. Rojas-Barahona, Pei-Hao Su, David Vandyke, Tsung-Hsien Wen, and Steve Young. 2016. Counter-fitting word vectors to linguistic constraints. In Proceedings of the 2016 Conference of the North American Chapter of the Association for Computational Linguistics: Human Language Technologies, pages 142–148, San Diego, California. Association for Computational Linguistics.
- Nikolentzos et al. (2017) Giannis Nikolentzos, Polykarpos Meladianos, Francois Rousseau, Yannis Stavrakas, and Michalis Vazirgiannis. 2017. Multivariate Gaussian document representation from word embeddings for text categorization. In Proceedings of the 15th Conference of the European Chapter of the Association for Computational Linguistics: Volume 2, Short Papers, pages 450–455, Valencia, Spain. Association for Computational Linguistics.
- Pagliardini et al. (2018) Matteo Pagliardini, Prakhar Gupta, and Martin Jaggi. 2018. Unsupervised learning of sentence embeddings using compositional n-gram features. In Proceedings of the 2018 Conference of the North American Chapter of the Association for Computational Linguistics: Human Language Technologies, Volume 1 (Long Papers), pages 528–540. Association for Computational Linguistics.
- Pennington et al. (2014) Jeffrey Pennington, Richard Socher, and Christopher Manning. 2014. Glove: Global vectors for word representation. In Proceedings of the 2014 Conference on Empirical Methods in Natural Language Processing (EMNLP), pages 1532–1543. Association for Computational Linguistics.
- Perone et al. (2018) Christian S Perone, Roberto Silveira, and Thomas S Paula. 2018. Evaluation of sentence embeddings in downstream and linguistic probing tasks. arXiv preprint arXiv:1806.06259.
- Peters et al. (2018) Matthew Peters, Mark Neumann, Mohit Iyyer, Matt Gardner, Christopher Clark, Kenton Lee, and Luke Zettlemoyer. 2018. Deep contextualized word representations. In Proceedings of the 2018 Conference of the North American Chapter of the Association for Computational Linguistics: Human Language Technologies, Volume 1 (Long Papers), pages 2227–2237. Association for Computational Linguistics.
- Santus et al. (2018) Enrico Santus, Hongmin Wang, Emmanuele Chersoni, and Yue Zhang. 2018. A rank-based similarity metric for word embeddings. In Proceedings of the 56th Annual Meeting of the Association for Computational Linguistics (Volume 2: Short Papers), pages 552–557. Association for Computational Linguistics.
- Subramanian et al. (2018) Sandeep Subramanian, Adam Trischler, Yoshua Bengio, and Christopher J Pal. 2018. Learning general purpose distributed sentence representations via large scale multi-task learning. In International Conference on Learning Representations.
- Tang et al. (2017) Shuai Tang, Hailin Jin, Chen Fang, Zhaowen Wang, and Virginia R. de Sa. 2017. Exploring asymmetric encoder-decoder structure for context-based sentence representation learning. CoRR, abs/1710.10380.
- Torki (2018) Marwan Torki. 2018. A document descriptor using covariance of word vectors. In Proceedings of the 56th Annual Meeting of the Association for Computational Linguistics (Volume 2: Short Papers), pages 527–532, Melbourne, Australia. Association for Computational Linguistics.
- Vargas et al. (2019) Francisco Vargas, Kamen Brestnichki, and Nils Hammerla. 2019. Model comparison for semantic grouping. In ICML.
- Wieting et al. (2016) John Wieting, Mohit Bansal, Kevin Gimpel, and Karen Livescu. 2016. Towards Universal Paraphrastic Sentence Embeddings. In International Conference on Learning Representations.
- Wieting and Gimpel (2018) John Wieting and Kevin Gimpel. 2018. Paranmt-50m: Pushing the limits of paraphrastic sentence embeddings with millions of machine translations. In Proceedings of the 56th Annual Meeting of the Association for Computational Linguistics (Volume 1: Long Papers), pages 451–462. Association for Computational Linguistics.
- Xiao (2018) Han Xiao. 2018. bert-as-service. https://github.com/hanxiao/bert-as-service.
- Zhao and Mao (2017) Rui Zhao and Kezhi Mao. 2017. Fuzzy bag-of-words model for document representation. IEEE Transactions on Fuzzy Systems, pages 1–1.
- Zhelezniak et al. (2018) Vitalii Zhelezniak, Dan Busbridge, April Shen, Samuel L. Smith, and Nils Y. Hammerla. 2018. Decoding Decoders: Finding Optimal Representation Spaces for Unsupervised Similarity Tasks. CoRR, abs/1805.03435.
- Zhelezniak et al. (2019a) Vitalii Zhelezniak, Aleksandar Savkov, April Shen, and Nils Y. Hammerla. 2019a. Correlation coefficients and semantic textual similarity. In NAACL-HLT.
- Zhelezniak et al. (2019b) Vitalii Zhelezniak, Aleksandar Savkov, April Shen, Francesco Moramarco, Jack Flann, and Nils Y. Hammerla. 2019b. Don’t settle for average, go for the max: Fuzzy sets and max-pooled word vectors. In International Conference on Learning Representations.
Appendix
Appendix A Error Analysis
While the proposed approaches enjoy strong performance on the STS benchmarks relative to the competing methods, the Pearson correlations between gold and system scores remain consistently below 0.9 in all subtasks. It would be extremely useful to establish which similarities are not captured very well by these approaches, at least as judged by humans on the 0 to 5 scale established in (Agirre et al., 2012). For concreteness, we limit our exposition to MaxPool Spearman, noting that similar conclusions hold for CKA-based methods too.
First, we linearly transform the system scores into the range , thus making them comparable to gold scores while preserving Pearson correlation. Then, in each subtask we select 5 sentence pairs with the largest absolute difference between the gold and the system score. After that, we manually examine the obtained dataset, focusing predominantly on shorter sentences, where the errors are often obvious and easy to explain. Even under these restrictions, we can readily distinguish between 5 different types of errors, summarised in Table 3. On the one hand, the system heavily underestimates the similarity score when two sentences use completely different vocabulary yet have identical meaning (Type I). On the other hand, it tends to overestimate the similarity when the sentences use very related or even the same words but have different meaning (Types II & III). The similarity is also overestimated when two sentences contain antonyms, or when one sentence is a negation of the other (Types IV & V respectively). A lot of these flaws can be traced back to the well-known weaknesses of word embeddings and the distributional hypothesis, such as mixing together semantic similarity and conceptual relatedness (Hill et al., 2015; Mrkšić et al., 2016), failure to distinguish synonyms from antonyms (Mohammad et al., 2008; Mrkšić et al., 2016) and problems with negation. We hope that any counter-measures to these weaknesses will also improve the proposed sentence-level systems.
Appendix B Significance Analysis
Following the procedure described in Zhelezniak et al. (2019b), we construct 95% BCa confidence intervals for the delta in performance between two systems. The key results are as follows. MaxPool Spearman overall statistically outperforms DynaMax (Zhelezniak et al., 2019b) when word vectors are highly non-normal (GloVe) and looses when word vectors seem mostly normal (word2vec), which is in line with our main discussion. Next, max-pooling outperforms mean-pooling on the majority of subtasks for all word vector models. Finally, MaxPool Spearman is overall comparable to CKA Gaussian, with the exception of word2vec where CKA is slightly better.
| Type | Sentence 1 | Sentence 2 | Gold | Sys. | |
| I | Identical meaning but different words | ||||
| restrict or confine | place limits on (extent or access). | 4.75 | 1.69 | +3.06 | |
| the reduction of the extent of something, e.g, its size, importance or quantity | change toward something smaller or lower. | 4.4 | 1.49 | +2.91 | |
| an occasion on which people can assemble for social interaction and entertainment. | festive social event, celebration | 4.25 | 1.33 | +2.92 | |
| II | Related words but different meaning | ||||
| a man is playing the piano. | a woman is playing the violin. | 1 | 3.66 | -2.66 | |
| indonesian president to visit uk | indonesian president to visit australia | 1.4 | 4.29 | -2.89 | |
| a grey, black, and white cat looking at the camera. | a black and white dog looking at the camera. | 1 | 3.95 | -2.95 | |
| III | Same keywords but different meaning | ||||
| why do you need to peel peaches to can them? | how to peel peaches? | 1 | 4.57 | -3.57 | |
| what does it mean to write a song in a certain key? | is it possible to write a song without a key? | 1 | 4.04 | -3.04 | |
| IV | Antonyms | ||||
| chinese stocks close higher midday friday | chinese stocks open lower friday | 1 | 3.9 | -2.9 | |
| the act of beginning something new. | the act of ending something. | 0.8 | 3.67 | -2.87 | |
| higher than per cent but not very high. | lower than per cent but not very low. | 1 | 4.22 | -3.22 | |
| V | Negation | ||||
| you are a christian. | therefore you are not a christian. | 1.4 | 4.38 | -2.98 | |
| you should do it. | you should never do it. | 1 | 4.56 | -3.56 | |
| it’s not a good idea. | it’s a good idea to do both. | 1 | 3.9 | -2.9 |
| GloVe | fastText | word2vec | ||||||||
|---|---|---|---|---|---|---|---|---|---|---|
| MPS | DMX | 95% CI | MPS | DMX | 95% CI | MPS | DMX | 95% CI | ||
| STS12 | MSRpar | 40.00 | 49.41 | [-12.75, -6.26] | 44.48 | 48.94 | [-7.48, -1.53] | 36.70 | 41.74 | [-7.74, -2.40] |
| MSRvid | 77.66 | 71.92 | [4.35, 7.27] | 82.44 | 76.20 | [5.00, 7.59] | 74.34 | 76.86 | [-3.65, -1.47] | |
| SMTeuroparl | 46.52 | 48.43 | [-4.61, 0.84] | 50.18 | 53.08 | [-5.44, -0.50] | 34.13 | 28.03 | [3.63, 8.38] | |
| surprise.OnWN | 69.23 | 69.86 | [-2.21, 0.93] | 73.12 | 72.79 | [-1.01, 1.70] | 69.06 | 71.26 | [-3.38, -1.04] | |
| surprise.SMTnews | 49.28 | 51.47 | [-5.37, 1.40] | 55.01 | 53.26 | [-1.72, 5.61] | 45.09 | 50.44 | [-8.09, -2.78] | |
| STS13 | FNWN | 46.16 | 39.79 | [-2.72, 15.43] | 44.14 | 42.34 | [-7.33, 11.19] | 49.66 | 42.34 | [-0.97, 17.12] |
| headlines | 70.60 | 69.91 | [-0.75, 2.10] | 73.04 | 73.13 | [-1.26, 1.04] | 65.89 | 66.66 | [-1.97, 0.44] | |
| OnWN | 61.03 | 52.12 | [6.50, 11.66] | 71.37 | 65.35 | [3.97, 8.24] | 69.40 | 69.36 | [-1.23, 1.37] | |
| STS14 | deft-forum | 44.33 | 43.29 | [-2.29, 4.56] | 52.50 | 47.16 | [2.01, 8.80] | 45.60 | 47.27 | [-4.51, 1.22] |
| deft-news | 70.69 | 70.55 | [-2.62, 2.82] | 70.64 | 71.04 | [-3.01, 2.01] | 62.84 | 65.84 | [-5.30, -0.82] | |
| headlines | 65.65 | 64.49 | [-0.44, 2.76] | 68.38 | 68.22 | [-1.09, 1.39] | 62.00 | 63.66 | [-3.03, -0.27] | |
| images | 78.98 | 75.05 | [2.44, 5.51] | 81.46 | 79.39 | [0.95, 3.24] | 78.33 | 80.51 | [-3.28, -1.14] | |
| OnWN | 69.20 | 63.00 | [4.46, 8.07] | 75.92 | 72.83 | [1.86, 4.44] | 75.35 | 75.43 | [-0.90, 0.80] | |
| tweet-news | 74.77 | 74.30 | [-1.49, 2.58] | 76.38 | 78.41 | [-3.39, -0.70] | 71.17 | 75.47 | [-5.70, -2.96] | |
| STS15 | answers-forums | 67.33 | 61.94 | [1.75, 9.45] | 69.89 | 73.57 | [-6.98, -0.42] | 62.27 | 66.44 | [-7.59, -0.83] |
| answers-students | 71.28 | 73.53 | [-3.84, -0.71] | 73.30 | 75.82 | [-3.97, -1.12] | 74.20 | 75.07 | [-2.08, 0.25] | |
| belief | 72.83 | 67.21 | [2.28, 9.46] | 76.67 | 76.14 | [-2.21, 3.41] | 74.17 | 75.83 | [-3.67, 0.55] | |
| headlines | 72.14 | 72.26 | [-1.41, 1.08] | 74.78 | 74.45 | [-0.71, 1.31] | 68.49 | 69.95 | [-2.49, -0.46] | |
| images | 81.83 | 79.30 | [1.15, 3.98] | 84.84 | 83.33 | [0.50, 2.50] | 82.60 | 83.80 | [-2.08, -0.38] | |
| STS16 | answer-answer | 61.71 | 59.72 | [-1.64, 5.58] | 66.58 | 63.30 | [-1.24, 8.22] | 58.65 | 58.78 | [-3.09, 2.90] |
| headlines | 70.57 | 71.71 | [-3.04, 0.80] | 72.81 | 73.40 | [-2.50, 1.10] | 67.87 | 68.18 | [-1.97, 1.38] | |
| plagiarism | 78.02 | 79.92 | [-4.41, 0.44] | 82.97 | 82.68 | [-1.61, 2.22] | 80.59 | 82.05 | [-3.11, 0.02] | |
| postediting | 81.11 | 80.48 | [-1.30, 2.97] | 82.31 | 84.15 | [-3.73, 0.15] | 78.97 | 81.73 | [-4.91, -1.13] | |
| question-question | 66.88 | 63.51 | [-0.58, 7.85] | 74.19 | 69.71 | [1.03, 8.16] | 66.79 | 65.74 | [-2.99, 4.85] | |
| GloVe | fastText | word2vec | ||||||||
|---|---|---|---|---|---|---|---|---|---|---|
| MPS | ASP | 95% CI | MPS | ASP | 95% CI | MPS | ASP | 95% CI | ||
| STS12 | MSRpar | 40.00 | 35.90 | [-1.09, 9.00] | 44.48 | 39.66 | [-0.17, 9.82] | 36.70 | 38.79 | [-6.36, 2.07] |
| MSRvid | 77.66 | 68.80 | [6.87, 11.04] | 82.44 | 81.02 | [0.22, 2.68] | 74.34 | 77.88 | [-4.98, -2.20] | |
| SMTeuroparl | 46.52 | 48.73 | [-5.82, 1.45] | 50.18 | 50.29 | [-3.85, 3.41] | 34.13 | 16.96 | [12.54, 21.09] | |
| surprise.OnWN | 69.23 | 66.66 | [0.12, 5.28] | 73.12 | 73.15 | [-1.79, 1.88] | 69.06 | 70.75 | [-3.64, 0.15] | |
| surprise.SMTnews | 49.28 | 47.12 | [-3.49, 7.65] | 55.01 | 56.67 | [-6.13, 3.14] | 45.09 | 53.93 | [-13.49, -4.14] | |
| STS13 | FNWN | 46.16 | 43.21 | [-8.69, 14.23] | 44.14 | 49.40 | [-14.85, 3.81] | 49.66 | 40.73 | [-0.61, 19.27] |
| headlines | 70.60 | 67.59 | [1.16, 4.86] | 73.04 | 71.53 | [-0.12, 3.15] | 65.89 | 65.48 | [-1.29, 2.19] | |
| OnWN | 61.03 | 57.66 | [0.39, 6.44] | 71.37 | 74.33 | [-5.17, -1.00] | 69.40 | 67.49 | [-0.24, 4.08] | |
| STS14 | deft-forum | 44.33 | 39.03 | [0.24, 10.60] | 52.50 | 46.20 | [2.44, 10.69] | 45.60 | 42.95 | [-2.29, 9.03] |
| deft-news | 70.69 | 68.99 | [-2.55, 5.86] | 70.64 | 73.08 | [-5.80, 0.72] | 62.84 | 67.33 | [-8.61, -0.31] | |
| headlines | 65.65 | 61.87 | [1.78, 5.86] | 68.38 | 66.33 | [0.37, 3.78] | 62.00 | 62.09 | [-1.86, 1.88] | |
| images | 78.98 | 70.36 | [6.31, 11.03] | 81.46 | 80.51 | [-0.52, 2.39] | 78.33 | 76.98 | [-0.42, 3.18] | |
| OnWN | 69.20 | 67.45 | [-0.09, 3.68] | 75.92 | 79.37 | [-4.78, -2.12] | 75.35 | 74.69 | [-0.76, 2.17] | |
| tweet-news | 74.77 | 71.23 | [0.93, 6.60] | 76.38 | 74.89 | [-0.51, 3.83] | 71.17 | 68.78 | [-0.32, 5.75] | |
| STS15 | answers-forums | 67.33 | 50.25 | [11.71, 22.87] | 69.89 | 68.28 | [-2.58, 5.53] | 62.27 | 53.74 | [3.31, 13.88] |
| answers-students | 71.28 | 69.99 | [-1.16, 3.79] | 73.30 | 73.95 | [-2.72, 1.46] | 74.20 | 72.45 | [-0.12, 3.77] | |
| belief | 72.83 | 58.77 | [9.33, 20.04] | 76.67 | 73.71 | [-0.03, 6.03] | 74.17 | 61.73 | [8.05, 18.15] | |
| headlines | 72.14 | 69.61 | [0.86, 4.23] | 74.78 | 72.93 | [0.45, 3.18] | 68.49 | 68.58 | [-1.52, 1.40] | |
| images | 81.83 | 73.85 | [5.72, 10.37] | 84.84 | 83.18 | [0.33, 3.02] | 82.60 | 80.04 | [1.08, 4.07] | |
| STS16 | answer-answer | 61.71 | 43.99 | [10.25, 25.59] | 66.58 | 54.51 | [6.46, 18.13] | 58.65 | 43.41 | [8.65, 22.65] |
| headlines | 70.57 | 67.05 | [0.74, 6.55] | 72.81 | 71.00 | [-1.11, 4.68] | 67.87 | 66.55 | [-1.12, 4.03] | |
| plagiarism | 78.02 | 72.25 | [1.47, 10.68] | 82.97 | 84.45 | [-4.11, 0.74] | 80.59 | 75.21 | [1.93, 9.23] | |
| postediting | 81.11 | 69.03 | [8.03, 17.65] | 82.31 | 82.73 | [-2.80, 2.06] | 78.97 | 73.87 | [1.53, 9.58] | |
| question-question | 66.88 | 58.32 | [1.26, 15.14] | 74.19 | 72.29 | [-1.78, 5.20] | 66.79 | 63.94 | [-3.32, 9.19] | |
| GloVe | fastText | word2vec | ||||||||
|---|---|---|---|---|---|---|---|---|---|---|
| MPS | CKA | 95% CI | MPS | CKA | 95% CI | MPS | CKA | 95% CI | ||
| STS12 | MSRpar | 40.00 | 40.01 | [-2.97, 3.13] | 44.48 | 44.41 | [-2.53, 2.69] | 36.70 | 36.47 | [-2.42, 2.99] |
| MSRvid | 77.66 | 76.81 | [-0.48, 2.28] | 82.44 | 84.45 | [-3.06, -1.01] | 74.34 | 79.95 | [-7.04, -4.33] | |
| SMTeuroparl | 46.52 | 48.94 | [-5.04, 0.24] | 50.18 | 51.36 | [-3.20, 0.78] | 34.13 | 35.28 | [-3.68, 1.15] | |
| surprise.OnWN | 69.23 | 67.86 | [-0.21, 2.89] | 73.12 | 70.14 | [1.44, 4.57] | 69.06 | 68.19 | [-0.54, 2.37] | |
| surprise.SMTnews | 49.28 | 53.80 | [-8.09, -1.03] | 55.01 | 52.02 | [0.03, 6.21] | 45.09 | 48.30 | [-6.28, -0.43] | |
| STS13 | FNWN | 46.16 | 36.36 | [-0.46, 20.49] | 44.14 | 43.61 | [-8.39, 9.81] | 49.66 | 40.16 | [0.38, 20.09] |
| headlines | 70.60 | 71.85 | [-2.83, 0.28] | 73.04 | 73.61 | [-2.01, 0.87] | 65.89 | 64.66 | [-0.18, 2.77] | |
| OnWN | 61.03 | 60.95 | [-1.90, 2.17] | 71.37 | 74.25 | [-4.60, -1.38] | 69.40 | 72.06 | [-4.29, -1.20] | |
| STS14 | deft-forum | 44.33 | 50.65 | [-9.84, -2.84] | 52.50 | 54.16 | [-4.33, 1.15] | 45.60 | 52.17 | [-9.61, -3.73] |
| deft-news | 70.69 | 73.44 | [-5.59, 0.40] | 70.64 | 73.06 | [-5.57, 0.50] | 62.84 | 67.26 | [-7.53, -1.56] | |
| headlines | 65.65 | 66.32 | [-2.24, 0.89] | 68.38 | 68.45 | [-1.61, 1.51] | 62.00 | 61.54 | [-0.91, 1.93] | |
| images | 78.98 | 77.47 | [0.08, 2.95] | 81.46 | 81.76 | [-1.42, 0.76] | 78.33 | 80.57 | [-3.49, -1.07] | |
| OnWN | 69.20 | 69.16 | [-1.44, 1.52] | 75.92 | 78.46 | [-3.80, -1.36] | 75.35 | 77.00 | [-2.72, -0.61] | |
| tweet-news | 74.77 | 73.95 | [-0.92, 2.84] | 76.38 | 73.41 | [1.26, 4.81] | 71.17 | 71.86 | [-2.28, 1.03] | |
| STS15 | answers-forums | 67.33 | 66.48 | [-2.52, 4.20] | 69.89 | 72.78 | [-5.92, -0.14] | 62.27 | 64.01 | [-5.00, 1.36] |
| answers-students | 71.28 | 72.75 | [-3.22, 0.22] | 73.30 | 71.92 | [-0.23, 3.11] | 74.20 | 73.59 | [-0.86, 2.25] | |
| belief | 72.83 | 71.56 | [-2.26, 5.44] | 76.67 | 76.00 | [-1.28, 2.84] | 74.17 | 74.16 | [-2.56, 3.22] | |
| headlines | 72.14 | 74.05 | [-3.12, -0.71] | 74.78 | 75.58 | [-2.01, 0.35] | 68.49 | 69.00 | [-1.66, 0.68] | |
| images | 81.83 | 81.35 | [-0.97, 2.00] | 84.84 | 85.40 | [-1.52, 0.38] | 82.60 | 84.02 | [-2.37, -0.50] | |
| STS16 | answer-answer | 61.71 | 56.04 | [0.91, 10.55] | 66.58 | 61.81 | [1.28, 8.66] | 58.65 | 51.21 | [2.99, 12.68] |
| headlines | 70.57 | 70.83 | [-2.46, 1.94] | 72.81 | 72.87 | [-2.50, 2.12] | 67.87 | 65.52 | [0.39, 4.59] | |
| plagiarism | 78.02 | 79.36 | [-3.91, 1.41] | 82.97 | 79.83 | [0.66, 5.92] | 80.59 | 80.66 | [-1.99, 1.86] | |
| postediting | 81.11 | 79.94 | [-1.25, 4.32] | 82.31 | 80.40 | [0.16, 3.85] | 78.97 | 78.86 | [-2.01, 2.14] | |
| question-question | 66.88 | 72.01 | [-9.29, -1.58] | 74.19 | 73.68 | [-2.15, 3.23] | 66.79 | 70.59 | [-8.03, -0.16] | |