Thermally driven order-disorder transition in two-dimensional soft cellular systems
Abstract
Many systems, including biological tissues and foams, are made of highly packed units having high deformability but low compressibility. At two dimensions, these systems offer natural tesselations of plane with fixed density, in which transitions from ordered to disordered patterns are often observed, in both directions. Using a modified Cellular Potts Model algorithm that allows rapid thermalization of extensive systems, we numerically explore the order-disorder transition of monodisperse, two-dimensional cellular systems driven by thermal agitation. We show that the transition follows most of the predictions of Kosterlitz-Thouless-Halperin-Nelson-Young (KTHNY) theory developed for melting of 2D solids, extending the validity of this theory to systems with many-body interactions. In particular, we show the existence of an intermediate hexatic phase, which preserves the orientational order of the regular hexagonal tiling, but looses its positional order. In addition to shedding light on the structural changes observed in experimental systems, our study shows that soft cellular systems offer macroscopic systems in which KTHNY melting scenario can be explored, in the continuation of Bragg’s experiments on bubble rafts.
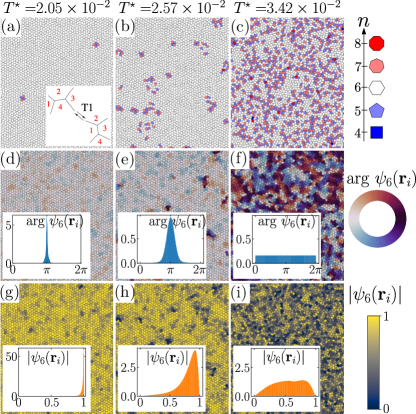
Foams, emulsions, and confluent biological tissues are examples of Soft Cellular Systems (SCS): They are constituted of highly deformable – yet almost incompressible – units (bubbles, drops, cells,…), interacting through attractive adhesive interactions and soft steric repulsions. When highly compacted, they tile the available space (3D) or plane (2D) perfectly, i.e. without gaps or overlaps. Interface energy is key to the cohesion and the rigidity of these systems, sometimes constituted solely of fluids. SCS have rough (mechanical) energy landscapes with many local minima: for a given number of units (with prescribed sizes), many different tilings are possible. In some cases the tiling is ordered, consisting predominantly of hexagons (in 2D), and in others it is disordered and includes a distribution of topological defects (polygons with sides). On the timescales considered here, the transition from one local minimum to another is achieved through a succession of elementary structural rearrangements, called T1 events (see inset in Fig. 1a), which preserve the integrity and size of the cellular units Foo .
Over the last years, special attention has been given to the glass transition in these systems Aste and Sherrington (1999); Davison and Sherrington (2000); Angelini et al. (2011); Bi et al. (2015, 2016), i.e. in the transition from a disordered, solid phase to a disordered, liquid phase. In many situations, though – and especially during morphogenetic movements – we observe a transition between ordered and disordered patterns, in both directions Quilliet et al. (2008); Durand et al. (2011, 2014); Zallen and Zallen (2004); Classen et al. (2005); Hočevar and Ziherl (2009). Such order-disorder transitions received little attention from a theoretical point of view Staple et al. (2010). In systems that are monodisperse in size, the structural disorder is of topological origin only: for 2D SCS, hexagonal tiling is the only monodisperse regular tiling, and structural disorder arises from the presence of non-hexagonal cells, or topological defects, that are generated by T1 events. Structural disorder strongly affects the mechanical properties of a tissue (or any other SCS), and is also essential for its function. Eventually, the study of the pattern of SCS or its fluctuations Sussman et al. (2018); Fodor et al. (2018) can teach us about its mechanical properties and provide a tool for diagnosis.
In the present letter, we numerically investigate the order-disorder phase transition in monodisperse 2D cellular systems, using a modified Cellular Potts Model algorithm that allows thermalization of large systems. Order-disorder transition in SCS is usually driven by a non-thermal source of energy: in a confluent tissue, T1s are consequences of cell activity powered with chemical energy (ATP). In passive SCS such as foams or emulsions, T1s are induced by the injection of mechanical energy through the application of some mechanical stress. Here, we modelize these out-of-equilibrium dynamics by an effective simulation temperature Sussman et al. (2018), and investigate the phase transition driven by this effective thermal agitation. Thermally driven transition will offer a benchmark system over which we will build up when comparing with actively driven transitions. Since the pioneering Bragg’s experiments Bragg and Nye (1947); Bragg and Lomer (1949), foams and bubble rafts have been recognized as macroscopic model systems for studying the geometry, the dynamics, and the deformation behavior of atomic or molecular materials. We show in the present study that foams also provide a macroscopic model for studying melting of two-dimensional materials.
Order-disorder transition in 2D SCS is reminiscent of defect-mediated theories for melting of two-dimensional solids. In these theories, the phase transition is described in terms of topological defects in the Voronoi partition associated with the lattice of the solids. Defect-mediated melting theories have been tested, experimentally and numerically, on a large variety of systems, including Lennard-Jones systems Chen et al. (1995), colloidal particles von Grünberg et al. (2007); Marcus and Rice (1996), magnetic beads Schockmel et al. (2013), and disks with either hard-core or soft potentials Kapfer and Krauth (2015). SCS yet differ in different aspects from all these classes of systems: firstly, the partition of 2D space is a physical partition, not a mathematical construction like Voronoi tesselation. Hence, energy and partition are directly related. Secondly, due to their unique high deformability–low compressibility feature, interactions between the cellular units are not pairwise additive Bi et al. (2016); Höhler and Cohen-Addad (2017); Ginot et al. (2019). Many-body interactions are known to affect the mechanical properties of SCS Höhler and Cohen-Addad (2017). They also make the phase transition scenario uncertain.
The most popular defect-mediated melting scenario is provided by the Kosterlitz-Thouless-Halperin-Nelson-Young (KTHNY) theory Strandburg (1988); Glaser and Clark (1993); von Grünberg et al. (2007), which predicts two-step melting, from the crystal to a intermediate hexatic phase and then from the hexatic to a liquid phase. The two transitions are associated with the disappearance of translational and orientational orders, successively. The intermediate hexatic phase has short-range translational order but quasi-long-range orientational order. The dissociation of bound dislocation pairs into free dislocations drives the solid into the hexatic phase, while the unbinding of dislocations into isolated disclinations drives the hexatic to liquid transition. Other melting scenarios are however possible. Those based on proliferation of vacancies or interstitials Glaser and Clark (1993) are irrelevant for SCS, in which such defects cannot take place. Another popular scenario argues that for systems with core energy of dislocations not too large compared to , melting is caused by nucleation and proliferation of grain-boundaries, preempting the hexatic phase Saito (1982); Chui (1983).
Our simulations are based on the Cellular Potts Model (CPM), which is widely used for simulating cellular systems in various fields of physics or biology, such as coarsening and mechanics of foams Glazier et al. (1990); Jiang et al. (1999), tissue morphogenesis Hirashima et al. (2017), cell sorting Graner and Glazier (1992) and collective cell motion in epithelial tissues Szabó et al. (2010); Kabla (2012). The CPM is a lattice based modeling technique: each cell is represented as a subset of lattice sites sharing the same cell ID (analogical to spins in Potts model). Cellular domains can adopt any shape on the lattice. The CPM is then particularly suited to simulate thermal fluctuations of cellular systems, as it reproduces realistically the fluctuations of interface locations, even for wavelength at subcellular scale. Furthermore, its extension to three dimensions is straightforward. The system evolves using a recently modified Metropolis algorithm that preserves the integrity of the cellular domains and satisfies the detailed balance equation Durand and Guesnet (2016), ensuring that the probability distribution of visited states converges to the Boltzmann distribution. This algorithm has also been proved to be more efficient that the standard algorithm used in CPM for a same simulation temperature Durand and Guesnet (2016), allowing us to simulate much larger systems.
Mechanical energy of monodisperse SCS is modeled by the discretized version of the following Hamiltonian:
| (1) |
The first term in Eq. 1 accounts for interfacial effects: the sum is carried over neighboring cells and is the boundary length between cells and . The second term accounts for an effective area elasticity which results from a combination of three-dimensional cell incompressibility and cell bulk elasticity. is the effective 2D bulk modulus, is the actual area of cell , and the preferred cell area. This simplified version of the standard Hamiltonian used for cellular systems Staple et al. (2010); Bi et al. (2015, 2016) corresponds to the situation of a foam or an epithelium with inflated shapes Sup ; Staple et al. (2010).
We emphasize that Hamiltonian (1) cannot be expressed as a sum of pairwise interactions: because cellular units have high deformability but low compressibility, they adjust their shape rather than their size when brought in contact. In a confluent system, any modification of the interface between cells and will imply a displacement of the two cell centers, but also of the other neighboring cells in order to tile the plane perfectly, while preserving cell areas. As a consequence, contact length does not only depend on the relative position of the two adjacent cells and , but also on the positions of other neighboring cells Bi et al. (2016); Höhler and Cohen-Addad (2017); Ginot et al. (2019).
The relative importance of thermal, interfacial and bulk energies are quantified with two dimensionless parameters: the reduced temperature and the reduced compressibility , where is the equivalent hexagonal lattice step: . must be low enough to reproduce accurately real systems, but must remain finite to allow for some area fluctuations required by the Metropolis-like algorithm.
We have performed extensive numerical simulations of systems of cells in a rectangular lattice of sites under periodic conditions (then pixels2). Periodic boundary conditions allow global translations of the lattice, but forbid global rotations. The lattice aspect ratio approximates the target value of , corresponding to the aspect ratio of a perfect hexagonal lattice, with error less than . For all simulation runs, we start with the same ordered hexagonal tiling (honeycomb), and wait for equilibration before recording data (see Sup for details on estimation of equilibration time). In all our simulations, we choose , and so .
Figs. 1(a–c) show the equilibrated system at three different temperatures, with non-hexagonal cells that are color-coded. At low temperature (1a), the only topological defects are bound dislocation pairs. At intermediate temperature (1b), paired and single dislocations coexist. At high temperature (1c), most of topological defects are assembled into aggregates.
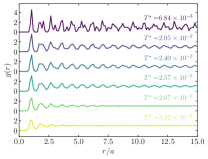
To characterize the static structure of the cellular system occurring during 2D melting, we first calculate the pair correlation function , defined as
| (2) |
where and are the geometric center positions of cells and , respectively. The angular brackets denote an average over central cell . This correlation function gives the probability to find two cells separated by a distance . Fig. 2a shows that the peaks of get broader and shorter as temperature increases, indicating that the system melts from an ordered crystal to a disordered liquid.
To get more insights into the structural change during the melting process, we focus on the two order parameters which characterize the translational and orientational symmetries of the system, respectively. The global translational order parameter is defined by
| (3) |
where is the local translational order parameter for cell at position , and is a primary reciprocal lattice vector. The global orientational order parameter is given by
| (4) |
where is the local orientational parameter order, is the number of neighbors of cell , and is the angle of the bond between centers of cell and relative to a fixed reference axis. The magnitude of the local orientational order, ranges from to and measures the degree to which the cell’s neighbourhood resembles a hexagonal crystal, while its phase indicates the local lattice director.
Spatial distributions of and are shown in Figs. 1(d–i) at three different temperatures. Spatial heterogeneities increase with temperature. Normalized histograms of and are shown in the corresponding insets. Both quantities are clearly peaked in the solid and intermediate phases, revealing that the orientational order is preserved in these two phases. Peaks are more spread out in the intermediate phase, indicating a quasi-long orientational order in this phase, as expected for the hexatic phase predicted by the KTHNY theory. In the liquid phase, distributions are flat and the orientational order is lost.
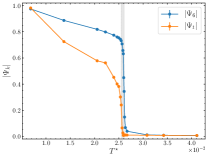
Fig. 2b shows the variation of the global order parameters and with temperature. Both curves present similar tendencies: at low temperature, both order parameters decay slowly with . The decay is more pronounced for , suggesting a quasi long-range orientational order in the solid phase. Then, both curves drop abruptly to . falls slightly before , suggesting the existence of two distinct phase transitions, and subsequently the existence of an intermediate hexatic phase, in agreement with KTHNY scenario.
To further characterize the transition, we now analyze the correlation functions of the two local order parameters, for which specific behaviors are expected within the KTHNY theory Strandburg (1988); Glaser and Clark (1993); von Grünberg et al. (2007). They are defined as
| (5) |
with .
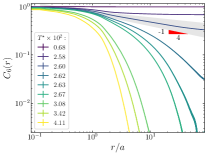
In Fig. 3a, shows two different decaying behaviors: for , decays algebraically, which is a signature of a quasi-long range positional order, and is typical of a 2D solid phase. For , decays exponentially, revealing a short range positional order. Near the transition between the two regimes, the power-law exponent is close to , in agreement with the prediction of the KTHNY theory.
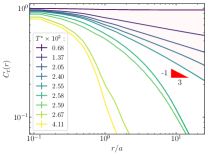
In Fig. 3b, exhibits three different behaviors: at low temperatures (), approaches constants, and the system is in the solid phase with long-range orientational order. At intermediate temperature (), decays algebraically with an exponent close to , which agrees with the prediction of the KTHNY theory and confirms the existence of an hexatic phase. When the temperature is further increased, decays exponentially and the system becomes a liquid.
To determine more precisely the phase-transition points, we plot the susceptibilities associated with the two order parameters. Unlike correlation functions, the divergence of susceptibility has been shown to be robust to finite-size or finite-time effects. Fig. 4a shows the variation of the susceptibilities with temperature.
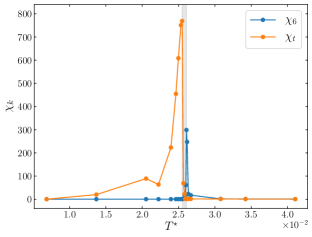
Their sharp peaks clearly indicate two transitions in the melting process. The peak for is centered at , while the peak for is centered at , confirming the existence of an intermediate hexatic phase. It must be emphasized that the values of , we find are specific to the value of the reduced compressibilitiy chosen for our simulations. The peak for is much higher than for , suggesting a continuous solid-hexatic transition and a first-order hexatic-liquid transition. This modified KTHNY scenario has also been observerd for systems of hard disks Bernard and Krauth (2011).
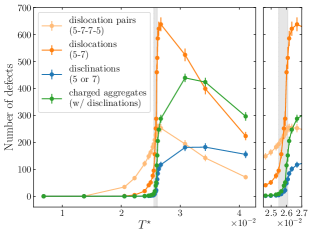
KTHNY theory relates the disappearance of translational and rotational orders to dislocations and disclinations unbinding, respectively. To test this scenario, we report on Fig. 5 the evolution of population of defects with temperature. Detection and counting of the different defects are detailed in the Supplemental Material Sup . As expected, coincides with the rapid increase of isolated dislocations due to the the dissociation of bound dislocation pairs. On the other hand, the number of disclinations shows a moderate increase around . In fact, although the KTHNY scenario assumes that the defects remain diluted during the melting process, in our systems the concentration of defects is such that they form aggregates whose number and mean size increase with temperature. This aggregation is a natural consequence of the attractive interactions between defects. Aggregates with a non-zero topological charge (i.e. containing unequal numbers of 5-sided and 7-sided cells) participate as much as free disclinations in the destruction of the orientational order, and hence must be accounted for. Fig. 5 shows that the population of charged aggregates (including disclinations) increases significantly around , in good agreement with the KTHNY scenario.
In summary, we used a recent CPM modified algorithm that allows for thermalization of large cellular systems, and showed that soft cellular systems follow closely the KTHNY melting scenario, hence extending the validity of this theory to systems with many-body interactions. We showed in particular the existence of an intermediate hexatic phase. Topological properties of SCS have been mainly characterized by , the proportion of -sided cells within the system (and many times by the second moment of this distribution solely). Our study shows that is often not sufficient to capture the mechanical properties of the system, as it can be in a solid, hexatic, or liquid phase. Spatial correlations of defects must also be accounted for. We hope our results will stimulate relevant experimental work to test the existence of an intermediate phase in the order-disorder transitions observed during morphogenetic movements Zallen and Zallen (2004); Classen et al. (2005); Hočevar and Ziherl (2009). As the defect core energy is the vital predictor of the melting mechanism between KTHNY and grain-boundary scenarios, it would be valuable to quantify the defect core energy of SCS in the future.
References
- (1) Other structural rearrangements which do not preserve the number and sizes of of the cellular units – such as cell division or apoptosis in biological tissues, or coarsening in foams and emulsions – usually occur on longer time scales.
- Aste and Sherrington (1999) T. Aste and D. Sherrington, Journal of Physics A: Mathematical and General 32, 7049 (1999).
- Davison and Sherrington (2000) L. Davison and D. Sherrington, Journal of Physics A: Mathematical and General 33, 8615 (2000).
- Angelini et al. (2011) T. E. Angelini, E. Hannezo, X. Trepat, M. Marquez, J. J. Fredberg, and D. A. Weitz, Proceedings of the National Academy of Sciences 108, 4714 (2011).
- Bi et al. (2015) D. Bi, J. H. Lopez, J. M. Schwarz, and M. L. Manning, Nature Physics 11, 1074 (2015), ISSN 1745-2473, 1745-2481.
- Bi et al. (2016) D. Bi, X. Yang, M. C. Marchetti, and M. L. Manning, Physical Review X 6 (2016), ISSN 2160-3308.
- Quilliet et al. (2008) C. Quilliet, S. A. Talebi, D. Rabaud, J. Käfer, S. Cox, and F. Graner, Philosophical Magazine Letters 88, 651 (2008).
- Durand et al. (2011) M. Durand, J. Käfer, C. Quilliet, S. Cox, S. A. Talebi, and F. Graner, Physical Review Letters 107 (2011), ISSN 0031-9007, 1079-7114.
- Durand et al. (2014) M. Durand, A. M. Kraynik, F. van Swol, J. Käfer, C. Quilliet, S. Cox, S. Ataei Talebi, and F. Graner, Physical Review E 89 (2014), ISSN 1539-3755, 1550-2376.
- Zallen and Zallen (2004) J. A. Zallen and R. Zallen, Journal of Physics: Condensed Matter 16, S5073 (2004).
- Classen et al. (2005) A.-K. Classen, K. I. Anderson, E. Marois, and S. Eaton, Developmental Cell 9, 805 (2005), ISSN 1534-5807.
- Hočevar and Ziherl (2009) A. Hočevar and P. Ziherl, Physical Review E 80 (2009), ISSN 1539-3755, 1550-2376.
- Staple et al. (2010) D. B. Staple, R. Farhadifar, J. C. Röper, B. Aigouy, S. Eaton, and F. Jülicher, The European Physical Journal E 33, 117 (2010), ISSN 1292-895X.
- Sussman et al. (2018) D. M. Sussman, J. Schwarz, M. C. Marchetti, and M. L. Manning, Physical Review Letters 120 (2018), ISSN 0031-9007, 1079-7114.
- Fodor et al. (2018) E. Fodor, V. Mehandia, J. Comelles, R. Thiagarajan, N. S. Gov, P. Visco, F. van Wijland, and D. Riveline, Biophysical Journal 114, 939 (2018), ISSN 00063495.
- Bragg and Nye (1947) W. L. Bragg and J. F. Nye, Proceedings of the Royal Society of London A: Mathematical, Physical and Engineering Sciences 190, 474 (1947), ISSN 0080-4630.
- Bragg and Lomer (1949) W. L. Bragg and W. M. Lomer, Proceedings of the Royal Society of London A: Mathematical, Physical and Engineering Sciences 196, 171 (1949), ISSN 0080-4630.
- Chen et al. (1995) K. Chen, T. Kaplan, and M. Mostoller, Phys. Rev. Lett. 74, 4019 (1995).
- von Grünberg et al. (2007) H. H. von Grünberg, P. Keim, and G. Maret, in Colloidal order : entropic and surface forces, edited by G. Gompper (WILEY-VCH, Weinheim, 2007), no. 3 in Soft matter, pp. 40–83, ISBN 978-3-527-31370-9.
- Marcus and Rice (1996) A. H. Marcus and S. A. Rice, Phys. Rev. Lett. 77, 2577 (1996).
- Schockmel et al. (2013) J. Schockmel, E. Mersch, N. Vandewalle, and G. Lumay, Physical Review E 87 (2013), ISSN 1539-3755, 1550-2376.
- Kapfer and Krauth (2015) S. C. Kapfer and W. Krauth, Phys. Rev. Lett. 114, 035702 (2015).
- Höhler and Cohen-Addad (2017) R. Höhler and S. Cohen-Addad, Soft Matter 13, 1371 (2017).
- Ginot et al. (2019) G. Ginot, R. Höhler, S. Mariot, A. Kraynik, and W. Drenckhan, Soft Matter 15, 4570 (2019).
- Strandburg (1988) K. J. Strandburg, Reviews of modern physics 60, 161 (1988).
- Glaser and Clark (1993) M. A. Glaser and N. A. Clark, Melting and Liquid Structure in two Dimensions (John Wiley & Sons, Inc., 1993), pp. 543–709, ISBN 9780470141410.
- Saito (1982) Y. Saito, Physical Review B 26, 6239 (1982).
- Chui (1983) S. T. Chui, Physical Review B 28, 178 (1983).
- Glazier et al. (1990) J. A. Glazier, M. P. Anderson, and G. S. Grest, Philos. Mag. B 62, 615 (1990).
- Jiang et al. (1999) Y. Jiang, P. J. Swart, A. Saxena, M. Asipauskas, and J. A. Glazier, Physical Review E 59, 5819 (1999).
- Hirashima et al. (2017) T. Hirashima, E. G. Rens, and R. M. H. Merks, Development, Growth & Differentiation 59, 329 (2017).
- Graner and Glazier (1992) F. Graner and J. A. Glazier, Physical Review Letters 69, 2013 (1992).
- Szabó et al. (2010) A. Szabó, R. Ünnep, E. Méhes, W. O. Twal, W. S. Argraves, Y. Cao, and A. Czirók, Physical Biology 7, 046007 (2010).
- Kabla (2012) A. J. Kabla, Journal of The Royal Society Interface p. rsif20120448 (2012).
- Durand and Guesnet (2016) M. Durand and E. Guesnet, Computer Physics Communications 208, 54 (2016), ISSN 00104655.
- (36) See Supplemental Material at [URL will be inserted by publisher] for further details on numerical simulations, which includes Refs. Ouchi et al. (2003); Magno et al. (2015); Farhadifar et al. (2007); Bi et al. (2015).
- Bernard and Krauth (2011) E. P. Bernard and W. Krauth, Physical Review Letters 107 (2011), ISSN 0031-9007, 1079-7114.
- Ouchi et al. (2003) N. B. Ouchi, J. A. Glazier, J.-P. Rieu, A. Upadhyaya, and Y. Sawada, Physica A: Statistical Mechanics and its Applications 329, 451 (2003), ISSN 03784371.
- Magno et al. (2015) R. Magno, V. A. Grieneisen, and A. F. Marée, BMC Biophysics 8 (2015), ISSN 2046-1682.
- Farhadifar et al. (2007) R. Farhadifar, J.-C. Röper, B. Aigouy, S. Eaton, and F. Jülicher, Current Biology 17, 2095 (2007), ISSN 0960-9822.