Adaptive Reverberation Absorption using Non-stationary Masking Components Detection for Intelligibility Improvement
Abstract
This letter proposes a new time domain absorption approach designed to reduce masking components of speech signals under noisy-reverberant conditions. In this method, the non-stationarity of corrupted signal segments is used to detect masking distortions based on a defined threshold. The non-stationarity is objectively measured and is also adopted to determine the absorption procedure. Additionally, no prior knowledge of speech statistics or room information is required for this technique. Two intelligibility measures (ESII and ASIIST) are used for objective evaluation. The results show that the proposed scheme leads to a higher intelligibility improvement when compared to competing methods. A perceptual listening test is further considered and corroborates these results. Furthermore, the updated version of the SRMR quality measure (SRMRnorm) demonstrates that the proposed technique also attains quality improvement.
Index Terms:
Reverberation, absorption, non-stationarity, intelligibilityI Introduction
Speech communication commonly takes place in enclosed and urban environments such as concert halls, kitchens and offices. Along with the direct acoustic signal propagation between source and listener locations, the sound reverberates due to reflection in walls and surfaces.While the early reflections (ER) can improve speech intelligibility, late reverberation (LR) may cause quality and intelligibility reduction [1][2][3][4].
Room impulse response (RIR) typically describes the sound propagation and is generally described by the reverberation time () and the direct-to-reverberant ratio (DRR). Speech signals can also be degraded by background acoustic noises (Babble, Chainsaw and Cafeteria) present in the urban space. Such effects are non-stationary masking components and represent a major drawback to speech intelligibility improvement.
In the literature, speech enhancement solutions were designed to cope with background non-stationary noises [5][6][7][8] attaining interesting results for quality and intelligibility. However, room reverberation is not considered by these techniques. Adaptive time-domain pre-processing methods were proposed to improve speech intelligibility by mitigating the reverberation effect. The Steady State Suppresion (SSS) [9] solution considers the importance of transient regions of speech for intelligibility and suppresses steady-state frames to reduce overlap masking effects. A more recent approach, the Adaptive Gain Control (AGC) [10] method uses prior knowledge of speech statistics and the RIR information to adaptively improve or reduce the energy of speech frames. Both methods operate prior to speech signal presentation in a room, such that the resulting reverberated signal is similar to its anechoic version.
This letter proposes a new time-domain method denominated Adaptive Reverberation Absorption with Non-Stationary Detection (ARANSD). Different from SSS and AGC techniques, the main idea of this proposal is to act similar to a physical element, changing the low absorption characteristic of materials that compose a room in the listener position. One major advantage of ARANSD is that it adaptively absorbs masking components of corrupted speech signals. Thus, leading to speech intelligibility improvement with no prior knowledge of the RIR or speech statistics. The Index of Non-Stationarity (INS) [11] is selected as an objective measure for the detection of masking components. A non-stationarity threshold is defined for the proposed frame-by-frame absorption procedure.
Extensive experiments are conducted to objectively evaluate the ARANSD method for speech intelligibility improvement. The noisy-reverberant scenario is composed of two real reverberant rooms and four background non-stationary acoustic noises with five different SNR values. The ESII [12] and ASIIST [13] measures are adopted for the intelligibility prediction. These measures are explicitly designed to deal with the non-stationarity of speech and its distortions. The SRMRnorm [14] measure is further considered as it is primarily used for signals under reverberation effect. A subjective listening test is also performed and results show that the proposed method outperforms the competing techniques in terms of speech intelligibility.
II Reverberation and Non-Stationarity
The reverberation effect is usually defined as a linear filtering process such that, given a RIR , the reverberated signal can be obtained by convolution. In real environments, acoustic noises are also a common distortion, which means that the resultant noisy-reverberant speech signal can be obtained by , where is the clean speech signal and is the background noise.
The Index of Non-Stationarity (INS) [11] is here defined to objectively examine the non-stationarity of speech signals under noisy-reverberant environments. This measure compares the target signal with stationarity references called surrogates for different time scales , where is the short-time spectral analysis length and is the total signal duration. For each length , a threshold is defined to keep the stationarity assumption considering a confidence degree as
| (1) |
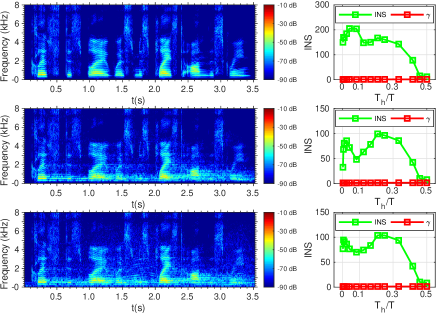
Figure 1 illustrates the spectrograms and INS values obtained for a direct speech signal and its corresponding reverberated version in the Aula Carolina111RIR collected from the AIR database [15]. room with s in two conditions: without and with a background Chainsaw noise at dB. Note that reverberation and acoustic noise significantly change the temporal and spectral structure of speech signal. These masking effects can engender intelligibility reduction [1][2][3]. Furthermore, the non-stationary behavior of the natural speech signal is considerably attenuated, varying its maximum INS value from 200 to around 100. The background Chainsaw noise increases the INS value in small scales, which means that short-time segments become more distinct from the overall signal. As INS alters on noisy-reverberant scenarios, it can be a useful instrument for detection of such effects. In this work, the INS is adopted for detection and reduction of masking components.
III Adaptive Reverberation Absorption with Non-Stationary Detection
The ARASND method is presented in this section. The technique is described in two main phases: reverberation detection and acoustic absorption.
III-A Reverberation Detection
A reverberation group (RG), denoted as , is here defined as the -th segment composed of consecutive frames of the corrupted speech. This window duration is selected to enable a long-term temporal observation of the reverberation effect and detect noisy-reverberant masking components. Successive RGs are obtained considering a % overlap between signals.
For each , the INS values are computed considering different scales of . The INS values obtained for all scales are grouped into a vector which characterizes the non-stationary behavior of the -th RG. Consecutive vectors are then used to compute a normalized variation of the non-stationary property as
| (2) |
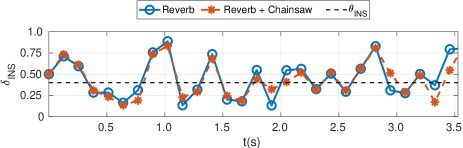
Figure 2 shows the values obtained for the reverberated and noisy-reverberated speech signals of Figure 1. Note that even with masking components, important speech regions, e.g. the ones near s, s, s and s (refer to Fig.1 (top)), are still identified by the highest values of in both conditions. Moreover, masked regions closed to s, s and s attain low values. This demonstrates that the proposed is an interesting detection approach for noise and reverberation masking components. The (black dashed line) in Figure 2 illustrates a threshold of non-stationarity defined by the median value of . In this example, value is indicating the difference of the speech and noisy-reverberant regions.
III-B Acoustic Absorption
The proposed ARANSD absorption approach is implemented on a frame-by-frame basis and is established depending on the value of . For each frame , a INS vector is extracted similarly as in Section III-A. A short-time distance is then computed as in (2) and used to determine the -th frame absorption.
Sigmoid functions are selected to assign each value of to a corresponding absorption because of their smoothness and monotonic property. The proposed adaptive absorption is therefore defined in every frame by
|
|
(3) |
where and are the inflection points with corresponding growth rate of and . The stands for a minimum shift in order to avoid total absorption of signal frames. Moreover and are the maximum absorption values. As the noisy-reverberant masking effect is non-stationary by nature it is important to determine an adaptive upper bound absorption. Both and the factor are considered for this task. The first one is updated accounting the overlapped region as , where assigns the importance of the present RG signal. The second term is defined as the factor to guarantee that only for . As represents the short-term non-stationarity behavior, the absorption maintain a high value if for it refers to an important speech region. The processed signal is obtained by overlap add process of absorbed frames .
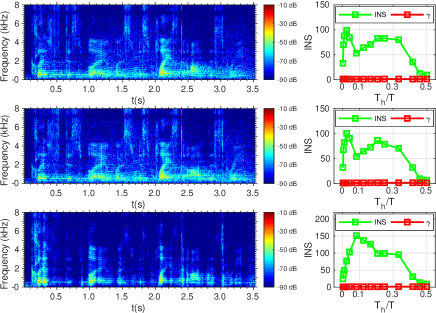
Figure 3 depicts the spectrograms and INS values of the noisy-reverberant signal (refer to Figure 1 (bottom)) processed by the baseline SSS, the AGC technique and the proposed ARANSD. Note that, the ARANSD is able to absorb masking components of the corrupted signal, e.g. near s and s, which makes the resulting signal more similar to its anechoic version. Moreover, the proposed method restores the natural non-stationarity behavior raising the INS value from up to , which is closer to the direct signal.
IV Experiments and Discussion
Several noisy-reverberant conditions are used to evaluate the SSS [9], the AGC [10] and the proposed ARANSD technique in terms of intelligibility. A subset of 24 speakers (16 male and 8 female) are randomly selected from the TIMIT speech database [16], which leads to a total of 240 speech signals (ten for each speaker). ¿From these, 100 are arbitrarily chosen for the test signal and the remaining are used on the speech modeling step of AGC. Each speech segment is sampled at kHz and has, on average, 3 seconds. Two real reverberation rooms from the AIR database [15] are considered in the experiments. The Stairway is characterized by a medium reverberation time ( s) and a small value of DRR dB. The Aula Carolina room presents parameters of s and a higher value of DRR dB. Both RIRs are equalized for a total energy of dB. The Babble, SSN, Cafeteria and Chainsaw additive background noises are selected, respectively, from the RSG-10 [17], DEMAND [18] and Freesound.org222Available at www.freesound.org. databases. Except for the SSN, all other noises are characterized with non-stationary behavior.
Speech signals are corrupted considering five SNRs values varying from dB up to dB, where the SNRs are measured between the original unprocessed speech and the background noise. The SNR range is adopted to guarantee ESII and ASIIST scores between and for the unprocessed (UNP) speech signal in all scenarios. These values are defined as thresholds of poor and good intelligibility [19][20], respectively. All UNP intelligibility scores are presented in Tables I and II. The smallest value (ESII) is achieved for the Stairway room with the highly non-stationary Chainsaw noise at dB. The Aula Carolina room with Cafeteria noise at dB presents the highest score of ASIIST. The ARASND operates with ms frames and . The maximum value for relevant speech regions is set to and the RG importance to in all scenarios. The sigmoid parameters are fixed to for and for . The minimum shift is set to .
IV-A Objective Evaluation of Intelligibility
| Stairway ( s) | Aula Carolina ( s) | ||||||||||
| SNR (dB) | -3 | -2 | -1 | 0 | 1 | -3 | -2 | -1 | 0 | 1 | |
| Noises | Babble | 0.53 | 0.53 | 0.54 | 0.55 | 0.56 | 0.64 | 0.65 | 0.66 | 0.67 | 0.67 |
| Cafeteria | 0.54 | 0.55 | 0.56 | 0.56 | 0.57 | 0.65 | 0.66 | 0.67 | 0.67 | 0.68 | |
| Chainsaw | 0.48 | 0.49 | 0.50 | 0.51 | 0.52 | 0.57 | 0.58 | 0.59 | 0.61 | 0.62 | |
| SSN | 0.52 | 0.52 | 0.53 | 0.54 | 0.55 | 0.62 | 0.63 | 0.64 | 0.65 | 0.66 | |
| Stairway ( s) | Aula Carolina ( s) | ||||||||||
| SNR (dB) | -3 | -2 | -1 | 0 | 1 | -3 | -2 | -1 | 0 | 1 | |
| Noises | Babble | 0.58 | 0.59 | 0.60 | 0.61 | 0.61 | 0.68 | 0.68 | 0.69 | 0.70 | 0.71 |
| Cafeteria | 0.60 | 0.61 | 0.61 | 0.62 | 0.62 | 0.69 | 0.70 | 0.70 | 0.71 | 0.71 | |
| Chainsaw | 0.55 | 0.56 | 0.57 | 0.58 | 0.58 | 0.62 | 0.63 | 0.64 | 0.65 | 0.66 | |
| SSN | 0.58 | 0.58 | 0.59 | 0.60 | 0.61 | 0.66 | 0.67 | 0.68 | 0.69 | 0.70 | |
The ESII [12] and ASIIST [13] measures are adopted to evaluate the intelligibility improvement under non-stationary noisy-reverberant conditions. The direct path speech signal is chosen as the reference signal. Since late reverberation and additive background noise reduce intelligibility and are uncorrelated to , the jointly distortion is obtained by the subtraction . These objective measures are normalized by the intelligibility achieved for the clean unprocessed signal corrupted by SSN noise at dB, considered here as a good intelligibility reference.
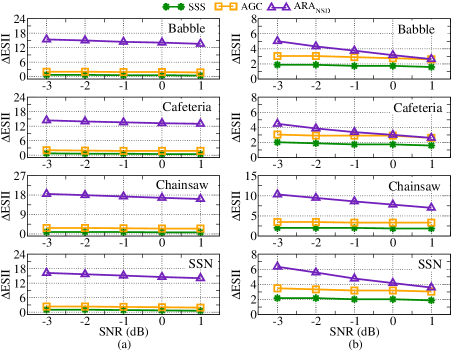
The ESII intelligibility improvement (ESII) is presented on Figure 4 for the Stairway and Aula Carolina rooms. In the first case, the ARANSD outperforms the competing methods accomplishing more than seven times the AGC value in most of the cases. For the Cafeteria scenario at dB the proposed technique achieves an improvement of , which corresponds to an assessment eight times the value of for the AGC method. As the Stairway room presents a DRR of dB, the reverberation energy in this room is considerably higher than the energy related to the direct signal. This means that the masking components are highlighted in this scenario. As the proposed ARANSD is an absorption approach designed to detect such effects, it is able to effectively reduce the temporal coloration. The SSS technique presents the smallest overall intelligibility improvement. Considering the Aula Carolina room, the proposed method also achieves the highest improvement for most of the cases. This is observed for all noisy-reverberant conditions contemplating SNRs below or equal to dB. The best ESII results are obtained by ARANSD considering the most challenge condition of Chainsaw acoustic noise. The ARANSD technique presents similar improvement as AGC for both Babble and Cafeteria noises at dB.
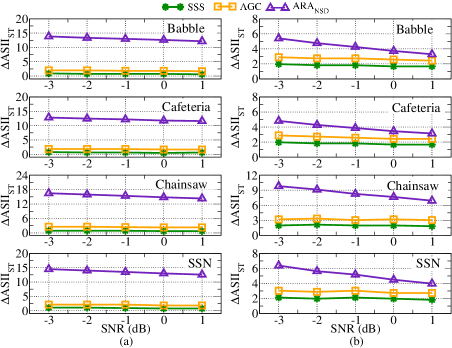
Figure 5 depicts the ASIIST values for both reverberation rooms. For the Stairway room, the proposed method effectively attenuates masking components and attains the highest intelligibility improvement results for all conditions with ASIIST values above . The ARANSD accomplished the highest overall ASIIST of for the highly non-stationary Chainsaw noise at dB. Baseline technique SSS is outperformed by the ARANSD and AGC algorithms in all scenarios. The ARANSD also presents the best ASIIST intelligibility results for the Aula Carolina room. Once again, the highly non-stationary Chainsaw noise leads to the most challenge condition. In this case, the ARANSD is still able to achieve an average improvement of , compared to and for the AGC and SSS techniques, respectively.
The SRMR quality metric [21] estimates the human perceived reverberation effect on speech signals. Its updated version, the SRMRnorm [14], is also selected for objective evaluation. The goal is to distinguish among the three approaches the ones that can better mitigate temporal coloration on speech signals. The direct signal is used as a reference for normalization, such that the SRMRnorm presents values ranging between , where determines a reverberation free signal.
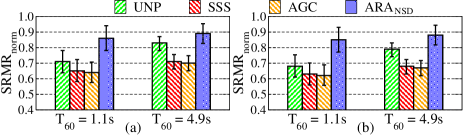
Figure 6 illustrates the average SRMRnorm values for the Stairway and Aula Carolina rooms under a noise-free reverberation condition (a) and a noisy-reverberation scenario with SSN background noise at dB (b). Note that the ARANSD attains the best SRMRnorm values for all situations with a mean of and for the Stairway and Aula Carolina rooms, respectively. This implies that the proposed method achieved an average quality increment of and for these rooms when compared with the UNP case. The SSS and AGC techniques present similar behavior, attaining the worst average SRMRnorm values in these scenarios. These results reinforce the capacity of the proposed method to absorb masking components providing intelligibility and quality improvement.
IV-B Subjective Intelligibility Evaluation
A listening test [22] with ten native male Brazilian volunteers was conducted considering a closed scenario of phonetic balanced words333 The complete test database is available at lasp.ime.eb.br.. Their ages ranged from to years with an average of . A simulated room with x x m3 and s was generated by the image source method (ISM) [23]. The SSN acoustic noise was adopted with SNRs of dB, dB and dB. Ten words were applied for each of test conditions, i.e., three SNR levels for three methods plus the unprocessed case. Participants were introduced to the task in a training session with 8 words. The material was diotically presented using a pair of Roland RH-200S headphones. Listeners heard each word once in an arbitrary presentation order.
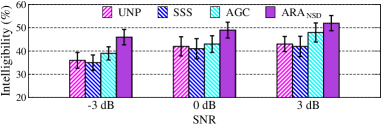
The average intelligibility scores and standard deviations values for each method are presented in Figure 7. The ARANSD improves the intelligibility under all conditions over competing techniques. The proposed method improves , and against , and for the AGC under SNR values of dB, dB and dB, respectively. In accordance with findings of [10][13], SSS attains scores less than or equal to the UNP case.
V Conclusion
This letter proposed a new time domain absorption approach designed to reduce masking components of speech signals under noisy-reverberant conditions. In this method, the non-stationarity of segments of the corrupted signal is used to detect masking distortions based on a defined threshold. The non-stationarity degree was objectively measured with the INS and was also adopted to determine the absorption procedure. Two reverberant rooms and four acoustic noises were used to compose the noisy-reverberant scenarios. Two intelligibility measures were used for objective evaluation. The results showed that the proposed scheme leads to a higher intelligibility improvement when compared to competing methods. A perceptual listening test corroborated these results. An objective quality measure demonstrated that the proposed technique attains quality improvement.
References
- [1] R. Bolt and A. MacDonald, “Theory of speech masking by reverberation,” The Journal of the Acoustical Society of America, vol. 21, no. 6, pp. 577–580, 1949.
- [2] A. Nabelek, “Communication in noisy and reverberant environments,” Acoustical factors affecting hearing aid performance, pp. 15–28, 1993.
- [3] P. Assmann and Q. Summerfield, “The perception of speech under adverse conditions,” in Speech processing in the auditory system, pp. 231–308, Springer, 2004.
- [4] J. S. Bradley, H. Sato, and M. Picard, “On the importance of early reflections for speech in rooms,” The Journal of the Acoustical Society of America, vol. 113, no. 6, pp. 3233–3244, 2003.
- [5] T. Gerkmann and R. C. Hendriks, “Unbiased mmse-based noise power estimation with low complexity and low tracking delay,” IEEE Transactions on Audio, Speech, and Language Processing, vol. 20, no. 4, pp. 1383–1393, 2012.
- [6] L. Zão, R. Coelho, and P. Flandrin, “Speech enhancement with emd and hurst-based mode selection,” IEEE/ACM Transactions on Audio, Speech, and Language Processing, vol. 22, no. 5, pp. 899–911, 2014.
- [7] R. Coelho and L. Zão, “Empirical mode decomposition theory applied to speech enhancement,” in Signals and Images: Advances and Results in Speech, Estimation, Compression, Recognition, Filtering and Processing (R. Coelho, V. Nascimento, R. Queiroz, J. Romano, and C. Cavalcante, eds.), Boca Raton, Florida: CRC Press, 2015.
- [8] R. Tavares and R. Coelho, “Speech enhancement with nonstationary acoustic noise detection in time domain,” IEEE Signal Processing Letters, vol. 23, no. 1, pp. 6–10, 2016.
- [9] T. Arai, N. Hodoshima, and K. Yasu, “Using steady-state suppression to improve speech intelligibility in reverberant environments for elderly listeners,” IEEE transactions on audio, speech, and language processing, vol. 18, no. 7, pp. 1775–1780, 2010.
- [10] P. N. Petkov and Y. Stylianou, “Adaptive gain control for enhanced speech intelligibility under reverberation,” IEEE Signal Processing Letters, vol. 23, no. 10, pp. 1434–1438, 2016.
- [11] P. Borgnat, P. Flandrin, P. Honeine, C. Richard, and J. Xiao, “Testing stationarity with surrogates: A time-frequency approach,” IEEE Transactions on Signal Processing, vol. 58, no. 7, pp. 3459–3470, 2010.
- [12] K. S. Rhebergen and N. J. Versfeld, “A speech intelligibility index-based approach to predict the speech reception threshold for sentences in fluctuating noise for normal-hearing listeners,” The Journal of the Acoustical Society of America, vol. 117, no. 4, pp. 2181–2192, 2005.
- [13] R. C. Hendriks, J. B. Crespo, J. Jensen, and C. H. Taal, “Optimal near-end speech intelligibility improvement incorporating additive noise and late reverberation under an approximation of the short-time sii,” IEEE/ACM Transactions on Audio, Speech, and Language Processing, vol. 23, no. 5, pp. 851–862, 2015.
- [14] J. Santos, M. Senoussaoui, and T. Falk, “An improved non-intrusive intelligibility metric for noisy and reverberant speech,” in IEEE 14th International Workshop on Acoustic Signal Enhancement, pp. 55–59, 2014.
- [15] M. Jeub, M. Schafer, and P. Vary, “A binaural room impulse response database for the evaluation of dereverberation algorithms,” in IEEE 16th International Conference on Digital Signal Processing, pp. 1–5, 2009.
- [16] J. S. Garofolo, L. F. Lamel, W. M. Fisher, J. G. Fiscus, and D. S. Pallett, “Darpa timit acoustic-phonetic continous speech corpus cd-rom. nist speech disc 1,” NASA STI/Recon technical report n, vol. 93, 1993.
- [17] H. J. Steeneken and F. W. Geurtsen, “Description of the rsg-10 noise database,” report IZF, vol. 3, 1988.
- [18] J. Thiemann, N. Ito, and E. Vincent, “Demand: a collection of multi-channel recordings of acoustic noise in diverse environments,” in Proc. Meetings Acoust., 2013.
- [19] A. S. of America. Standards Secretariat, A. N. S. Institute, A. S. of America, and B. Accredited Standards Committee S3, American National Standard: Methods for Calculation of the Speech Intelligibility Index. Acoustical Society of America, 1997.
- [20] B. Sauert and P. Vary, “Near end listening enhancement: Speech intelligibility improvement in noisy environments,” in 2006 IEEE International Conference on Acoustics Speech and Signal Processing Proceedings, vol. 1, pp. I–I, IEEE, 2006.
- [21] T. H. Falk, C. Zheng, and W.-Y. Chan, “A non-intrusive quality and intelligibility measure of reverberant and dereverberated speech,” IEEE Transactions on Audio, Speech, and Language Processing, vol. 18, no. 7, pp. 1766–1774, 2010.
- [22] S. Ghimire, “Speech intelligibility measurement on the basis of itu-t recommendation p.863,” 2012.
- [23] J. B. Allen and D. A. Berkley, “Image method for efficiently simulating small-room acoustics,” The Journal of the Acoustical Society of America, vol. 65, no. 4, pp. 943–950, 1979.