Structural and magnetic properties of 3d transition metal oxide chains
on the (001) surfaces of Ir and Pt
Abstract
We present a survey of the structural and magnetic properties of submonolayer transition metal dioxides on the (001) surfaces of the heavy face-centered cubic (fcc) noble metals Ir and Pt performed by spin-averaged scanning tunneling microscopy (STM) and spin-polarized (SP-)STM. Our STM results confirm that deposition of Co, Fe, Mn, and Cr on the oxygen-reconstructed Ir(001) surface leads to the formation of quasi one-dimensional chains with a unit cell. As recently predicted by density functional theory [Ferstl et al., Phys. Rev. Lett. 117, 046101 (2016)], our SP-STM images of FeO2 and MnO2 on Ir(001) show a two-fold periodicity along the chains which is characteristic for an antiferromagnetic coupling along the chains. In addition, these two materials also exhibit spontaneous, permanent, and long-range magnetic coupling across the chains. Whereas we find a ferromagnetic inter-chain coupling for FeO2/Ir(001), the magnetic coupling of MnO2 on Ir(001) appears to be a non-collinear spin spiral, resulting in a magnetic unit cell. On Pt(001) patches of -reconstructed oxide chains could only be prepared by transition metal (Co, Fe, and Mn) deposition onto the cold substrate and subsequent annealing in an oxygen atmosphere. Again SP-STM on MnO2/Pt(001) reveals a very large, magnetic unit cell which can tentatively be explained by a commensurate spin spiral. Large scale SP-STM images reveal a long wavelength spin rotation along the MnO2 chain.
pacs:
I Introduction
Significant progress has been achieved towards a thorough understanding of magnetically ordered states in solid-state materials.Vaz et al. (2008) Over the past 40 years spin structures with increasing complexity were detected. Whereas collinear ferro- or antiferromagnetism governed by the competition of exchange, magnetocrystalline anisotropy, and dipolar interactions initially dominated the scientific debate, we have witnessed a focussing on more complex non-collinear magnetic states since the advent of the current century.Braun (2012) This development was—at least partially—made possible by the development of advanced surface analysis and microscopy tools which allow for the detection of magnetic signals with unprecedented sensitivity and spatial resolution. In the context of this contribution spin-polarized scanning tunneling microscopy (SP-STM) will be of particular interest. This technique utilizes the tunnel magnetoresistance effect between a magnetic surface and a spin-polarized tip to obtain information about the sample’s spin structure with atomic resolution.Bode et al. (2003) SP-STM allowed for the first direct imaging of antiferromagnetic surfacesKubetzka et al. (2005) and domain walls,Bode et al. (2006) as well as of frustrated Néel spin states with antiphase domains.Gao et al. (2008) Furthermore, it turned out that the spin-orbit–induced Dzyaloshinskii-Morija interaction (DMI), which has previously considered in some rare cases only, can be very significant at surfaces and interfaces. For example, it turned out that the Mn monolayer on W(110), which has initially been assumed to be a simple collinear and uniaxial antiferromagnet,Bode et al. (2002); Heinze et al. (2000) instead forms chiral spin cycloid.Bode et al. (2007)
Recently a group of novel quasi one-dimensional transition metal oxides (TMO) was discovered which can conveniently be prepared by self-organized growth on the (001) surfaces of the heavy fcc metals Ir and Pt.Ferstl et al. (2016, 2017) For Ni, Co, Fe, and Mn on Ir(001) and also for Co on Pt(001) a structural unit cell was observed by low-energy electron diffraction (LEED). In either case scanning tunneling microscopy (STM) reveals a surface morphology which is characterized by long and highly periodic chains oriented along the and high symmetry directions of the (001) surface. The structure of the TMO chains on fcc(001) surfaces as proposed by Ferstl et al.Ferstl et al. (2016) is schematically represented in Fig. 1.
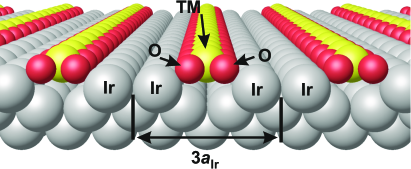
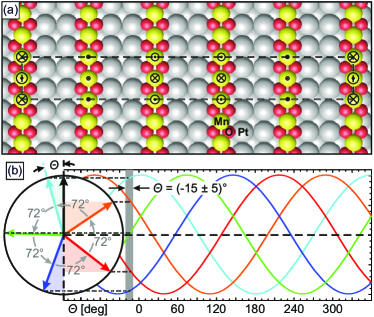
Within each chain we find two oxygen atoms (red) between nearest-neighbor transition metal atoms (yellow). The TMO chains sit above empty substrate rows, held in place by the oxygens atoms.
Indeed, density functional theory (DFT) calculations reproduced the experimentally determined structural properties well.Ferstl et al. (2016) These theoretical investigations also predicted highly interesting intra-chain magnetic couplings, ranging from non-magnetic (NM) NiO2 via ferromagnetic (FM) coupling for CoO2 and FeO2 to an antiferromagnetic (AFM) interaction along MnO2 chains on Ir(001).Ferstl et al. (2016) Furthermore, an AFM coupling was predicted for CoO2 chains on Pt(001).Ferstl et al. (2017) In general, the coupling strength was found to be much stronger along the chains (up to 44 meV per TM atom) than across adjacent chains (a few meV). It should be kept in mind, however, that the calculations performed in Refs. Ferstl et al., 2016 and Ferstl et al., 2017, which are qualitatively summarized in Table 1, were restricted to collinear spin configurations. Non-collinear magnetic structures, such as the Néel state, spin spirals, skyrmions, or helical spins structures, which can potentially arise from frustration,Gao et al. (2008) higher-order exchange,Krönlein et al. (2018); Romming et al. (2018) or the DMIBode et al. (2007) have not been considered.
| substrate | Ir(001) | Pt(001) | |||
|---|---|---|---|---|---|
| TMO chain | NiO2 | CoO2 | FeO2 | MnO2 | CoO2 |
| 0.00 | 1.96 | 3.55 | 3.62 | – | |
| intra-chain coupling () | NM | FM | AFM | AFM | AFM |
| (meV) | – | 25 | 44 | 27 | – |
| inter-chain coupling () | – | FM | AFM | AFM | – |
| (meV) | – | 4 | 9 | 0.4 | – |
To verify the predictions of Ferstl et al.Ferstl et al. (2016, 2017) we recently studied the magnetic structure of MnO2 chains on Ir(001) by means of spin-polarized scanning tunneling microscopy (SP-STM).Schmitt et al. (2019) In addition to the AFM coupling along the chains predicted by Ferstl et al.Ferstl et al. (2016) an indirect magnetic coupling across the chains was observed. This surprising finding was rationalized in terms of an Dzyaloshinskii-Moriya–enhanced Ruderman-Kittel-Kasuya-Yosida (RKKY) interaction.Schmitt et al. (2019) These earlier results obtained on MnO2/Ir(001) showed that this indirect magnetic coupling mechanism which was previously only observed for assemblies of single atoms or clusters on Pt(111) surfacesKhajetoorians et al. (2016); Hermenau et al. (2017) can also result in chiral magnetic order in laterally extended structures.
The purpose of this paper is to investigate the magnetic structure of a broad range of -ordered TMO chains on (001) surfaces of the heavy face-centered cubic (fcc) noble metals Ir and Pt by SP-STM. The paper is organized as follows: The SP-STM technique and the experimental procedures applied for substrate cleaning, oxidation, and transition metal deposition are briefly described in Sect. II. Results for the two substrates, i.e., Ir(001) and Pt(001), will be presented separately in Sect. III.1 and Sect. III.2, respectively. SP-STM measurements were performed on the oxides of Co, Fe, Mn, and Cr on Ir(001) and for Co and Mn on Pt(001). Whereas no magnetic contrast could be detected for Co and Cr, the magnetic intra-chain coupling observed for the other transition metals is in agreement with DFT predictions.Ferstl et al. (2016, 2017) In addition, our results also reveal magnetic ordering across the chains. Whereas we find a collinear coupling across the chains for FeO2 on Ir(001), the indirect inter-chain coupling of MnO2 on both, Ir(001) and Pt(001), is found to be helical, resulting in complex spin structures with surprisingly large magnetic unit cells.
II Experimental procedures
STM experiments were performed in a two-chamber ultra-high vacuum (UHV) system with a base pressure mbar. Clean Ir(001) and Pt(001) surfaces were prepared by annealing cycles in an oxygen atmosphere followed by cycles of sputtering and annealing without oxygen. After this procedure the well known reconstruction of Ir(001) as well as the structural unit cell of Pt(001) was confirmed.Grant (1969); Rhodin and Brodén (1976); Schmidt et al. (2002); Hammer et al. (2016a)
Closely following the procedures described by Ferstl and co-workers,Ferstl et al. (2016) the clean Ir(001) surface was then exposed to molecular oxygen resulting in a -reconstructed surface. The oxygen pressure indicated by our quadrupole mass spectrometer was mbar, but the local pressure is assumed to be about two orders of magnitude higher since the gas nozzle is located just a few cm above the sample surface. On this oxygen-reconstructed Ir surface we deposited one third of a monolayer (ML) of either, Co, Fe, Mn, or Cr. All 3 transition metals were vaporized with commercial e-beam evaporation sources (EFM3). Whereas Co and Fe were evaporated from wires with a diameter of 2 mm, Mn and Cr lumps were loaded into Mo crucibles. Upon transition metal deposition the sample was again annealed in an oxygen atmosphere, resulting in the structure of TMO chains.Ferstl et al. (2016) Since the annealing temperature required for optimal TMO chain quality was found to depend on the transition metal element, the specific values will be given below. Due to the higher stability of the Pt(001) reconstruction to oxygen exposure the preparation of TMO chains on Pt(001) is slightly different.Morgan and Somorjai (1968); Ferstl et al. (2017) Namely, the transition metal was directly evaporated onto the reconstructed surface and only subsequently annealed in an oxygen atmosphere.Ferstl et al. (2017)
To verify the structural properties of the TMO chains the samples were transferred into a home-built low-temperature scanning tunneling microscope (LT-STM) where they were scanned with an electro-chemically etched polycrystalline W tip at an operation temperature of K. All images were obtained in the constant-current mode with bias voltage () applied to the sample. When using spin-polarized tips in SP-STM measurements the recorded tunneling current can be written as
| (1) |
where is the spin-averaged contribution to the tunneling current. The second term in Eq. 1 represents the magnetization direction-dependent variation of the total current which depends on the angle between tip and sample polarization. For SP-STM the W tips were flashed by electron bombardment and coated with either Fe or Cr. To unambiguously determine the in-plane or out-of-plane sensitivity of the magnetic SP-STM tips they were characterized on a reference system. In the present case we used the Fe double-layer (DL) on W(110) which exhibits a well-known inhomogeneous spin spiral, thereby offering the possibility to identify the in-plane and out-of-plane components of the tip magnetization in a single measurement.Pietzsch et al. (2000); Bode et al. (2001); Meckler et al. (2009)
As we will discuss below, we could not obtain magnetic contrast on some TMOs even though earlier DFT calculations predict them to order magnetically. This raises the question of the detection limit of SP-STM. In fact, the surface spin structures of numerous elements have successfully been imaged in the past, including rare-earth metals, such as GdBode et al. (1998) and Dy,Berbil-Bautista et al. (2007) or the antiferromagnetic metal Cr.Ravlić et al. (2003) The Gd magnetic moment is largely carried by the shell (7) which is energetically located well below the Fermi level and therefore cannot contribute to the tunneling current. For Gd(0001) it has been shown that the SP-STM contrast originates from a -like surface state which carries a relatively low magnetic moment only.Kurz et al. (2002) In the case of Cr measurements were performed at room temperature, i.e. at a relatively high reduced temperature (Néel temperature K). At this temperature the magnetic moment only amounts to about 40% of its ground state value. Nevertheless, for both Gd(0001) and for Cr(001) the surface magnetic structure could clearly be imaged. Considering these earlier results we assume that the detection limit of SP-STM is well below a surface moment of .
III Results
III.1 TMO chains on Ir(001)
III.1.1 CoO2/Ir(001)
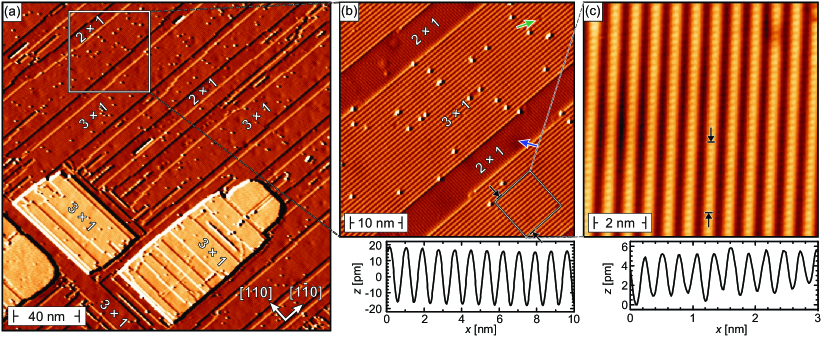
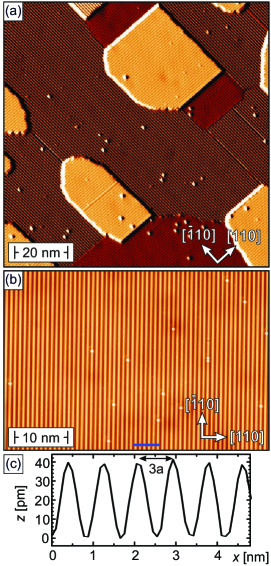
After evaporation of Co onto the oxidized Ir(001) surface at room temperature the sample was annealed at K at an oxygen partial pressure mbar. During the TMO chain growth process every third Ir surface atom is expelled from the surface layer. It has previously observed for MnO2 on Ir(001)Ferstl et al. (2016)Schmitt et al. (2019) that—at sufficiently high annealing temperature—these atoms form extended islands or even recombine at step edges with existing surface terraces. A similar behavior can be observed in Fig. 2(a), where monatomic rectangular shaped islands occur with step edges along the and high-symmetry directions of the substrate.
Closer inspection of the terraces in Fig. 2(b) show the coexistence of the oxygen reconstruction and the TMO structure along the high-symmetry directions. Furthermore, Fig. 2(b) reveals that the stripes of the reconstruction are generally oriented perpendicular to the -ordered CoO2 chains, possibly due to the incommensurability of oxygen-reconstructed and -ordered TMO chains. The presence of oxygen-reconstructed areas without Co possibly indicates that the amount of deposited Co was slightly below one third of a ML. With a density about 0.03 nm-2 the most frequent defects are point-like protrusions on the TMO chains. Their height amounts to about 80 pm, consistent with typical values for transition metal adatoms. Therefore, we assume that these protrusions are caused by either excess Co or Ir atoms which were expelled from the surface layer but remained on the CoO2 chains. Furthermore, a few depressions in the chains can be recognized (one of which is marked by the green arrow). Since these depressions are centered where one would expect a maximum in a periodic chain in the absence of a defect, it appears reasonable to preliminarily assign them to Co vacancies. Both types of defects with similar characteristics will also appear for the other transition metals studied. In addition, we occasionally observe weak circular depressions (see blue arrow) which have also been observed on the bare Ir(001) and are assigned to sub-surface defects.
To verify the structural properties of the CoO2 on Ir(001) we measured a line profile perpendicular to the chains in between the two black arrows in the bottom right corner of the STM image displayed in Fig. 2(b). It is plotted at the bottom of Fig. 2(b). The periodicity of pm agrees well with the expected value of pm.Arblaster (2010) Additionally, the atomic resolution scan shown in Fig. 2(c) and the corresponding line section shown in the bottom panel also confirm the periodicity with an atomic distance of pm along the TMO chains.
After structural analysis we prepared magnetic Cr/W tips and Fe/W tips for SP-STM measurements. As documented in the Supplementary Information, these out-of-plane and in-plane sensitive tips were thoroughly tested by imaging the domain and domain wall structure the Fe DL on W(110), respectively.Sup Although these tests clearly confirmed the magnetic imaging capabilities of our SP-STM tips before and after the measurements on the CoO2 chains on Ir(001), we never observed any magnetic contrast on the structure of CoO2 chains (not shown). This result is not necessarily in contradiction with the ferromagnetic order predicted in Ref. Ferstl et al., 2016 because we have to keep in mind that the imaging of magnetic spin structures by SP-STM relies on the existence of domains or other spatial variations of the projection of the local sample magnetization onto the fixed magnetization of the tip. Therefore, the ferromagnetic domains could remain undetected if their size was much larger than the scan size. In this context future spatially averaging techniques, such as the magneto-optical Kerr effect, might be useful to clarify this open issue.
III.1.2 FeO2/Ir(001)
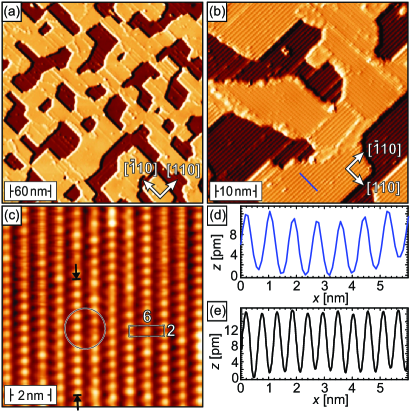
The next transition metal element with one electron less in the shell is Fe. It has been predicted that FeO2 on Ir(001) exhibits an AFM order along the chains.Ferstl et al. (2016) Just like for the preparation of CoO2 chains described in Sect. III.1.1, Fe was evaporated at room temperature on the -reconstructed O/Ir(001) surface and immediately annealed at K in an oxygen atmosphere ( mbar). The overview scan in Fig. 3(a) shows two flat terraces separated by a monatomic substrate step edge. The absence of rectangular islands indicates that all Ir atoms expelled from the substrate had the chance to diffuse to step edges. Close inspection reveals that the chains are oriented along the direction on the upper (left) terrace whereas they are oriented in the direction on the lower (right) terrace. The density of the point-like defects on top of the chains amount to about 0.06 nm-2. Similar to what was discussed in the preceding section III.1.1, we believe that the most likely origin of these protrusions is a slight overdosing of the surface with Fe such that some atoms cannot be accommodated within the resulting Fe oxide chain structure. We would like to note that the teardrop-shaped appearance of the protrusions is an imaging artifact caused by an unusual shape of the tip used in this experiment.
For structural analysis of the FeO2 chains a higher resolution scan on the lower terrace is shown in Fig. 3(b). The periodicity across the chains along the blue line is determined by the line profile shown in Fig. 3(c). Again we find periodicity of pm which is in good agreement with the value expected for a reconstruction, i.e., pm. To complete the structural analysis an atomic resolution scan of FeO2 is presented in Fig. 4(a). Line sections drawn between the black arrows in Fig. 4(a) which are presented in Fig. 4(c) (black lines) show a periodicity of pm, consistent with the Ir lattice constant pm. Furthermore, an additional weak stripe in the center of the unit cell in Fig. 4(a) can be recognized in between the chains. A similar observation was reported by Ferstl et al.Ferstl et al. (2016) and assigned to an electronic signal of the Ir double-rows separating adjacent TMO chains.
The magnetic structure of this surface was investigated by SP-STM with an out-of-plane sensitive Cr-coated W tip. The result is presented in Fig. 4(b). Direct comparison with Fig. 4(a) reveals a doubled period along the chains. This impression is corroborated by the line profiles presented in Fig. 4(c) which have been taken in between the three pairs of colored arrows and clearly show a period pm along the chains. The doubling is caused by the magnetoresistance effect which leads to a tunneling current which scales with the projection of the sample magnetization onto the tip magnetization (cf. Eq. 1). The most obvious explanation for the observed doubling of the period along the chain is an AFM coupling. Furthermore, the maxima and minima of adjacent FeO2 chains in Fig. 4(b,c) are aligned, thereby clearly indicating a FM coupling across the chains. The fact that all magnetic line profiles show the same corrugation essentially excludes any non-collinear magnetic order, such as spin spirals or frustrated Néel spin states, but rather supports that FeO2/Ir(001) exhibits collinear magnetism.
Our experimental results obtained on FeO2 chains on Ir(001) indicate a magnetic unit cell which is marked as a box in Fig. 4(b) and schematically illustrated in Fig. 4(d). The AFM coupling observed along the chains is in agreement with recent theoretical predictions.Ferstl et al. (2016) To our opinion it is quite reasonable to assume that this AFM along the chains is caused by superexchange mediated by the fully occupied oxygen orbitals.Anderson (1950) Although a much weaker AFM coupling across the chains was predicted in Ref. Ferstl et al., 2016, we experimentally observe spontaneous, permanent, and long-range FM inter-chain coupling at K. At the moment we can only speculate why theory and experiment deviate. Since adjacent TMO chains are separated by two non-magnetic Ir rows this order cannot be mediated by direct exchange. As we will point out below for MnO2 chains on Ir(001), it appears that the strong spin-orbit interaction of the Ir substrate plays a decisive role for the formation of the magnetic ground state. Potentially, similar effects are also relevant for FeO2/Ir(001). More advanced theoretical considerations will be necessary to fully elucidate the coupling mechanism.
III.1.3 MnO2/Ir(001)
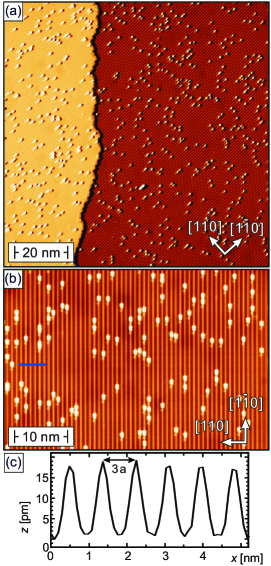
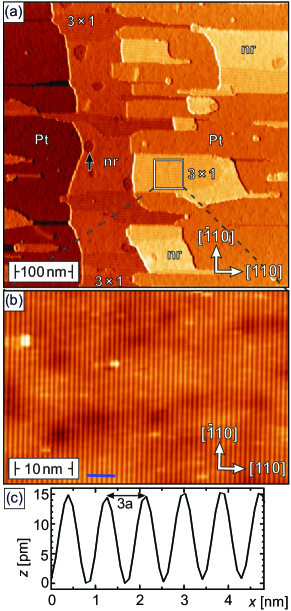
Our SP-STM results presented in the preceding section were in good agreement with DFT predictions regarding the intra-chain magnetic coupling,Ferstl et al. (2016) but also indicate that some aspect of the inter-chain coupling may not have been captured with sufficient accuracy. Since DFT qualitatively predicts the same intra-chain magnetic coupling for MnO2/Ir(001) as for FeO2 it is highly interesting to experimentally investigate also this sample system. The preparation of MnO2 chains is very similar to the TMOs discussed so far. Also in this case Mn is deposited onto the oxidized Ir(001) surface at room temperature. To our experience the best surface quality can be achieved when choosing a slightly higher annealing temperature K. This results in a sample topography with roughly rectangular islands, as exemplarily presented in the overview scan of Fig. 5(a). The -ordered MnO2 chain structure covers almost the entire sample surface such that no regions with the oxygen-induced reconstruction of Ir(001) remain visible. Typical domains are about 20 to 40 nm wide and often hundreds of nm long. Adjacent domains are separated by either orientational and anti-phase domain boundaries.
Similar to other TMO chains on Ir(001) we observe several defects which are located on top of the chains. For example, in Fig. 5(b) 12 single protrusions, one dimer, a vacancy in a MnO2 row can be recognized. This corresponds to a defect density of only 0.015 nm-2, well below what has been determined for CoO2 and FeO2 in Sect. III.1.1 and III.1.2, respectively. The periodicity of the stripes can be determined by the line profile presented in Fig. 5(c). In agreement with the expected structure it amounts to pm.
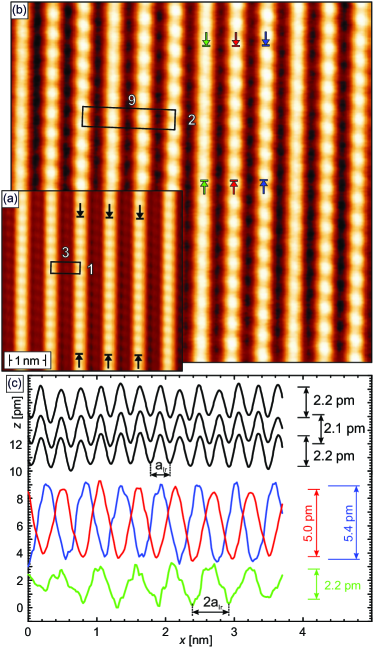
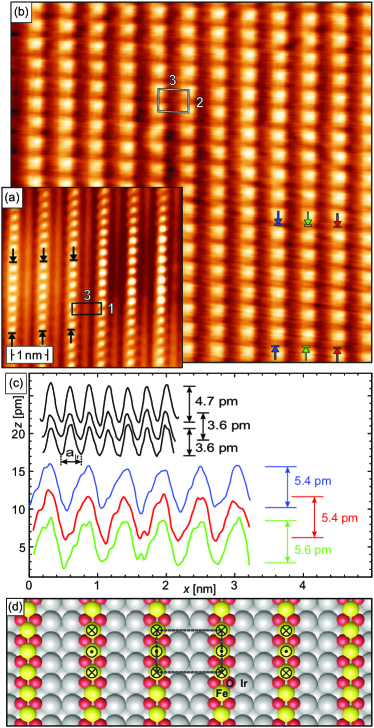
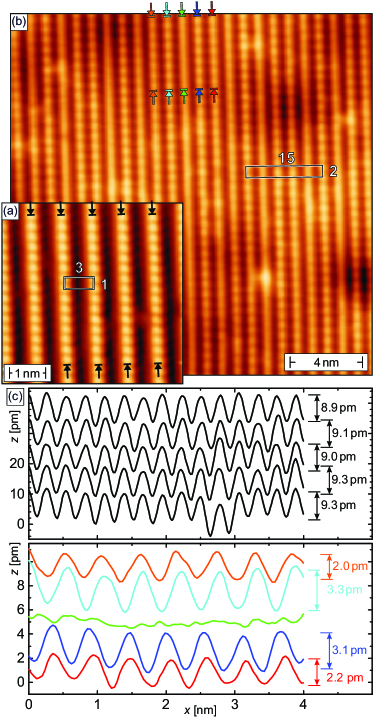
As shown in Fig. 6(a) this superstructure has been imaged with atomic resolution in a spin-averaging STM experiments by using a non-magnetic W tip. The corrugation and periodicity along the chains in Fig. 6(a) can be determined from the line profiles presented in Fig. 6(c) (black lines). These data sets clearly show that any chains exhibits a corrugation of pm only and a periodicity of pm. In addition, Fig. 6(a) also reveals a small corrugation in between the chains which can possibly be assigned to Ir pairs.
In Fig. 6(b) we present spin-polarized measurements of MnO2 chains on Ir(001) which were performed with an in-plane sensitive magnetic Cr/W tip. We would like to note that these results, which were obtained in a different experimental run on a newly prepared sample with a different SP-STM tip, qualitatively reproduce earlier results.Schmitt et al. (2019) Quantitative differences, such as a different corrugation, are attributed to the fact that the two tips probably differ in their spin polarization and quantization axes. Similar to the results on FeO2 discussed in Sect. III.1.2 the use of a magnetic probe tip leads to a doubling of the measured corrugation period which now corresponds to along the chains. Furthermore, comparison of adjacent chains reveals a periodic variation of the corrugation. This can qualitatively be realized by comparing the chain marked with red arrows in Fig. 6(b) with the chains on the left and right which are marked green and blue, respectively. The green chain on the left obviously exhibits a much weaker corrugation. In contrast, no obvious difference between the contrast strength of the red and blue line can be recognized, but the positions of maxima and minima of the chain marked with blue arrows are interchanged with respect to the red line.
The colored line profiles presented in Fig. 6(c) allow for a more quantitative comparison. In agreement to our qualitative assessment the green chain exhibit the smallest corrugation of pm whereas both, the blue and red line have a much higher corrugation of about 5 pm. In addition, we can also recognize the phase shift of between the red and blue line. Detailed comparison shows that the blue chain has a slightly higher corrugation than the red chain. Together with the above-mentioned periodicity along the chains these SP-STM observations suggest a magnetic unit cell.
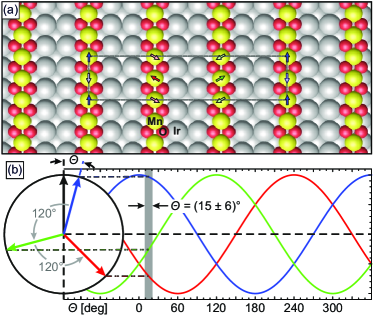
The experimental observations on MnO2 chains can be explained by a spin structure as schematically illustrated in Fig. 7(a). Each MnO2 chain is AFM ordered whereby the easy axis always lies within the surface plane. The azimuthal orientation rotates by between adjacent MnO2 chains such that the magnetic structure repeats every third chain. These two ingredients, i.e., the AFM order along and the tripled magnetic period perpendicular to the MnO2 chains, result in a magnetic unit cell as indicated in Fig. 6(b). As sketched in Fig. 7(b), this magnetic structure can explain the corrugation and the phase relation observed by SP-STM in Fig. 6(b,c). In this representation the black arrow represents the tip magnetization and the colored arrows represent the quantization axes of the respective chains.
Proceeding from right to left in the magnetic unit cell in Fig. 7(a) we can recognize that the magnetic structure is governed by an in-plane counterclockwise spin spiral with a rotation angle of between adjacent chains. Since the blue arrow exhibits the largest projection onto the black arrow it will—according to Eq. 1—give the strongest magnetic contrast in SP-STM measurements, symbolized by the dot-dashed line in Fig. 7(a). As a result of the spin spiral the green and red arrows are aligned antiparallel with respect to the tip. In case of an AFM intra-chain coupling this will unavoidably lead to a phase shift between the blue spin chain as compared to the green and red spin chain. Based on this representation we can nicely reproduce the corrugations extracted from Fig. 6(c) by an angle between the blue chain and the tip polarization of , indicated by a grey region in Fig. 7(b).
In a recently published paper the observation of a chiral spin spiral which is mediated across two atomic rows of the non-magnetic Ir(001) substrate was explained by a Dzyaloshinskii-Moriya type (DM) enhancement of the RKKY interaction.Schmitt et al. (2019) This interaction, which has already been predicted in 1980Fert and Levy (1980), leads to a magnetic coupling which is at the same time indirect and chiral. Evidence for DM-enhanced indirect magnetic coupling had previously been observed on some surface-deposited clustersDupé et al. (2015); Khajetoorians et al. (2016); Bouaziz et al. (2017); Hermenau et al. (2017) and Dy/Y superlattices.Grigoriev et al. (2008) Indeed, state-of-the-art density functional theory calculations could successfully reproduce not only the antiferromagnetic coupling along the chains but also explain the period of the chiral magnetic structure across the chains.Schmitt et al. (2019) However, the experimental data suggest a spin spiral which predominantly rotates within the surface plane, corresponding to a Dzyaloshinskii-Moriya vector oriented along the surface normal. This surprising result cannot be explained within the structural model deduced from quantitative low-energy electron diffraction data,Ferstl et al. (2016) which would result in a vector within the surface. The discrepancy might be caused by yet unconsidered effects of structural domain boundaries or relaxation effects. Additional DFT calculations and field-dependent SP-STM measurements will be necessary to fully resolve this open question.
III.1.4 CrO2/Ir(001)
Motivated by the observation of an unexpected non-collinear magnetism in -ordered MnO2 chains on Ir(001) we tried to extent the series of self-organized TMO chains to Cr which is the left neighbor of Mn in the periodic table of elements. Since the growth of CrO2 chains was not part of the study by Ferstl et al.Ferstl et al. (2016) it will be discussed here in detail. The preparation follows the principle of the known TMO chains and comprises the evaporation of Cr onto the O/Ir(001) surface at room temperature. Subsequently, the sample was annealed in an oxygen atmosphere ( mbar) at a temperature K.
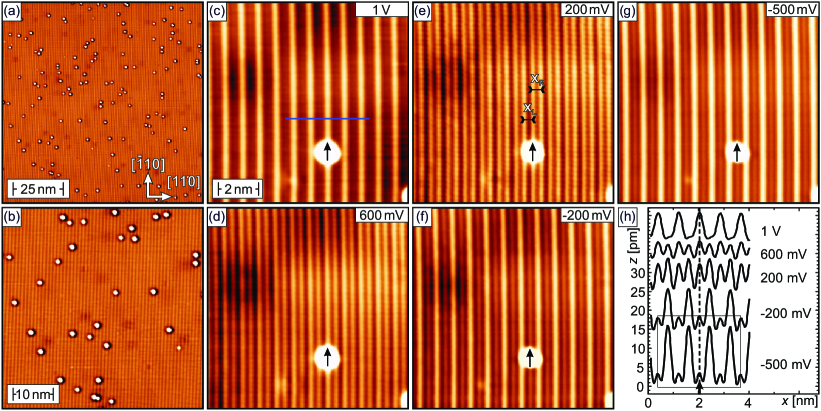
The resulting sample topography and its structural analysis are shown in Fig. 8. Already in the overview scan presented in Fig. 8(a) we can recognize stripes orientated along the direction. We count 145 point-like defects with a typical height of several 10 up to 100 pm on top of the stripes, corresponding to a defect density below 0.015 per nm2. Moreover, some protrusions are visible that we already identified on clean reconstructed Ir(001) surfaces. The periodic arrangement of the stripes with an inter-stripe distance of pm is shown at higher resolution in Fig. 8(b). This value is comparable to the inter-chain distance observed on the other quasi one-dimensional TMO systems and consistent with the structural unit cell.
To study the electronic properties of this stripe pattern we performed the bias-dependent measurements presented in Fig. 8(c)–(f). All scans show the same sample area as can be recognized by the cluster of unknown origin. An arrow marks the central region of this cluster and serves as a reference point during the following comparison. At a bias voltage V, Fig. 8(c), the arrow is aligned with the top of a stripe (A-stripe). The next stripe to the right can be found about 1 nm apart just right of the bright cluster. When the bias voltage is reduced to mV, Fig. 8(d), another stripe (B-stripe) appears between the A-stripes. Interestingly, the corrugation is not mirror symmetric with respect to the plane defined by the direction, i.e., along the stripes, and the (001) surface normal. This can best be recognized in the line sections shown in Fig. 8(h). The data have been extracted from the images shown in Fig. 8(c)–(f) along traces corresponding to the blue line in panel (c). Again the arrow (and the hatched line) indicates the central position of the bright cluster. At mV the two minima left and right of the hatched line clearly exhibit different depth, with the left minimum being about 1 pm deeper than the right minimum. This trend becomes even stronger as the bias voltage is changed to meV. Furthermore, when decreasing the bias voltage further to meV, Fig. 8(f), and meV, Fig. 8(g), we observe that the corrugation of the B-stripes becomes much larger than that of the A-stripes. For example, at meV the corrugation of B-stripes reaches pm, whereas the corrugation of the A-stripes only amounts to pm.
Our bias-dependent experimental results on CrO2/Ir(001) are strikingly different as compared to similar results on the other TMO chains. We find an asymmetric corrugation and A- and B-stripes which are the dominant features in topographic STM measurements performed at meV and meV, respectively. Furthermore, the change in corrugation is more pronounced for B-stripes. Combined with the fact that the B-stripes almost vanish for V we suppose that A-stripes correspond to the CrO2 chains whereas the B-stripes are assigned to the intermediate Ir double row. As detailed in Ref. Sup, we performed SP-STM experiments on CrO2/Ir(001) with both, out-of-plane sensitive Cr/W and in-plane sensitive Fe/W tips. These measurements confirmed the structural unit cell of the CrO2 chains but did not provide any hint of a magnetically ordered state.
III.2 TMO chains on Pt(001)
III.2.1 CoO2/Pt(001)
Our SP-STM experiments of TMO chains on Ir(001) presented so far revealed a wide variety of spin structures. Whereas we could not detect any magnetic signal on CoO2 chains, suggesting a non-magnetic state, for other elements we found collinear (anti)ferromagnetic (Fe) and a helical spin spiral order (Mn). It appears to be an obvious idea to extend the search for similar indirect DM-enhanced RKKY interactions by growing TMO chains on other heavy noble metals which also crystallize in the fcc structure. One candidate material is Pt, the direct neighbor of Ir in the periodic table of elements. In fact, it has already been shown that CoO2 chains can be grown by similar procedures on Pt(001).Ferstl et al. (2017)
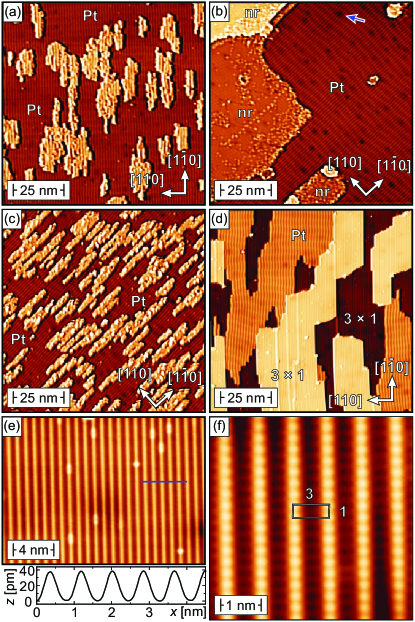
Since the Pt(001) reconstruction is stable against oxidation we first studied the growth of Co on the clean surface.Ferstl et al. (2017) In our STM images the complex hexagonal reconstructions of clean Pt(001) shows up as stripes with a periodicity of nm.Hammer et al. (2016b) Fig. 9(a) shows the topography of a sample prepared by Co evaporation onto the warm surface resulting in the formation of pm high islands which are elongated along the direction. This orientation correlates with the stripe direction of the Pt(001) surface and indicates preferential diffusion along the trenches of the reconstruction.
Annealing this sample in an oxygen atmosphere ( mbar) at temperature K results in the topography shown in Fig. 9(b). Two surface areas can be distinguished in these data which were measured with non-magnetic W tips. In the upper right of Fig. 9(b) we again recognize the clean Pt(001) surface which—similar to our observations on clean Ir(001) [cf. blue arrow in Fig. 9(b)]—exhibits occasional circular depressions (density nm-2). The persistence of this reconstruction confirms the stability of the Pt(001) surface against oxidation. The remaining part of the surface is covered by islands without any oxygen-induced reconstruction (nr). Together with the unusual step height of pm we interpret this as evidence for the formation of a CoPt surface alloy.
In a second attempt we initially cooled the clean Pt(001) surface in the LT-STM down to K. Subsequently the crystal was transferred to the preparation chamber for Co deposition onto the cold surface. Comparison of the resulting surface topography, Fig. 9(c), with the Co film grown at elevated temperature, Fig. 9(a), shows that low-temperature growth leads to smaller Co islands and the nucleation of very few second layer Co islands. In contrast to the Co islands shown in Fig. 9(a) these low-temperature–deposited islands exhibit no stripes. Annealing this sample at the same parameters, K, leads to the topography presented in Fig. 9(d), which is comparable to the earlier results of Ref. Ferstl et al., 2017. We can distinguish areas of reconstructed clean Pt(001) from extended and well-ordered regions showing the structure which is characteristic for CoO2 chains. The step height between domains of the same structure amounts to pm, in perfect agreement with the value expected for Pt(001). To complete the structural analysis we performed a higher resolution scan which are presented in Fig. 9(e). Again point-like defects are located on the stripes. The line profile taken at the position of the blue line confirms the periodicity of pm. The inner structure of the stripes can be resolved by the atomic resolution image shown in Fig. 9(f). Along the chains we measure a periodicity of pm which agrees well with the cubic lattice vector expected for Pt, pm.Morgan and Somorjai (1968)
After confirmation of the structure of CoO2 chains on Pt(001)Ferstl et al. (2017) we attempted to resolve the spin or magnetic domain structure by means of SP-STM experiments using out-of-plane and in-plane polarized tips. However, these magnetically sensitive experimentsSup showed neither a hint of the theoretically proposed AFM structureFerstl et al. (2017) nor could we detect any hint of other magnetically ordered states.
III.2.2 FeO2/Pt(001)
For the preparation of FeO2 chains on Pt(001) we followed the same procedure as for Co, i.e., we started with the growth of Fe on the clean reconstructed Pt(001) surface. Indeed, Fe evaporation onto the warm Pt(001) substrate leads to a surface morphology very similar to Co/Pt(001) [cf. 9(a,b), results for Fe not shown here] which we interpret as evidence for alloying with the substrate. To overcome this issue Fe was evaporated onto the cold sample and immediately oxidized at K. The resulting topography which is presented in the overview scan of Fig. 10(a) (scan size: nm nm) shows plateaus and valleys with a typical lateral size of about 50 nm. They are separated by pm high step edges preferentially oriented along high symmetry directions of the substrate. Scanning a similar surface area at higher resolution, Fig. 10(b), reveals a stripe pattern with a periodicity of pm, as determined from the line profile in Fig. 10(d), in agreement with the reconstruction expected for FeO2 chains on Pt(001). Regions with stripes oriented in the or the directions can be recognized.
Surprisingly, atomic scale images performed with non-magnetic tips within a single domain are inconsistent with the expected structural unit cell. This can clearly be recognized by the image presented in Fig. 10(c) and the line section shown Fig. 10(e) which was measured in between the two black arrows. The periodicity extracted from this line profile along the chains amounts to pm. This value is in good agreement with twice the lattice constant of Pt, . Furthermore, the maxima of adjacent stripes are out of phase in most cases. Therefore, our spin-averaged experimental data suggest the existence of a unit cell for the oxidized Fe on Pt(001) [see white box in Fig. 10(c)]. Since the positions of maxima and minima in a given chain are not completely static but slowly fluctuate, occasional exceptions from this rule can be observed. For example, the chain in the right part of the white circle in Fig. 10(c) shows such a switching event. Whereas the two chains marked by the circle are in phase in the lower part of the image, a phase shifts by in the right chain causes that the two chains are out of phase in the upper part of the image. Since the measurement of Fig. 10(c) was executed with a non-magnetic tip and since the use of out-of-plane or in plane sensitive magnetic probe tips didn’t result in any additional contrast, we have to conclude that the observed reconstruction has no magnetic but either a structural or an electronic origin. One possible explanation could be a Peierls instability due to a metal–isolator transition at low temperatures.van Houselt et al. (2008) Further investigations are required to figure out the origin of the iron oxide phase.
III.2.3 MnO2/Pt(001)
Finally we investigated MnO2 chains on Pt(001). In a first attempt we evaporated Mn while the Pt(001) substrate was held at room temperature and subsequently oxidized the sample at an oxygen pressure mbar at K. Unfortunately, this preparation procedure resulted in very small TMO domains with size of nm only. In order to improve surface homogeneity we reduced the oxygen pressure to mbar. The resulting topography measured with a non-magnetic W tip is shown in Fig. 11(a). A significant fraction of the surface still exhibits the familiar reconstruction of the clean Pt(001) surface. In addition, two other kinds of surfaces could be identified. The first one no longer shows any reconstruction (not reconstructed; nr) but is relatively rough. Similar findings have been reported for Cu/Ir(001) and were assigned to alloying.Gilarowski et al. (2000) Second, we found -reconstructed areas of MnO2. For structural determination a higher resolution scan measured on a homogeneously striped domain is shown in Fig. 11(b). Adjacent stripes are separated by pm, as determined from the corresponding line profile in Fig. 11(c). We would like to emphasize that this particular structural domain exhibits a lateral size well above 50 nm, thereby allowing for the clear identification even of large magnetic unit cells. Moreover the surface exhibits very few defects.
To exclude a behaviour similar to what we have observed on oxidized Fe on Pt(001) we performed a detailed analysis of the observed contrasts. For example, line profiles measured along the chains marked with black arrows in Fig. 12(a) are presented in the upper part of Fig. 12(c). With a corrugation between and pm and an atomic spacing of pm the data are in good agreement with a structure of MnO2 chains.
Such a sample surface was investigated by means of SP-STM using out-of-plane sensitive Cr-coated W tips. The resulting SP-STM image presented in Fig. 12(b) exhibits striking similarities if compared with the results obtained on MnO2 chains on Ir(001) [cf. Fig. 6(b)]. To analyze the spin-polarized measurement five line profiles which have been taken in between the colored arrows are plotted in the lower part of Fig. 12(c). Comparison with the spin-averaged data (black) reveals that—identical to our results obtained on MnO2/Ir(001)—a doubling of the period along the chains can be recognized. This is a clear sign for an AFM intra-chain coupling of the Mn atoms. In further analogy to the spin spiral system of MnO2 on Ir(001) the magnetic corrugation measured on the respective chains for MnO2/Pt(001) is not constant but modulates periodically. For example, the line profiles clearly show that the green chain exhibits the lowest, almost vanishing corrugation. The other four chains constitute two groups which can be distinguished on the basis of the phase of their magnetic contrast. Whenever the two upper colored line profiles (orange, light blue) exhibit a maximum, the lower line profiles (red, dark blue) show a minimum. Since all line profiles possess a periodicity due to their AFM order along the chains, the phase difference shifts the magnetic contrast by .
This behaviour can be explained by the model illustrated in Fig. 13(a). The coupling along the chains is assumed to be collinear AFM within each individual MnO2 chain. We initially assume a periodic modulation by a commensurate magnetic unit cell where the spin quantization axis of adjacent stripes rotates by . Due to the dependence of the spin-polarized current on the angle between the tip magnetization and the spin quantization axis of the Mn atoms described by Eq. 1 this leads to a characteristic behavior of the magnetic corrugation. It is highest for the TMO chains which exhibit the highest projection onto the tip magnetization vector symbolized by a black arrow in Fig. 13(b), i.e., the light and dark blue chains. Their opposite perpendicular orientations will result in a phase shift. A lower magnetic corrugation can be expected for the chains symbolized by orange and red arrows. The corrugation vanishes if the spin quantization axis of a chain is perpendicular to the tip polarization (green arrow). As a consequence of this rotating spin structure two chains will exhibit a parallel (light blue, orange) and two an antiparallel (blue, red) alignment with respect to the tip, thereby explaining the phase shift of observed in Fig. 12(b). On the basis of this model we are able to determine the angle between the magnetization direction of the tip and the light blue MnO2 chain to .
SP-STM data measured with an in-plane sensitive Fe-coated W tip across a structural domain boundary indicate that the spin spiral possesses in-plane and out-of-plane contributions to the magnetization. Sup A similar spin spiral driven by the Dzyaloshinskii-Moriya interaction has already been found by DFT calculations for MnO2 chains on Ir(001).Schmitt et al. (2019) In agreement with the so-called Moriya rulesMoriya (1960) it is most natural to assume a cycloidal spin spiral with a Dzyaloshinskii-Moriya vector oriented along the chain direction. While the DMI is expected to be very similar for Ir and Pt due to their very similar atomic number, the higher occupation of the Pt shell causes significant differences in the respective Fermi surfaces. Indeed, it has been found that the RKKY-mediated oscillation period for (001)-oriented magnetic superlattices is about 50% longer for Co/PtMoritz et al. (2004) than for Fe/Ir,Stoeffler (2004) in reasonable agreement with our observation of a periodicity which is also about 1.5 times as long.
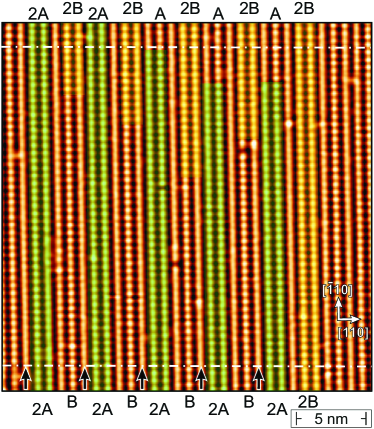
As we will show below deviations from the magnetic unit cell can be detected by imaging MnO2 chains on Pt(001) over larger surface areas. For example, Fig. 14 shows an SP-STM image with a scan area of 30 nm 30 nm. For better visibility, the data set was filtered by using a band pass. As described above SP-STM images of the MnO2/Pt(001) magnetic unit cell are characterized by five-fold periodicity of the structural unit cell. In general, the magnetization direction-dependent variation of the total current gives rise to corrugation maxima if tip and sample are magnetized in the same direction, corrugation minima for an antiparrallel alignment, or a very low or even vanishing corrugation if the angle between the tip and sample magnetization direction is close to 90∘ (cf. Eq. 1). At the -position marked by a dash-dotted white line at the bottom of Fig. 14 we find a sequence consisting of two MnO2 chains which exhibit corrugation maxima (colored green, labelled 2A), then one chain with a low contrast, one MnO2 chains with corrugation minima (B), and finally a chain with no recognizable spin contrast (marked by black arrows). Close inspection of the data set presented in Fig. 14 reveals that the contrast of the specific MnO2 chains is not constant but slowly varies. For example, the MnO2 chains marked by black arrows which showed a vanishingly low magnetic contrast at the bottom of Fig. 14 develop a sizable magnetic contrast towards the top part of the scan. This observation indicates that the magnetic order along the MnO2 chains is not strictly collinear but slightly canted. Within our field of view of 30 nm along the direction, however, we only observe about a quarter of a rotation. Therefore, we can conclude that the wavelength of the magnetic structure along the MnO2 chains on Pt(001) must be very long, probably of the order of 100 nm.
As a result of the spin rotation along the MnO2 chains and the existence of occasional structural defects the magnetic order is not strictly periodic. In fact, comparison of the bottom part of the SP-STM image with the top part of Fig. 14 reveals that the contrast changed. Whereas the sequence of contrasts obtained within the five TMO chains of a magnetic unit cell was 2A-low-B-low in the bottom part, the dominating sequence in the upper part is A-low-2B-low. At the moment we can only speculate about the origin of this non-collinearity along the chains. Possibly, DM-type interactions triggered by the overlap of the O with Ir orbitals also influence the superexchange along the TMO chains.
IV Conclusion
In summary, we systematically investigated the structural and magnetic properties of transition metal oxides (TMOs) on the fcc(001) surfaces of Ir and Pt. We find that Co, Fe, and Mn form quasi one-dimensional TMO chains with a unit cell. Similar -ordered chains were observed for Cr on Ir(001). Whereas no magnetic signal was found for Co- and Cr-based chains, our SP-STM measurements confirm the theoretically predicted antiferromagnetic intra-chain coupling for FeO2/Ir(001) and for MnO2 chains on both substrates. A ferromagnetic inter-chain coupling is found for FeO2/Ir(001). In the case of MnO2 the SP-STM images reveal a complex helical intra-chain magnetic coupling, resulting in a magnetic unit cell on Ir(001) and a magnetic unit cell for Pt(001). Furthermore, large scale SP-STM images of MnO2 chains on Pt(001) unveil that also the intra-chain magnetic coupling is not perfectly collinear but slightly canted, resulting in a spin spiral with a periodicity corresponding to several hundreds of substrate atoms. Our results highlight the relevance of spin-orbit–related effects for magnetic coupling phenomena in systems with broken inversion symmetry, such as surfaces or nanoparticles.
Acknowledgments
Experimental work was supported by DFG through FOR 1700 (project E6), SPP 2137 “Skyrmionics” (BO 1468/26-1) and by the Dresden-Würzburg Center for Topological Quantum Matter Research (ct.qmat).. The authors would like to thank Paolo Moras (Trieste, Italy) for bringing one-dimensional TMOs to our attention and Jens Kügel (Würzburg, Germany) for critically reading the manuscript.
References
- Vaz et al. (2008) C. A. F. Vaz, J. A. C. Bland, and G. Lauhoff, “Magnetism in ultrathin film structures,” Reports on Progress in Physics 71, 056501 (2008).
- Braun (2012) H.-B. Braun, “Topological effects in nanomagnetism: from superparamagnetism to chiral quantum solitons,” Advances in Physics 61, 1 (2012).
- Bode (2003) M. Bode, “Spin-polarized scanning tunnelling microscopy,” Reports on Progress in Physics 66, 523 (2003).
- Kubetzka et al. (2005) A. Kubetzka, P. Ferriani, M. Bode, S. Heinze, G. Bihlmayer, K. von Bergmann, O. Pietzsch, S. Blügel, and R. Wiesendanger, “Revealing antiferromagnetic order of the Fe monolayer on W(001): Spin-polarized scanning tunneling microscopy and first-principles calculations,” Phys. Rev. Lett. 94, 087204 (2005).
- Bode et al. (2006) M. Bode, E. Y. Vedmedenko, K. von Bergmann, A. Kubetzka, P. Ferriani, S. Heinze, and R. Wiesendanger, “Atomic spin structure of antiferromagnetic domain walls,” Nature Materials 5, 477 (2006).
- Gao et al. (2008) C. L. Gao, W. Wulfhekel, and J. Kirschner, “Revealing the antiferromagnetic Néel structure in real space: One monolayer Mn on Ag(111),” Phys. Rev. Lett. 101, 267205 (2008).
- Bode et al. (2002) M. Bode, S. Heinze, A. Kubetzka, O. Pietzsch, M. Hennefarth, M. Getzlaff, R. Wiesendanger, X. Nie, G. Bihlmayer, and S. Blügel, “Structural, electronic, and magnetic properties of a Mn monolayer on W(110),” Phys. Rev. B 66, 014425 (2002).
- Heinze et al. (2000) S. Heinze, M. Bode, A. Kubetzka, O. Pietzsch, X. Nie, S. Blügel, and R. Wiesendanger, “Real-space imaging of two-dimensional antiferromagnetism on the atomic scale,” Science 288, 1805 (2000).
- Bode et al. (2007) M. Bode, M. Heide, K. von Bergmann, P. Ferriani, S. Heinze, G. Bihlmayer, A. Kubetzka, O. Pietzsch, S. Blügel, and R. Wiesendanger, “Chiral magnetic order at surfaces driven by inversion asymmetry,” Nature 447, 190 (2007).
- Ferstl et al. (2016) P. Ferstl, L. Hammer, C. Sobel, M. Gubo, K. Heinz, M. A. Schneider, F. Mittendorfer, and J. Redinger, “Self-organized growth, structure, and magnetism of monatomic transition-metal oxide chains,” Phys. Rev. Lett. 117, 046101 (2016).
- Ferstl et al. (2017) P. Ferstl, F. Mittendorfer, J. Redinger, M. A. Schneider, and L. Hammer, “Monatomic Co, CoO2, and CoO3 nanowires on Ir(100) and Pt(100) surfaces: Formation, structure, and energetics,” Phys. Rev. B 96, 085407 (2017).
- Krönlein et al. (2018) A. Krönlein, M. Schmitt, M. Hoffmann, J. Kemmer, N. Seubert, M. Vogt, J. Küspert, M. Böhme, B. Alonazi, J. Kügel, H. A. Albrithen, M. Bode, G. Bihlmayer, and S. Blügel, “Magnetic ground state stabilized by three-site interactions: ,” Phys. Rev. Lett. 120, 207202 (2018).
- Romming et al. (2018) N. Romming, H. Pralow, A. Kubetzka, M. Hoffmann, S. von Malottki, S. Meyer, B. Dupé, R. Wiesendanger, K. von Bergmann, and S. Heinze, “Competition of Dzyaloshinskii-Moriya and higher-order exchange interactions in Rh/Fe atomic bilayers on Ir(111),” Phys. Rev. Lett. 120, 207201 (2018).
- Schmitt et al. (2019) M. Schmitt, P. Moras, G. Bihlmayer, R. Cotsakis, M. Vogt, J. Kemmer, A. Belabbes, P. M. Sheverdyaeva, A. K. Kundu, C. Carbone, S. Blügel, and M. Bode, “Indirect chiral magnetic exchange through Dzyaloshinskii-Moriya-enhanced RKKY interactions in manganese oxide chains on Ir(100),” Nature Communications 10, 2610 (2019).
- Khajetoorians et al. (2016) A. A. Khajetoorians, M. Steinbrecher, M. Ternes, M. Bouhassoune, M. dos Santos Dias, S. Lounis, J. Wiebe, and R. Wiesendanger, “Tailoring the chiral magnetic interaction between two individual atoms,” Nature Communications 7, 10620 (2016).
- Hermenau et al. (2017) J. Hermenau, J. Ibañez-Azpiroz, C. Hübner, A. Sonntag, B. Baxevanis, K. T. Ton, M. Steinbrecher, A. A. Khajetoorians, M. dos Santos Dias, S. Blügel, R. Wiesendanger, S. Lounis, and J. Wiebe, “A gateway towards non-collinear spin processing using three-atom magnets with strong substrate coupling,” Nature Communications 8, 642 (2017).
- Grant (1969) J. T. Grant, “A LEED study of the Ir(100) surface,” Surface Science 18, 228 (1969).
- Rhodin and Brodén (1976) T. N. Rhodin and G. Brodén, “Preparation and chemisorptive properties of the clean normal and reconstructed surfaces of Ir(100): role of multiplets,” Surface Science 60, 466 (1976).
- Schmidt et al. (2002) A. Schmidt, W. Meier, L. Hammer, and K. Heinz, “Deep-going reconstruction of Ir(100)-,” Journal of Physics: Condensed Matter 14, 12353 (2002).
- Hammer et al. (2016a) R. Hammer, K. Meinel, O. Krahn, and W. Widdra, “Surface reconstruction of Pt(001) quantitatively revisited,” Phys. Rev. B 94, 195406 (2016a).
- Morgan and Somorjai (1968) A. E. Morgan and G. A. Somorjai, “Low energy electron diffraction studies of gas adsorption on the platinum (100) single crystal surface,” Surface Science 12, 405 (1968).
- Pietzsch et al. (2000) O. Pietzsch, A. Kubetzka, M. Bode, and R. Wiesendanger, “Real-space observation of dipolar antiferromagnetism in magnetic nanowires by spin-polarized scanning tunneling spectroscopy,” Phys. Rev. Lett. 84, 5212 (2000).
- Bode et al. (2001) M. Bode, O. Pietzsch, A. Kubetzka, S. Heinze, and R. Wiesendanger, “Experimental evidence for intra-atomic noncollinear magnetism at thin film probe tips,” Phys. Rev. Lett. 86, 2142–2145 (2001).
- Meckler et al. (2009) S. Meckler, N. Mikuszeit, A. Preßler, E. Y. Vedmedenko, O. Pietzsch, and R. Wiesendanger, “Real-space observation of a right-rotating inhomogeneous cycloidal spin spiral by spin-polarized scanning tunneling microscopy in a triple axes vector magnet,” Phys. Rev. Lett. 103, 157201 (2009).
- Bode et al. (1998) M. Bode, M. Getzlaff, and R. Wiesendanger, “Spin-polarized vacuum tunneling into the exchange-split surface state of Gd(0001),” Phys. Rev. Lett. 81, 4256–4259 (1998).
- Berbil-Bautista et al. (2007) L. Berbil-Bautista, S. Krause, M. Bode, and R. Wiesendanger, “Spin-polarized scanning tunneling microscopy and spectroscopy of ferromagnetic Dy(0001)/W(110) films,” Phys. Rev. B 76, 064411 (2007).
- Ravlić et al. (2003) R. Ravlić, M. Bode, A. Kubetzka, and R. Wiesendanger, “Correlation of dislocation and domain structure of Cr(001) investigated by spin-polarized scanning tunneling microscopy,” Phys. Rev. B 67, 174411 (2003).
- Kurz et al. (2002) Ph. Kurz, G. Bihlmayer, and S. Blügel, “Magnetism and electronic structure of hcp Gd and the Gd(0001) surface,” Journal of Physics: Condensed Matter 14, 6353–6371 (2002).
- Arblaster (2010) J. W. Arblaster, “Crystallographic properties of iridium,” Platinum Metals Review 54, 93–102 (2010).
- (30) See supplemental material [url] for detailed information regarding the preparation of clean, oxygen-reconstructed, and TMO-covered fcc(001) surfaces, the characterization of magnetic probe tips, and SP-STM investigations of TMOs not discussed in the main text, including Refs. [42-50].
- Anderson (1950) P. W. Anderson, “Antiferromagnetism. theory of superexchange interaction,” Phys. Rev. 79, 350–356 (1950).
- Fert and Levy (1980) A. Fert and Peter M. Levy, “Role of anisotropic exchange interactions in determining the properties of spin-glasses,” Phys. Rev. Lett. 44, 1538–1541 (1980).
- Dupé et al. (2015) B. Dupé, J.E. Bickel, Y. Mokrousov, F. Otte, K. von Bergmann, A. Kubetzka, S. Heinze, and R. Wiesendanger, “Giant magnetization canting due to symmetry breaking in zigzag Co chains on Ir(001),” New Journal of Physics 17, 023014 (2015).
- Bouaziz et al. (2017) J. Bouaziz, M. dos Santos Dias, A. Ziane, M. Benakki, S. Blügel, and S. Lounis, “Chiral magnetism of magnetic adatoms generated by Rashba electrons,” New Journal of Physics 19, 023010 (2017).
- Grigoriev et al. (2008) S. V. Grigoriev, Yu. O. Chetverikov, D. Lott, and A. Schreyer, “Field induced chirality in the helix structure of multilayer films and experimental evidence for Dzyaloshinskii-Moriya interaction on the interfaces,” Phys. Rev. Lett. 100, 197203 (2008).
- Hammer et al. (2016b) R. Hammer, K. Meinel, O. Krahn, and W. Widdra, “Surface reconstruction of pt(001) quantitatively revisited,” Phys. Rev. B 94, 195406 (2016b).
- van Houselt et al. (2008) A. van Houselt, T. Gnielka, J. M. J. Aan de Brugh, N. Oncel, D. Kockmann, R. Heid, K.-P. Bohnen, B. Poelsema, and H. J. W. Zandvliet, “Peierls instability in Pt chains on Ge(001),” Surface Science 602, 1731 (2008).
- Gilarowski et al. (2000) Gerhard Gilarowski, Javier Méndez, and Horst Niehus, “Initial growth of cu on ir(100)-,” Surface Science 448, 290 (2000).
- Moriya (1960) T. Moriya, “Anisotropic superexchange interaction and weak ferromagnetism,” Phys. Rev. 120, 91–98 (1960).
- Moritz et al. (2004) J. Moritz, F. Garcia, J. C. Toussaint, B. Dieny, and J. P. Nozières, “Orange peel coupling in multilayers with perpendicular magnetic anisotropy: Application to (co/pt)-based exchange-biased spin-valves,” Europhys. Lett. 65, 123–129 (2004).
- Stoeffler (2004) D. Stoeffler, “Ab initio study of the fe intra- and inter-layer magnetic order in fe/ir(001) superlattices,” The European Physical Journal B - Condensed Matter and Complex Systems 37, 311–320 (2004).
- Johnson et al. (2000) K. Johnson, Q. Ge, S. Titmuss, and D. A. King, “Unusual bridged site for adsorbed oxygen adatoms: Theory and experiment for Ir{100}–-O,” The Journal of Chemical Physics 112, 10460–10466 (2000).
- Ferstl et al. (2016b) P. Ferstl, T. Schmitt, M. A. Schneider, L. Hammer, A. Michl, and S. Müller, “Structure and ordering of oxygen on unreconstructed Ir(100),” Phys. Rev. B 93, 235406 (2016b).
- Elmers et al. (1999) H. J. Elmers, J. Hauschild, and U. Gradmann, “Onset of perpendicular magnetization in nanostripe arrays of Fe on stepped W(110) surfaces,” Phys. Rev. B 59, 3688–3695 (1999).
- Bode et al. (2002) M. Bode, S. Heinze, A. Kubetzka, O. Pietzsch, X. Nie, G. Bihlmayer, S. Blügel, and R. Wiesendanger, “Magnetization-direction-dependent local electronic structure probed by scanning tunneling spectroscopy,” Phys. Rev. Lett. 89, 237205 (2002).
- Pietzsch et al. (2001) O. Pietzsch, A. Kubetzka, M. Bode, and R. Wiesendanger, “Observation of magnetic hysteresis at the nanometer scale by spin-polarized scanning tunneling spectroscopy,” Science 292, 2053–2056 (2001).
- Kubetzka et al. (2003) A. Kubetzka, O. Pietzsch, M. Bode, and R. Wiesendanger, “Spin-polarized scanning tunneling microscopy study of walls in an external magnetic field,” Phys. Rev. B 67, 020401 (2003).
- Bode et al. (2003) M. Bode, A. Kubetzka, S. Heinze, O. Pietzsch, R. Wiesendanger, M. Heide, X. Nie, G. Bihlmayer, and S. Blügel, “Spin-orbit induced local band structure variations revealed by scanning tunnelling spectroscopy,” Journal of Physics: Condensed Matter 15, S679–S692 (2003).
- Vedmedenko et al. (2004) E. Y. Vedmedenko, A. Kubetzka, K. von Bergmann, O. Pietzsch, M. Bode, J. Kirschner, H. P. Oepen, and R. Wiesendanger, “Domain wall orientation in magnetic nanowires,” Phys. Rev. Lett. 92, 077207 (2004).
- Elmers et al. (1995) H. J. Elmers, J. Hauschild, H. Fritzsche, G. Liu, U. Gradmann, and U. Köhler, “Magnetic frustration in ultrathin Fe films,” Phys. Rev. Lett. 75, 2031 (1995).