Evidence for a Pressure-induced Phase Transition of Few-layer Graphene to 2D Diamond
Abstract
We unveil the diamondization mechanism of few-layer graphene compressed in the presence of water, providing robust evidence for the pressure-induced formation of 2D diamond. High-pressure Raman spectroscopy provides evidence of a phase transition occurring in the range of 4–7 GPa for 5–layer graphene and graphite. The pressure-induced phase is partially transparent and indents the silicon substrate. Our combined theoretical and experimental results indicate a gradual top-bottom diamondization mechanism, consistent with the formation of diamondene, a 2D ferromagnetic semiconductor. High-pressure x-ray diffraction on graphene indicates the formation of hexagonal diamond, consistent with the bulk limit of eclipsed-conformed diamondene.
The search for a stable 2D diamond has gathered recent interest due to the possibility of combining diamond’s distinguished properties, such as superior hardness Zhao et al. (2016) and heat conduction Balandin (2011), with exotic new properties that may arise from the reduced dimensionality. Its existence was first proposed over a decade ago Chernozatonskii et al. (2009),
and different structures have been theoretically proposed ever since Chernozatonskii et al. (2010); Barboza et al. (2011); Antipina and Sorokin (2015); Gao et al. (2018). In most structures, stability is achieved by surface functionalization at the top and bottom surfaces Chernozatonskii et al. (2009); Antipina and Sorokin (2015); Gao et al. (2018), sometimes called diamane Chernozatonskii et al. (2009) for bilayer, and diamanoïds for thicker layers Piazza et al. (2019a). DiamondeneMartins et al. (2017), another proposed 2D–diamond structure, greatly differs from those, being covalently bonded to chemical groups only at the top surface while the bottom exhibits a periodic array of dangling bonds. These unpaired electrons generate magnetism in diamondene, and their periodic distribution gives rise to two spin-polarized bands, making it an ideal platform material for spintronics Barboza et al. (2011); Martins et al. (2017).
In this letter, we investigate the formation of diamondene via high-pressure experiments using diamond anvil cells (DACs) and we provide structural information through high-pressure x-ray diffraction (XRD). We use water as the pressure transmitting medium (PTM) due to its importance in facilitating this phase transition Barboza et al. (2011); Martins et al. (2017). High-pressure Raman spectroscopy provides evidence of a phase transition occurring in the range of 4–7 GPa for 5-layer graphene and graphite. The pressure-induced phase is partially transparent and indents the silicon substrate, indicative of extreme hardness. We combine experimental data with Molecular dynamics (MD) simulations and Density functional theory (DFT) calculations to propose a full diamondization mechanism in compressed few-layer graphene, providing robust evidence for the pressure-induced formation of 2D diamond. We show that the use of water PTM allows for a gradual top-bottom diamondization process, consistent with the formation of diamondene.
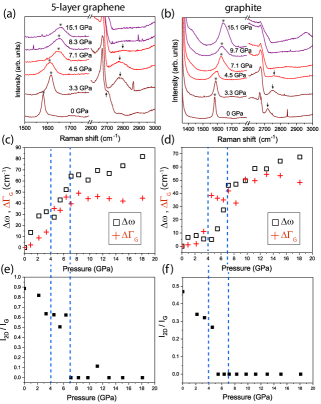
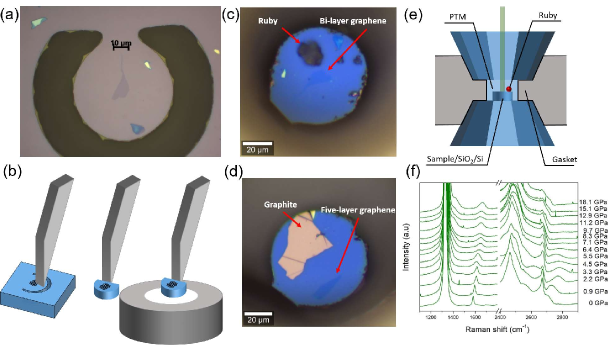
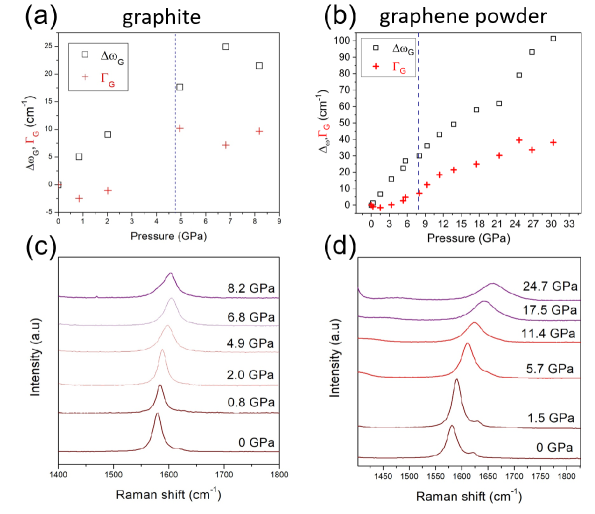
High-pressure Raman experiments were performed on mechanically exfoliated graphene samples transferred onto 25-m-thick Si substrates (see details in Supplementary Information). The sample is composed of a graphite piece sitting next to a five-layer graphene, as shown in Fig. S1(d). The sample was compressed in the DAC using water as the PTM, and all Raman spectra were acquired using a 532 nm excitation laser. Figures 1(a,b) show selected Raman spectra of the compressed five-layer graphene and graphite, respectively, measured at different pressures featuring the first-order Raman-allowed G band ( 1580 cm-1 in ambient pressure), and the two-phonon Raman 2D band ( 2700 cm-1) Jorio et al. (2011).
Figures 1(c,d) show the plot of the pressure-evolution of the G band frequency subtracted from its frequency measured in ambient conditions (). The data were extracted from the Raman spectra of five-layer graphene and graphite, respectively. Figures 1(c,d) show the evolution of the full-width at half maximum of the G band, . At low pressures, we observe the expected strain-induced phonon hardening Huang et al. (2009), by shifts in the G and 2D bands Proctor et al. (2009) to higher frequencies without significant changes in Filintoglou et al. (2013). The trend changes at 4 and 7 GPa for both flakes. These critical pressures are evidenced by the blue dashed lines in Figs. 1(c,d). The most remarkable change is an abrupt increase in , which is considered a signature of structural phase transitions in compressed graphite Hanfland et al. (1989); Amsler et al. (2012); Wang et al. (2012). For both five–layer graphene [Figs. 1(a,c)] and graphite [Figs. 1(b,d)], suddenly broadens around 4 GPa, indicating the onset of a phase transition, and remains relatively constant above 7 GPa, indicating a completed transition.
The occurrence of a phase transition is further bolstered by the concomitant abrupt intensity suppression of the 2D band, as observed in the Raman spectra shown in Figs. 1(a,b) and systematically depicted in the plots of the ratio between the 2D and G bands intensities, , as a function of pressure, shown in Figs. 1(e,f) for the five-layer graphene and graphite, respectively. Since the 2D band originates from double-resonance mechanisms Jorio et al. (2011), its intensity is highly sensitive to changes in the electronic structure due to structural changes Ferreira et al. (2010).
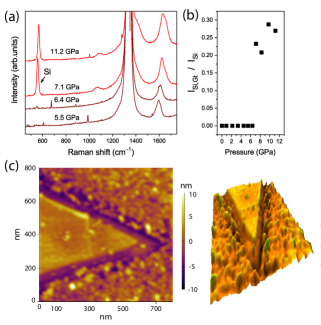
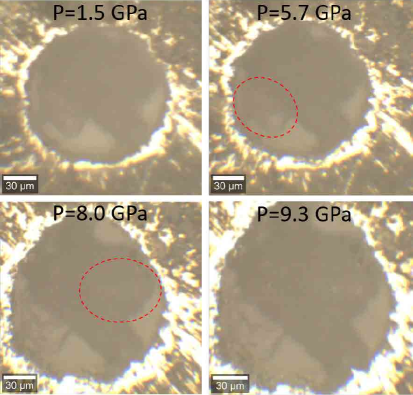
After 7.1 GPa, the Raman peak at 1520 cm-1 from the SiO2/Si substrate area under the graphite flake becomes detectable, as shown in Fig. 2(a)– an indication of transparency. Figure 2(b) quantifies this transparency event by showing the plot of the ratio between the intensity of the Si Raman peak measured from an area under the graphite flake, , and its intensity measured directly on the Si substrate, , as a function of pressure. As Fig. 2(b) shows, the ratio becomes for pressures above 7.1 GPa, indicating that the flake became partially transparent. Indeed, the optical images of the sample inside of the DAC at different pressures suggest a gradual top-bottom increase in transparency of the flakes in the 4–7 GPa range (see discussion in Supplementary Information).
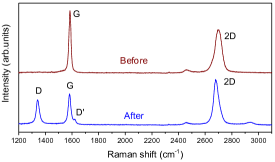
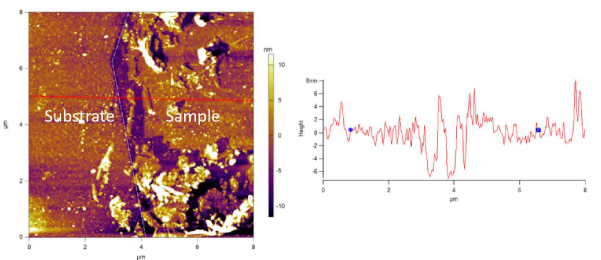
Upon phase transition, the optical images show cracks on the substrate along directions defined by the edges of the flake (Figure S3), indicating the formation of a hard phase. To confirm this feature we compressed a sample containing a four–layer graphene and a graphite flake on SiO2/Si in a DAC, up to 8 GPa using water PTM. The atomic force microscopy (AFM) topographical images of the recovered sample clearly show indentation marks on the SiO2, following the shape of both graphite [Fig. 2(c)] and four–layer sample [Fig. S4] . Furthermore, the Raman spectra of all recovered samples are remarkably similar to those of hydrogenated graphene Elias et al. (2009), exhibiting strong defect-induced D and D Raman bands Jorio et al. (2011), consistent with a partial functionalization of graphene. As an example, Fig. 3 shows the Raman spectra before and after decompression, at ambient condition, for the four–layer graphene.
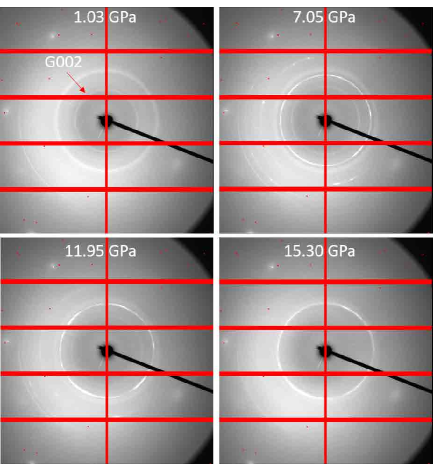
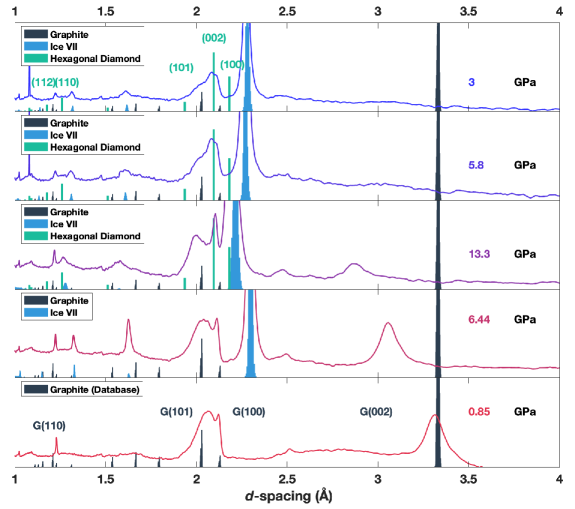
To obtain information on the crystal structure of the new phase, we performed high-pressure XRD on a graphene powder using water PTM. A graphene powder was used instead of a single few-layer graphene crystal, since the latter presents enormous challenges in terms of low x-ray cross section, given its low atomic number and two-dimensional nature. The sample contains by mass of flakes with thickness below 20 layers (see details in Supplementary Information). The sample was compressed to a maximum pressure of 18 GPa, and decompressed to a final residual pressure of 3 GPa. Figure 4(a) shows the diffraction intensity as a function of –spacing at the initial pressure. The peaks from graphitic/graphene (G) systems at 0 GPa are labeled in Fig. 4(a).
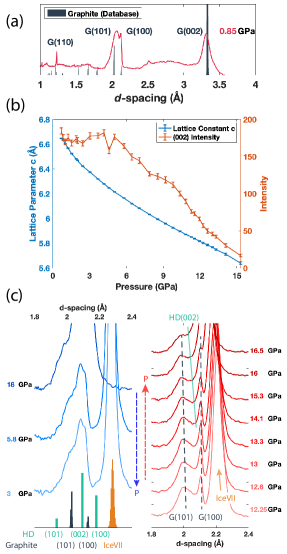
Figure 4(b) shows the evolution, with increasing pressure, of the intensity and -spacing of the G002 peak, from which the out-of-plane lattice parameter can be obtained. The G002 peak shifts with increasing pressure due to graphene’s large compressibility along the –axis Yagi et al. (1992), and its intensity remains practically constant until 5 GPa, after which it starts to decrease, becoming undetectable above 15 GPa. Such a decrease can be assigned to the onset of the phase transition, in agreement with the onset pressures observed in the Raman experiments. Upon decompression [Fig. 4(c)], a new peak is resolvable between G101 and G100. The rise of a peak with similar features has been reported in room-temperature compressed graphite upon decompression and assigned as 002 of hexagonal diamond (HD) Yagi et al. (1992). As shown in Fig. 4(b), a good agreement exists for the two strongest peaks HD002 and HD100. Other HD peaks could not be identified, likely due to a combination of low intensity, unfavorable spatial orientation of flakes that meet the Bragg condition and overlap with ICE VII or graphene peaks, as can be seen in Fig. S11. In fact, it is possible to see the rise of the HD002 peak at approximately 14 GPa [Fig.4(c)].
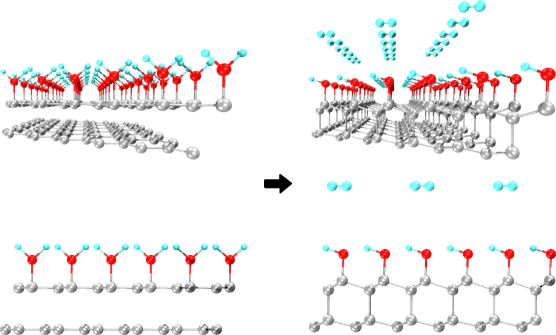
To interpret the experimental results, we carried out MD simulations and DFT calculations. Both theoretical schemes assume a starting system of an AB–stacked five–layer graphene whose top surface is covered with either –OH or –H groups. These are assumed to originate from water molecules in reactions under high pressures at the surface of graphene Barboza et al. (2011) (see details in Supplementary Information), and play a fundamental role in both rehybridization and stabilization processes Paul and Momeni (2019).
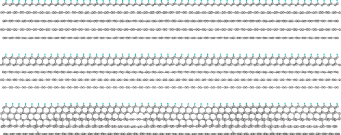
Figure 5 presents three snapshots with increasing pressure obtained from MD simulations. The pressure was applied to the system by a moving piston modeled as a Lennard-Jones wall. Upon compression, the phase transition starts with the diamondization of the first two layers, giving rise to diamondene. For the formation of covalent bonds between diamondene and the graphene layer underneath to occur, the pressure needs to be further increased since the distance between the layers is too large to allow for the rehybridization. In this process, called vertical propagation, the third graphene layer displaces horizontally resulting in a transformation from an ABA to an ABB trilayer stacking configuration.
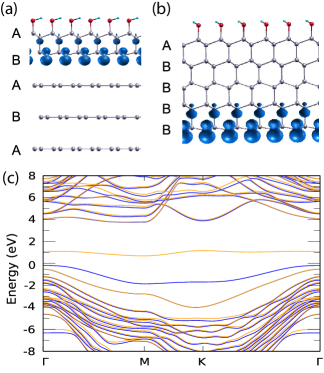
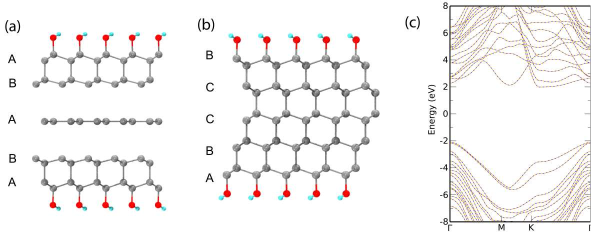
The DFT calculations confirm this gradual-top bottom diamodization process. Figures 6(a,b) show the optimized geometries for two configurations with increasing applied force, obtained from DFT calculations. To mimic the application of pressure, we employed a hard-wall constraint in the lowest carbon atoms, which are not allowed to move in the negative z–direction, while a predefined force was applied in the oxygen atoms of the –OH groups which functionalize the upper graphene surface. Under compression, the diamondene structure is initially formed with the underlying three-layer graphene protecting the array of dangling bonds [Fig. 6(a)]. Interestingly, a similar structure has been recently reported from a hot-filament process of few-layer graphene Piazza et al. (2019b). Next, by increasing the applied forces, a completely rehybridized five–layer geometry characterized by an ABBBB stacking is obtained, as shown in Fig. 6(b). In the BB part of that stacking, the interlayer bonds are in an eclipsed conformation. The electronic band structure corresponding to the ABBBB stacking, shown in Fig. 6(c), preserves the main features of the diamondene – localized states at the dangling bonds leading to a pair of spin-polarized bands. Different rehybridized geometries are possible (see discussion in Supplementary Information).
The vertical propagation mechanism explains several features of the experiment, for instance, the XRD data. Since there is no indication of significant water intercalation in the graphene powder- the initial d-spacing is 3.323 Å [see Fig.4(b)], while the basal spacing of graphite is 3.3553 Å Clark et al. (2013)- it is reasonable to propose a top-bottom diamondization process, as shown in Figs. 6(a,b), starting at the surface (in contact with water), and propagating towards the powder’s core. As the crystal grows, in the bulk limit, one should expect a BB stacked configuration [Fig. 6(b)], which is precisely the crystal structure of hexagonal diamond. Also in the bulk limit, one should expect a detectable XRD signal, with intensity strong enough to overcome the broad graphene peaks. Moreover, the fact that the HD002 peak rises as the G002 graphene peak vanishes is consistent with our model, in which diamondene and graphene share the same -axis.
The model also explains the asymmetric shape of the Raman G band for both 5–layer graphene and graphite after the onset of the phase transition. Starting from 4 GPa, the G band exhibits an asymmetric shape, which is more pronounced for graphite [Figs. 1(a,b)]. This could be caused by the coexisting pristine and hybridized phases during the vertical propagation [Fig. 6(a)], with distinct G band frequencies of narrowed and broadened bandwidth, respectively. This feature was confirmed, and other aspects of the model were further investigated in a high-pressure Raman experiment comparing graphite and a graphene powder (see discussion in Supplementary Information). Another important aspect to be noted is the shape of the 2D band of the recovered samples post-compression. As observed from the Raman spectra obtained from the recovered samples, shown in Fig.3, its symmetrical shape indicates that an overall loss of stacking order occurred in those flakes Jorio et al. (2011), consistent with lateral sliding between layers during compression.
Most previous experimental indications of the existence of a 2D diamond have been obtained by tip-compression Barboza et al. (2011); Gao et al. (2018); Cellini et al. (2019), hydrostatic compression Martins et al. (2017); Ke et al. (2019) or hydrogenation of few-layer graphene Piazza et al. (2019a); Srivastava and Fahad (2019). Even though these works promoted significant advances in the field, they did not provide structural information about the new phase. Recent preprints investigate the formation of diamane Bakharev et al. (2019) and diamanoïds Piazza et al. (2019b) via chemical-functionalization routes, reporting structural information through transmission electron microscopy and low-energy electron diffraction, respectively.
In summary, Raman spectroscopy data identified the critical pressures for five-layer graphene and graphite. The pressure-induced phase is partially transparent and indents the silicon substrate. Our combined theoretical and experimental results indicate a gradual top-bottom diamondization process, which starts with the formation of bi-layer diamondene and propagates along axis to the bottom. High-pressure XRD data indicated the formation of hexagonal diamond, consistent with the bulk limit of eclipsed-conformed diamondene. Evidence of functionalization from the recovered samples suggests that a stable 2D diamond could be obtained through further tuning of the synthesis parameters, e.g., by increasing temperature.
I Supplementary Information
I.1 Sample preparation
To miniaturize the samples, a method based on etching horseshoe-shaped trenches on a thin silicon wafer was developed. This method can be used to systematically load 2D materials and related heterostructures into DACs, a common bottleneck in high-pressure experiments involving these types of systems.
Horseshoe-shaped trenches were etched through 25-m-thick Si substrates covered with a 300-nm-thick SiO2 layer as shown in Figure S1a. The graphene flakes were deposited onto the regions surrounded by the trenches, using the pick–up/transfer technique described in Ref. Wang et al. (2015). Afterward, the tiny ( 70 m of diameter) SiO2/Si disk supporting the graphene piece is cleaved and detached from the SiO2/Si wafer using a sharp stainless steel tip, and the same tip is used to bring the disk inside the diamond anvil cell (DAC), as illustrated in Fig. S1b.
The graphene powder was prepared by liquid–phase exfoliation of natural graphite. The sample was centrifuged at 15 kG. Statistical AFM analysis Fernandes et al. (2019) was carried out over more than 4000 flakes, and the results show that of the sample, in mass, is composed of few–layer graphene flakes (less than 5 layers), is composed of graphene platelets with thicknesses between 6 and 10 layers, is composed of platelets with thicknesses between 10 and 20 layers, and of flakes with more than 20 layers. In fact, from the XRD data taken at ambient pressure, one can notice that the G002 and G101 peaks from graphene are broad, an indication of poor degree of crystallinity along the axis, as expected for a powder composed of randomly stacked 2D flakes. To avoid the presence of residual water content and reagents, the sample was heated up to 400 Co.
I.2 High-pressure Raman
Raman spectra were acquired using an alpha 300 system RA from WITec (Ulm, Germany) equipped with a highly linear (0.02%) piezo-driven stage, and objective lenses from Nikon (10, NA = 0.3 for high-pressure measurements and 50, NA=0.55 for room condition measurements). A diode pumped solid state polarized laser, = 532 nm, was used. The incident laser was focused with a diffraction-limited spot size (0.61/NA), and the Raman signal was detected by a high-sensitivity, back-illuminated CCD located behind a 600 gmm-1 grating. The spectrometer used was an ultra-high throughput Witec UHTS 300 with up to 70% throughput, designed specifically for Raman microscopy. To avoid damage due to sample heating, measurements were performed with powers of approximately 3 mW and 9 mW for the 50 and 10 objectives, respectively.
High-pressure Raman measurements were done with a gas-membrane driven DAC, microScope DAC-HT(G), using Inconel 718 pre-indented (m) gaskets. It is important to note that at pressures below 3 GPa, the 2D peak partially overlaps with the second-order Raman peak originated from the DAC’s diamond anvils. The pressure was monitored using the ruby’s calibration method described in Ref. Mao et al. (1986). The spectra of G and 2D bands were fitted with Voigt functions using the software PeakFit v4.12. The numbers of layers of graphene samples were determined by standardized principal component analysis (PCA) of the 2D bandSilva et al. (2019).
I.3 Indentation experiments
The high-pressure compression of the 4-layer graphene and graphite on SiO2 substrate sample was performed with a Symmetric type DAC, using stainless steel pre-indented (m) gaskets. The pressure was increased to 8 GPa and kept at this pressure for 12 hours, after which, the DAC was opened and the sample was recovered and its spectra collected. No Raman spectra were acquired during compression. Raman spectra were acquired after decompression using a confocal microscope spectrometer (Horiba LabRAM HR Evolution) in a backscattering geometry, with a 50 objective lens and 532 nm laser. The measurement was performed with a power of approximately 3 mW to avoid damage due to sample heating.
The AFM topography measurement of the recovered samples was performed with a Cypher S AFM Microsope using an AC240TS-R3 cantilever from Oxford Instruments, with resonance frequency at 70 Hz.
I.4 High-pressure x-ray diffraction
High-pressure XRD measurements were conducted at 16ID-B of High Pressure Collaborative Access Team (HPCAT) at the Advanced Photon Source(APS), Argonne National Laboratory, using a symmetric type DAC. The incident monochromatic x-ray beam, Å was focused down to 5-10 m in diameter, and the XRD patterns were collected on a Pilatus Area Detector. The XRD spectra were analyzed using Matlab for background subtraction and PeakFit v4.12 for Voight fitting the G002 peak.
I.5 Theoretical calculations details
In the MD simulations, performed with the LAMMPS Plimpton (1995) software, atoms were treated as point particles interacting through the AIREBO Stuart et al. (2000) potential. The H-functionalized five-layer graphene was represented by 22.880 and 2.288 carbon and hydrogen atoms, respectively, and boundary conditions were imposed in the in-plane x- and y- directions. The time step was set to 0.25 fs. We employed the Nosé-Hoover thermostat Nosé (1984) scheme to keep the average temperature at 300 K. Additionally, the Nosé-Hoover barostat was used in order to allow for fluctuations in the lateral (xy) box dimensions (external pressure set to 1 bar). The five layers were placed in the AB stacking, with a repulsive wall placed immediately bellow the fifth layer. The pressure was applied to the system by a moving piston modeled as a Lennard-Jones (LJ) wall, initially placed 4 Å above hydrogen atoms, with energy and distance parameters of 1.0 meV and 3.0 Å, respectively. Simulations were divided in two stages, the preparation and production ones. The preparation stage comprised a structure minimization followed by a temperature equilibration dynamics, in which the system was linearly heated from 30 K to 300 K during 25 ps and kept at this temperature for further 25 ps. In the first part of the production stage - the loading process -, the distance between the piston and the system was linearly decreased during 200 ps, leaving an average graphene interlayer separation of 2.6 Å. Piston position was kept for 400 ps, and then returned to its initial position after additional 100 ps.
In the DFT Hohenberg and Kohn (1964); Kohn and Sham (1965) calculations, we employed the SIESTA implementation Soler et al. (2002), making use of norm conserving Troullier-Martins pseudopotentials Troullier and Martins (1991) in the factorized Kleinman-Bylander form Kleinman and Bylander (1982). The basis set was composed of double-zeta pseudoatomic orbitals of finite range augmented by polarization functions - the DZP basis set. The generalized gradient approximation (GGA) Perdew et al. (1996) was chosen to represent the exchange-correlation functional. We performed integrals in real space using a grid defined by a meshcutoff of 350 Ry, and the Brillouin zone was sampled using a k-grid cutoff of 30 Å. The geometries were considered optimized when the maximum force component (not constrained) in any atom was less than 10 meV/ Å. To mimic the application of pressure, we employ a hard-wall constraint in the lowest carbon atoms, which are not allowed to move in the negative z–direction, while a predefined force is applied in the oxygen atoms of the –OH groups which functionalize the upper graphene surface.
In the MD simulations, we chose hydrogen functionalization of the upper graphene layer since model potentials for C-H bonds are well described in literature. DFT calculations can be performed with either –OH and –H groups, rendering basically the same results. We chose -OH to be consistent with similar models reported in previous studies Barboza et al. (2011); Martins et al. (2017). For plotting the LDOS of the dangling bonds in Figure 6a-b, the Xcrysden program was used Kokalj (2003). An isovalue of 0.01 was used in Fig. 6a and 0.015 in Fig. 6b. The XRD simulation of BB bulk diamondene was obtained from Rietveld refinement using the RIETAN-FP software Izumi and Momma (2007) as implemented in the VESTA program‘Momma and Izumi (2011).
I.6 Hydrostatic limit of water PTM
Piermarini et. al Piermarini et al. (1973) investigated the hydrostatic limit of water, among other PTMs, in DAC experiments using two methods: (I) measuring the pressure at several different locations from ruby crystals spread across the chamber and (II) by measuring the spectral linewidth of the R1 fluorescence peak from ruby. From (I), they observed an unexpected low-pressure gradient to pressures above 10 GPa and up to 14 GPa with practically no pressure gradient up to 10 GPa and from (II), they observed an increase in linewidth that is consistent with the observations from (I). Olinger et. al Olinger and Halleck (1975) performed high-pressure XRD on a mixture of aluminum powder and distilled water, and they reported no effects due to localized non-hydrostatic stresses or detection of pressure gradients over their pressure range, which was up to 8 GPa. Our analysis of the linewidth of the R1 and difference in peak position between R1 and R2 ruby fluorescence peaks, shows no indications of non-hydrostatic stress until 10 GPa and supports those observations from previous works. It is important to mention that most of our evidence of phase transition from the High-Pressure Raman experiments were obtained in a pressure range bellow 7 GPa.
I.7 Optical changes of 5-layer graphene and graphite samples during compression
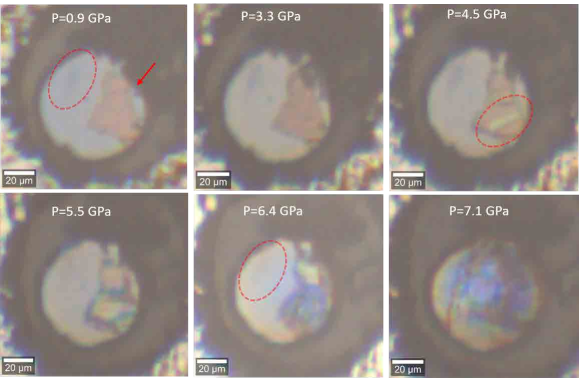
Consistent with the Raman spectroscopic signatures of a pressure-induced phase transition, changes in the optical properties of the 5-layer graphene and graphite flakes were also observed in the 4–7 GPa range. Figure S2 shows optical images of the sample inside the DAC at different pressures. Starting at 4.5 GPa, a series of color changes occur in the graphite flake, with the formation of a yellow region which spreads over the flake with increasing pressure, then gradually turns to a color similar to the substrate – an indication of increasing transparency. The 5–layer graphene and graphite flakes can no longer be seen at 6.4 GPa and 7.1 GPa, respectively.
Overall, the observation of these changes in the optical properties of the flakes suggests a gradual top-bottom increase in transparency, consistent with a phase transition starting with the first top layers and propagating to the bottom with increasing pressure.
I.8 Indentation evidence
Figure S3 shows the formation of cracks on the silicon along directions defined by the edges of the flake after the pressure-induced phase transition of the five-layer sample. Those features are consistent with the formation of a hard-phase upon phase transition.
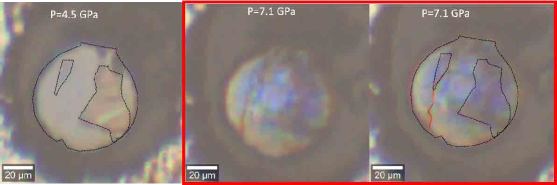
Figure S4 shows the AFM topographical image of the four-layer sample after compression, where it is possible to see the grooves on the silicon substrate along the edges of the flake. For comparison, indention experiments on SiO2 Cellini et al. (2019) show that this material can only be indented by a few angstroms in the estimated pressure range of 0-7 GPa. However, the deep grooves formed along the edges of the flakes –as shown by the AFM image – indicate that SiO2 was indented by a few nanometers in the current case. Indentation experiments performed on graphene of different thicknesses on SiO2, showed that graphene systems (1–3 layers and graphite) are softer than SiO2 Cellini et al. (2019), being unable to cause this type of indentation. This confirms the formation of a hard phase during compression, capable of indenting the silicon oxide substrate.
I.9 Origin of the -OH and -H chemical groups in diamondene
The formation of -H or -OH groups in the water-graphene interface under pressure is a complex issue due to the difficulties in simulating a chemical reaction through first principles calculations, and it is beyond the scope of our work. Nevertheless, simplified mechanisms may be proposed to shed light upon the role of the dissociation of water molecules in the rehybridization process. To this purpose, we propose an initial configuration for the first principles geometric optimization in which H2O molecules are placed on top of a bilayer graphene. Then we apply pressure on the system by decreasing the graphene interlayer distance and by constraining the vertical displacements of the bottommost carbon atoms and of the oxygen atoms, the so-called hard-wall constraints. Figure S5 on the left shows this initial geometry with a interlayer distance of 2.3 Å. Upon optimization, a OH bond increases while the graphene layers approach each other becoming increasingly corrugated. Eventually, the O-H bond breaks and the hydrogen atom binds to the neighboring H atom, forming a H2 molecule which becomes physically adsorbed on top of the diamondene structure just formed. This last configuration is shown in Fig. S5, on the right.
I.10 Possibility of different rehybridized geometries from DFT calculations
Due to the importance of kinetic aspects, our DFT calculations do not aim to find the lowest energy configuration. Rather, given the initial conditions (interaction between graphene and —OH groups), our conclusion is that, in fact, mixed stacking orders are highly likely. In a systematic investigation of this problem, Xie et al. Xie et al. (2017) have ascribed this hexagonal diamond order to a facile initial nucleation mechanism, involving the existence of coherent sp2–sp3 interfaces. Still according to their results, cubic diamond growth should have a much slower kinetics and should be mixed with that of hexagonal diamond.
The AB and AA stacking types still coexist in a model which takes into account functionalization on both upper and lower surfaces. In this model, the first rehybridized geometry is symmetric and composed of a pair of diamondene structures separated by a graphene layer, as shown in Fig. S6a. With increasing pressure, this layer also becomes sp3–hybridized, leading to the structure shown in Fig. S6b – the resulting stacking is ABCCB. The double functionalization saturates all dangling bonds – as a result, no localized states appear in the spectrum, and the band gap opens up to 4.07 eV, as shown if Fig. S6c.
I.11 Detailing the sp3 bond formation from MD simulations
We further detail the sp2-sp3 restructuring process of the compressed AB-stacked five-layer graphene. As explained in the main text, the phase transition starts with the diamondization of the first two layers, giving rise to diamondene. This happens in two steps, the first being nucleation: the formation of random chemical bonds between the two layers due to their closer proximity, allowing for the sp2–sp3 rehybridization of the carbon atoms. Such a process is greatly facilitated by the presence of –H groups on the top surface. Once these chemical bonds are formed, they trigger the sp3 conversion across the first two layers through a cooperative phenomenonStojkovic et al. (2003) in which each tetrahedral bond favors the formation of a neighboring sp3 bond. As a result, the diamondene structure is formed in this so-called horizontal propagation. For the vertical propagation to occur, the pressure needs to be further increased.
Figure S7 presents heatmaps in which the colors represent local interlayer distances. Panels show layer pairs distances at three different times: 175 ps, 225 ps, and 275 ps between layers 1 and 2 (a)-(c), 2 and 3 (d)-(f), 3 and 4 (g)-(i). We consider a sp3 bond to be formed if the interlayer distance is equal to or less than 1.6 Å. Regions in orange have typical interlayer distances of about 2.6 Å, which indicates non-sp3 bond formation. Regions approaching the purple color, corresponding to a distance of 1.6 Å, indicate the sp2–sp3 phase transition occurrence.

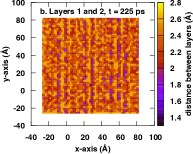
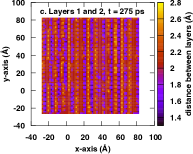

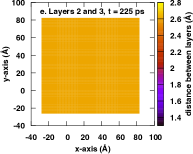
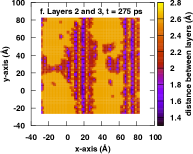


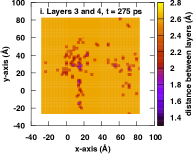
From Fig. S7 we see that all possible sp3 bonds between layers 1 and 2 are formed, considering the range of pressures of our simulations. Layers
2 and 3 form 45% of possible sp3 bonds while layers 3 and 4 form only 5%. It is worth mentioning that such sp2–sp3 transitions occur in a narrow time window of few picoseconds for layers 1 and 2 and of femtoseconds between other pairs.
We also see from Fig. S7 the occurrence of sp3 bonds across layers in the xy plane. The observation of the vertical blue lines in the second panel of heatmap (t = 275 ps and bonds between first two layers) is a clear signature of the collective process.
I.12 High-pressure Raman experiment to further investigate our model
To further investigate the importance of the stacking order in the graphene system for the propagation processes, we carried out additional high-pressure Raman experiments, compressing a graphite piece and a graphene powder in a DAC using water as the PTM. All Raman spectra were acquired using a 532–nm excitation laser. The graphene powder had the same flake-thickness distribution as the powder used in the High-pressure XRD experiments. The graphite piece and the graphene powder were compressed to a maximum pressure of 8 GPa and 30 GPa, respectively.
Figure. S8a–b shows a plot of the G band frequency, , and width subtracted from their initial values at ambient pressure for graphite and the graphene powder, respectively. In agreement with our high-pressure Raman experiments, both samples showed an abrupt broadening in the 4–7 GPa range. However, the shape of the G band with increasing pressure for each sample, shown in Figs. S8c–d for graphite and the graphene powder, respectively, is quite different. After the onset of the phase transition, occurring at 5 GPa for the graphite piece, and at 7 GPa for the graphene powder, the G band assumes an asymmetric shape for the former while it remains mostly symmetrical for the latter. Since the main difference between these samples is in their stacking order, the explanation on the difference in G band’s shape upon compression, must be related to this feature.
The G band asymmetry in graphite was already explained in the main text in terms of scattered Raman signals coming from the coexisting pristine and rehybridized layers during vertical propagation, as illustrated in Fig. 6(a) of the main text. For the graphene powder, due to the random stacking between flakes of different thicknesses, the vertical propagation is inefficient, and one should expect the surface of the powder to consist of rehybridized flakes while the bulk remains unhybridized. Therefore, the Raman spectra of the compressed graphene powder should be largely dominated by the unhybridized flakes from the bulk, giving rise to the symmetrical G band shape. Furthermore, we don’t see the clear kinks in plots at the critical pressures as observed in Figs. 1(c-d) of the main text (the kink at 24 GPa is likely related to changes in the compression regime due to non-hydrostatic stress components from the water PTM).
As the pressure increases, the diamondization propagates from the surface to the bulk at a slower rate, when compared to flakes with a defined stacking order. For instance, the graphene powder does not become entirely transparent with increasing pressure, as can be seen from Fig. S9, which shows optical images of the graphene powder inside the DAC at different pressures. Only certain regions of the powder, shown by the dashed ellipses in Fig. S9, become visually more transparent. Those regions are probably where the stacking order is more favorable for the vertical propagation to occur.
I.13 Extinction of G002 peak and pressure range of phase transition
It is unlikely that the decrease of G002 peak intensity could be due to a flake alignment to the compression axisYagi et al. (1992), since the 002 diffraction pattern remains a ring of relatively uniform intensity through the whole experiment (Fig. S10), and the PTM does not show non-hydrostatic components until approximately 10 GPa. Moreover, the large number of flakes and their low aspect ratio (average lateral size of 100 nm, as revealed by AFM), should avoid them to assume preferred orientation during compression.
It is important to note that the long range in pressure of this phase transition, compared to the Raman measurements, can be explained by our model. The random stacking of the flakes in the powder should make the vertical propagation inefficient, as previously explained, requiring more pressure for it to happen and therefore extending the pressure range of the phase transition, compared to the single crystals with well defined stacking order.
Acknowledgements.
We are grateful to P. Jarillo-Herrero for granting lab access for sample fabrication, and J. Deng, L. Xie, A.P.M. Barboza, L. Dresselhaus-Copper and L. Ju for fruitful discussions. LGPM and JK acknowledge the support from National Science Foundation (NSF) under the EFRI2-DARE program (EFMA-1542863), and from CNPQ under the program Ciência sem Fronteiras (206251/2014-9). LGPM, MH, TP and JK acknowledge the support from AFOSR FATE MURI, grant no. FA9550-15-1-0514. RC acknowledges support from the Alfred P. Sloan Foundation. LGC and DLS acknowledge the support from CODEMGE. MSCM and ACRS acknowledge financial support from CAPES. LGC, MSCM, ACRS, MJSM, ABO and RJCB acknowledge the support from CNPq and FAPEMIG. ABO, ACRS, LGC, MJSM, MSCM and RJCB acknowledge the support from INCT-Nanocarbono. MJSM and RJCB acknowledge the support from UFOP. This work was performed in part at CNS, a member of NNCI, which is supported by NSF, award no. 1541959. Synchrotron X-ray diffraction was performed at HPCAT (Sector 16), Advanced Photon Source (APS), Argonne National Laboratory. HPCAT operations are supported by DOE-NNSA’s Office of Experimental Sciences. The Advanced Photon Source is a U.S. DOE Office of Science User Facility operated for the DOE Office of Science by Argonne National Laboratory under Contract No. DE-AC02-06CH11357. The high-pressure Raman measurements were performed at LCPNano – UFMG. The authors acknowledge the MGgraphene Project for providing graphene powder samples and related AFM data.References
- Zhao et al. (2016) Z. Zhao, B. Xu, and Y. Tian, Recent advances in superhard materials, Ann. Rev. Mat. Res. 46, 383 (2016).
- Balandin (2011) A. A. Balandin, Thermal properties of graphene and nanostructured carbon materials, Nat. Mat. 10, 569 (2011).
- Chernozatonskii et al. (2009) L. A. Chernozatonskii, P. B. Sorokin, A. G. Kvashnin, and D. G. Kvashnin, Diamond-like c 2 h nanolayer, diamane: Simulation of the structure and properties, J. Exp. Theor. Phys. 90, 134 (2009).
- Chernozatonskii et al. (2010) L. A. Chernozatonskii, P. B. Sorokin, A. A. Kuzubov, B. P. Sorokin, A. G. Kvashnin, D. G. Kvashnin, P. V. Avramov, and B. I. Yakobson, Influence of size effect on the electronic and elastic properties of diamond films with nanometer thickness, J. Phys. Chem. C 115, 132 (2010).
- Barboza et al. (2011) A. P. Barboza, M. H. Guimarães, D. V. Massote, L. C. Campos, N. M. Barbosa Neto, L. G. Cançado, R. G. Lacerda, H. Chacham, M. S. Mazzoni, and B. R. Neves, Room-temperature compression-induced diamondization of few-layer graphene, Adv. Mat. 23, 3014 (2011).
- Antipina and Sorokin (2015) L. Y. Antipina and P. B. Sorokin, Converting chemically functionalized few-layer graphene to diamond films: a computational study, J. Phys. Chem. C 119, 2828 (2015).
- Gao et al. (2018) Y. Gao, T. Cao, F. Cellini, C. Berger, W. A. De Heer, E. Tosatti, E. Riedo, and A. Bongiorno, Ultrahard carbon film from epitaxial two-layer graphene, Nat. Nanotech. 13, 133 (2018).
- Piazza et al. (2019a) F. Piazza, K. Gough, M. Monthioux, P. Puech, I. Gerber, R. Wiens, G. Paredes, and C. Ozoria, Low temperature, pressureless sp2 to sp3 transformation of ultrathin, crystalline carbon films, Carbon 145, 10 (2019a).
- Martins et al. (2017) L. G. P. Martins, M. J. Matos, A. R. Paschoal, P. T. Freire, N. F. Andrade, A. L. Aguiar, J. Kong, B. R. Neves, A. B. de Oliveira, M. S. Mazzoni, et al., Raman evidence for pressure-induced formation of diamondene, Nat. Commun. 8, 96 (2017).
- Jorio et al. (2011) A. Jorio, M. S. Dresselhaus, R. Saito, and G. Dresselhaus, Raman spectroscopy in graphene related systems (John Wiley & Sons, 2011).
- Huang et al. (2009) M. Huang, H. Yan, C. Chen, D. Song, T. F. Heinz, and J. Hone, Phonon softening and crystallographic orientation of strained graphene studied by raman spectroscopy, PNAS 106, 7304 (2009).
- Proctor et al. (2009) J. E. Proctor, E. Gregoryanz, K. S. Novoselov, M. Lotya, J. N. Coleman, and M. P. Halsall, High-pressure raman spectroscopy of graphene, Phys. Rev. B 80, 073408 (2009).
- Filintoglou et al. (2013) K. Filintoglou, N. Papadopoulos, J. Arvanitidis, D. Christofilos, O. Frank, M. Kalbac, J. Parthenios, G. Kalosakas, C. Galiotis, and K. Papagelis, Raman spectroscopy of graphene at high pressure: Effects of the substrate and the pressure transmitting media, Phys. Rev. B 88, 045418 (2013).
- Hanfland et al. (1989) M. Hanfland, H. Beister, and K. Syassen, Graphite under pressure: Equation of state and first-order raman modes, Phys. Rev. B 39, 12598 (1989).
- Amsler et al. (2012) M. Amsler, J. A. Flores-Livas, L. Lehtovaara, F. Balima, S. A. Ghasemi, D. Machon, S. Pailhès, A. Willand, D. Caliste, S. Botti, et al., Crystal structure of cold compressed graphite, Phys. Rev. Letters 108, 065501 (2012).
- Wang et al. (2012) Y. Wang, J. E. Panzik, B. Kiefer, and K. K. Lee, Crystal structure of graphite under room-temperature compression and decompression, Sci. Rep. 2, 520 (2012).
- Ferreira et al. (2010) E. M. Ferreira, M. V. Moutinho, F. Stavale, M. Lucchese, R. B. Capaz, C. Achete, and A. Jorio, Evolution of the raman spectra from single-, few-, and many-layer graphene with increasing disorder, Phys. Rev. B 82, 125429 (2010).
- Elias et al. (2009) D. C. Elias, R. R. Nair, T. Mohiuddin, S. Morozov, P. Blake, M. Halsall, A. C. Ferrari, D. Boukhvalov, M. Katsnelson, A. Geim, et al., Control of graphene’s properties by reversible hydrogenation: evidence for graphane, Science 323, 610 (2009).
- Yagi et al. (1992) T. Yagi, W. Utsumi, M.-a. Yamakata, T. Kikegawa, and O. Shimomura, High-pressure in situ x-ray-diffraction study of the phase transformation from graphite to hexagonal diamond at room temperature, Phys. Rev. B 46, 6031 (1992).
- Paul and Momeni (2019) S. Paul and K. Momeni, Mechanochemistry of stable diamane and atomically thin diamond films synthesis from bi-and multilayer graphene: A computational study, J. Phys. Chem. C (2019).
- Piazza et al. (2019b) F. Piazza, M. Monthioux, P. Puech, and I. C. Gerber, Towards a better understanding of the structure of diamanoïds and diamanoïd/graphene hybrids, arXiv preprint arXiv:1907.09033 (2019b).
- Clark et al. (2013) S. Clark, K.-J. Jeon, J.-Y. Chen, and C.-S. Yoo, Few-layer graphene under high pressure: Raman and x-ray diffraction studies, Solid State Commun. 154, 15 (2013).
- Cellini et al. (2019) F. Cellini, F. Lavini, C. Berger, W. de Heer, and E. Riedo, Layer dependence of graphene-diamene phase transition in epitaxial and exfoliated few-layer graphene using machine learning, 2D Materials (2019).
- Ke et al. (2019) F. Ke, Y. Chen, K. Yin, J. Yan, H. Zhang, Z. Liu, S. T. John, J. Wu, H.-k. Mao, and B. Chen, Large bandgap of pressurized trilayer graphene, PNAS 116, 9186 (2019).
- Srivastava and Fahad (2019) A. Srivastava and M. S. Fahad, Synthesis of two-dimensional diamond from graphene on copper, in 2019 Electron Devices Technology and Manufacturing Conference (EDTM) (IEEE, 2019) pp. 273–275.
- Bakharev et al. (2019) P. V. Bakharev, M. Huang, M. Saxena, S. W. Lee, S. H. Joo, S. O. Park, J. Dong, D. Camacho-Mojica, S. Jin, Y. Kwon, et al., Chemically induced transformation of cvd-grown bilayer graphene into single layer diamond, arXiv preprint arXiv:1901.02131 (2019).
- Wang et al. (2015) J. I.-J. Wang, Y. Yang, Y.-A. Chen, K. Watanabe, T. Taniguchi, H. O. Churchill, and P. Jarillo-Herrero, Electronic transport of encapsulated graphene and wse2 devices fabricated by pick-up of prepatterned hbn, Nano Lett. 15, 1898 (2015).
- Fernandes et al. (2019) T. F. D. Fernandes, D. R. Miquita, L. G. Cançado, and B. R. A. Neves, In preparation (2019).
- Mao et al. (1986) H. Mao, J.-A. Xu, and P. Bell, Calibration of the ruby pressure gauge to 800 kbar under quasi-hydrostatic conditions, J. Geophys. Res.: Sol. Earth 91, 4673 (1986).
- Silva et al. (2019) D. L. Silva, J. L. E. Campos, T. F. D. Fernandes, J. Nunes, H. Miranda, C. Rabelo, O. P. Vilela Neto, A. Jorio, and L. G. Cançado, Determination of statistical distributions of number of layers in graphene systems by raman spectroscopy, In preparation (2019).
- Plimpton (1995) S. Plimpton, Fast parallel algorithms for short-range molecular dynamics, J. Comp. Phys. 117, 1 (1995).
- Stuart et al. (2000) S. J. Stuart, A. B. Tutein, and J. A. Harrison, A reactive potential for hydrocarbons with intermolecular interactions, J. Chem. Phys. 112, 6472 (2000).
- Nosé (1984) S. Nosé, A unified formulation of the constant temperature molecular dynamics methods, J. Chem. Phys. 81, 511 (1984).
- Hohenberg and Kohn (1964) P. Hohenberg and W. Kohn, Inhomogeneous electron gas, Phys. Rev. 136, B864 (1964).
- Kohn and Sham (1965) W. Kohn and L. J. Sham, Self-consistent equations including exchange and correlation effects, Phys. Rev. 140, A1133 (1965).
- Soler et al. (2002) J. M. Soler, E. Artacho, J. D. Gale, A. García, J. Junquera, P. Ordejón, and D. Sánchez-Portal, The siesta method for ab initio order-n materials simulation, J. Phys. Condens. Matter 14, 2745 (2002).
- Troullier and Martins (1991) N. Troullier and J. L. Martins, Efficient pseudopotentials for plane-wave calculations, Phys. Rev. B 43, 1993 (1991).
- Kleinman and Bylander (1982) L. Kleinman and D. Bylander, Efficacious form for model pseudopotentials, Phys. Rev. Lett. 48, 1425 (1982).
- Perdew et al. (1996) J. P. Perdew, K. Burke, and M. Ernzerhof, Generalized gradient approximation made simple, Phys. Rev. Lett. 77, 3865 (1996).
- Kokalj (2003) A. Kokalj, Computer graphics and graphical user interfaces as tools in simulations of matter at the atomic scale, Comput. Mater. Science 28, 155 (2003).
- Izumi and Momma (2007) F. Izumi and K. Momma, Three-dimensional visualization in powder diffraction, in Applied Crystallography XX, Solid State Phenomena, Vol. 130 (Trans Tech Publications Ltd, 2007) pp. 15–20.
- Momma and Izumi (2011) K. Momma and F. Izumi, VESTA3 for three-dimensional visualization of crystal, volumetric and morphology data, J. Appl. Crystallogr. 44, 1272 (2011).
- Piermarini et al. (1973) G. Piermarini, S. Block, and J. Barnett, Hydrostatic limits in liquids and solids to 100 kbar, J. Appl. Phys. 44, 5377 (1973).
- Olinger and Halleck (1975) B. Olinger and P. M. Halleck, Compression and bonding of ice vii and an empirical linear expression for the isothermal compression of solids, J. Chem. Phys. 62, 94 (1975).
- Xie et al. (2017) Y.-P. Xie, X.-J. Zhang, and Z.-P. Liu, Graphite to diamond: origin for kinetics selectivity, JACS 139, 2545 (2017).
- Stojkovic et al. (2003) D. Stojkovic, P. Zhang, P. E. Lammert, and V. H. Crespi, Collective stabilization of hydrogen chemisorption on graphenic surfaces, Phys. Rev. B 68, 195406 (2003).