The role of C/O in nitrile astrochemistry in PDRs and planet-forming disks
Abstract
Complex nitriles, such as HC3N, and CH3CN, are observed in a wide variety of astrophysical environments, including at relatively high abundances in photon-dominated regions (PDR) and the UV exposed atmospheres of planet-forming disks. The latter have been inferred to be oxygen-poor, suggesting that these observations may be explained by organic chemistry in C-rich environments. In this study we first explore if the PDR complex nitrile observations can be explained by gas-phase PDR chemistry alone if the elemental C/O ratio is elevated. In the case of the Horsehead PDR, we find that gas-phase chemistry with C/O 0.9 can indeed explain the observed nitrile abundances, increasing predicted abundances by several orders of magnitude compared to standard C/O assumptions. We also find that the nitrile abundances are sensitive to the cosmic ray ionization treatment, and provide constraints on the branching ratios between CH3CN and \ceCH3NC productions. In a fiducial disk model, an elevated C/O ratio increases the CH3CN and HC3N productions by more than an order of magnitude, bringing abundance predictions within an order of magnitude to what has been inferred from observations. The C/O ratio appears to be a key variable in predicting and interpreting complex organic molecule abundances in photon-dominated regions across a range of scales.
=20
1 Introduction
Origins of life on Earth must have been closely linked to the emergence of information-rich polymers such as DNA (deoxyribonucleic acid) or RNA (ribonucleic acid). While their initial formation on the early Earth remains mysterious, there are plausible chemical pathways to their building blocks on the early Earth through a nitrile-centered UV-driven chemistry (Powner et al., 2009; Patel et al., 2015; Sutherland, 2016). Simple and complex nitriles are abundantly found at all stages of star and planet formation, including in planet-forming disks, suggesting that the organic chemistry that preceded life on Earth is not unique to the Solar System (Chapillon et al., 2012; Öberg et al., 2015; Bergner et al., 2018; Loomis et al., 2018). Perhaps surprisingly CH3CN and HC3N are two of the most commonly detected larger organic molecules in disks, and the origins of these high abundances are uncertain. Öberg et al. (2015) and Loomis et al. (2018) both invoke grain-surface chemical pathways to predict sufficient amounts of CH3CN, but these predictions are extremely uncertain due to lack of experimental data on ice nitrile chemistry and desorption.
One important observational constraint is that observed HC3N and CH3CN emissions appear to come from the upper most layer of disks or disk atmospheres (Öberg et al., 2015; Bergner et al., 2018; Loomis et al., 2018). Disk atmospheres are proposed analogs to the more well-studied photon-dominated regions (PDR). Interestingly, complex nitriles have also been detected at unexpectedly high abundances in the deeply characterized PDR, the Horsehead nebula (Gratier et al., 2013). Located in the Orion constellation and seen almost edge-on (Abergel et al., 2003), the Horsehead nebula constitutes a perfect template source to study in detail the physics and chemistry occurring in PDRs. With the WHISPER survey111http://www.iram-institute.org/horsehead/
Horsehead_Nebula/WHISPER.html (Wideband High-resolution Iram-30m Survey at two Positions with Emir Receivers, PI: J. Pety), the chemistry of this PDR has been surveyed at unprecedented detail, both at the edge of the PDR (defined by the HCO peak emission, Gerin et al., 2009), and toward an interior ‘core’ position (defined by the \ceDCO+ peak, Pety et al., 2007). Of interest to this study, Gratier et al. (2013) found that the CH3CN emission is times brighter at the PDR position than in the ‘Core’. Similar to protoplanetary disks, this excess in CH3CN could not be explained by gas-phase chemistry alone, and Gratier et al. (2013) instead suggested that a combination of UV-mediated surface chemistry with surface desorption processes were responsible. However, models developed by Le Gal et al. (2017), coupling the Meudon PDR (Le Bourlot et al., 1993; Le Petit et al., 2006; Le Bourlot et al., 2012) and the Nautilus (Hersant et al., 2009; Ruaud et al., 2016) astrochemical codes, could not reproduce the abundance of CH3CN at the PDR position by about two orders of magnitude when taking these processes into account and advanced alternative explanations that (i) either CH3CN originates from deeper inside of the cloud than previously assumed; or, (ii) the photo-desorption rate is higher and ice photolysis rate lower than those currently implemented in models; or, (iii) critical chemical formation pathways are missing in current astrochemical networks.
Another possible explanation for these high nitrile abundances could be the elemental gas-phase C/O ratio. Indeed, the relative elemental gas-phase abundances of oxygen and carbon are known to strongly impact the chemistry of star-forming regions (van Dishoeck & Blake, 1998). For instance, small hydrocarbons, such as \ceC2H, \ceC3H, \ceC3H2 and \ceC4H, observed in a wide variety of astrophysical objects including PDRs (Fuente et al., 2003; Pety et al., 2005, 2012; Cuadrado et al., 2015; Guzmán et al., 2015) and protoplanetary disks (Dutrey et al., 1997; Fuente et al., 2010; Henning et al., 2010; Qi et al., 2013; Kastner et al., 2015; Guilloteau et al., 2016; Bergin et al., 2016; Kastner et al., 2018; Cleeves et al., 2018; Bergner et al., 2019; Loomis et al., 2019), are believed to be mainly formed from atomic carbon (i.e. \ceC+ and/or C). However, atomic carbon is readily converted into CO. Therefore, depending upon the UV-shielding and C/O ratio, more or less carbon can be locked into CO, hampering the production of hydrocarbons and more complex carbon-containing molecules such as CH3CN and HC3N. In planet-forming disks, a super-solar C/O ratio () explains the hydrocarbon observations well and is reasonably justified by oxygen removal through water formation and other non-volatile O-bearing species (e.g. Hogerheijde et al., 2011; Cleeves et al., 2018).
Here, we explore whether the observed CH3CN and other complex nitriles in the Horsehead PDR can be explained by pure gas-phase chemistry when taking into account a revised understanding of the cosmic-ray (CR) ionization rate, a more complex gas-phase chemistry network, and most importantly, a C-rich environment. We then carry out a smaller study of complex nitrile production in planet-forming disks with elevated C/O ratios. In § 2, we describe the physical and chemical properties we used and developed within the Meudon PDR Code as well as our fiducial protoplanetary disk model. The resulting molecular abundances and their dependence upon the CR ionization rate, C/O ratio, and complex nitrile formation pathways are presented in § 3. In § 4, we discuss the dominant reaction pathways for the four nitrile molecules detected toward the Horsehead nebula - C3N, HC3N, CH3CN and \ceCH3NC - as well as which parameters affect these nitrile abundances. Our conclusions are summarized in § 5.
2 Modeling
For the PDR chemical investigations we use the Meudon PDR Code, tuned to the physical conditions of the Horsehead nebula, and extended to incorporate a more complete gas-phase chemical network for nitriles up to CH3CN and \ceCH3NC in complexity. In the second, smaller part of this paper we use a fiducial protoplanetary disk model previously described in Le Gal et al. (2019) to test whether our nitrile-optimized PDR chemistry can also explain high abundance of complex nitriles in disks.
2.1 PDR Physical structure
The Meudon PDR Code is a 1D astrochemical modeling code which considers a stationary plane-parallel slab of gas and dust illuminated by a radiation field (Le Petit et al., 2006), which can be introduced at will. Assuming a cloud at steady-state, it solves the physical and chemical conditions at different visual extinction throughout the cloud, taking into account radiative transfer from UV absorption, cooling emissions, and heating processes.
Figure 1 displays the typical physical structure we computed for the present study, assuming that the cloud has a fixed pressure of K cm-3 in the PDR region, and a constant density of n the core (Habart et al., 2005), i.e. in our model for mag. The incident radiation upon this cloud is that of Ori, an O 9.5 V star system, which results in an incident FUV intensity upon the cloud of about (i.e the ISRF in Draine’s units erg s-1 cm-2, Draine, 1978; Habart et al., 2005). The physical structure shown here was built considering standard initial gas-phase elemental abundances, see Table 1, i.e. a C/O ratio of (Pety et al., 2005; Goicoechea et al., 2006).
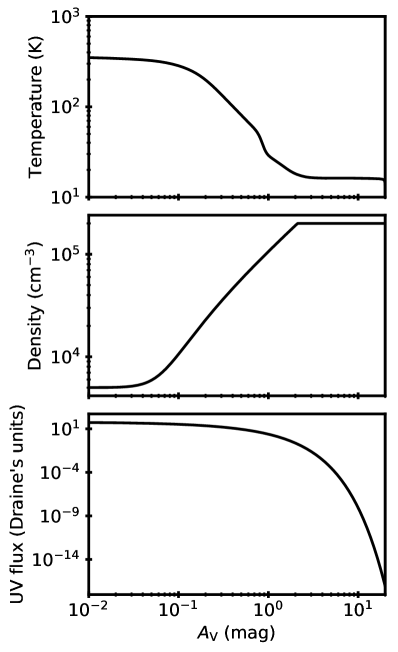
Another parameter to consider is the CR ionization rate . Low energy cosmic rays (10-100 MeV, e.g Grenier et al., 2015) can penetrate deep into dense clouds, producing ions that drive the gas-phase chemistry via fast ion-neutral reactions. Diffuse clouds usually present higher values of than denser clouds (e.g. Indriolo et al., 2015; Le Petit et al., 2016), with s-1 per \ceH2 being a typical dense cloud value (e.g. Goicoechea et al., 2009). We highlight here that what we labeled as in the present study is the CR ionization rate per \ceH2, which corresponds to approximately twice the value of the CR ionization rate per H atom (Glassgold & Langer, 1974). In a previous modeling study of the Horsehead nebula, Rimmer et al. (2012) found that chemical predictions are in better agreement with observations when is allowed to vary across the cloud, considering the following equation adapted from Nath & Biermann (1994) by Rimmer et al. (2012):
| (1) |
For the PDR position, where mag, Eq. (1) gives per \ceH2. In § 3, we test the impact of this higher value of on the nitrile chemistry, by comparison to the canonical value of per \ceH2 used in Pety et al. (2005) and Goicoechea et al. (2006).
Lastly, while the public version of the Meudon PDR Code (v.1.5.2) does not include grain chemistry, it does model the formation of H2 on grains and computes the charge and temperature distribution of grains. In this study, we kept the default grain size distribution, i.e with grain radius from to 0.3 m and their relative abundances described by the MRN distribution (Mathis et al., 1977).
2.2 PDR model Chemistry
| Species | (a) |
|---|---|
| He | 0.1 |
| O(b) | |
| C | |
| N | |
| S | |
| Si | |
| Fe |
Each model was performed using the same initial abundance set as in Pety et al. (2005) and Goicoechea et al. (2006), except for the oxygen abundance that we varied in some models to explore the impact of the C/O ratio on the chemistry (Table 1). We updated and extended the PDR Meudon Code (v.1.5.2) chemical network with 39 species and 913 reactions relevant to the chemistry of C3N, HC3N, and CH3CN, that we extracted from the KIDA database222http://kida.obs.u-bordeaux1.fr/ for most of them. We also extended the chemical network to the chemistry of CH3NC, based on theoretical studies (e.g. Defrees et al., 1985) and the chemistry of its isomer CH3CN (see § 3.3). In total, our network is composed of 191 species and 3616 chemical reactions, including gas-phase bi-molecular reactions (i.e. radiative associations, ion-neutral and neutral-neutral reactions), recombinations with electrons, ionization and dissociation reactions by direct cosmic rays and secondary photons (i.e. photons induced by cosmic rays), and by UV-photons (see Le Petit et al., 2006, for rate formulae details). The critical reactions discussed in this paper are summarized in Table 2, with rates and references.
UV-photo-reactions are expected to play a crucial role in PDR chemistry. The Meudon PDR Code allows the choice between two different methods to compute the photo-reaction rates: 1) if the photo-ionization and/or photo-dissociation cross-sections of the molecule is known, the most accurate approach consists in integrating this cross-section over the radiation field at each given position in the cloud; 2) if the photo-cross-section of the molecule is unknown, an analytical expression as function of the visual extinction is estimated, i.e. considering fixed fitted parameters for each molecules and computing their photo-rates as function of the visual extinction (see for an example Eq. (14) of Heays et al., 2017). We updated the cross-sections of all the molecules available in the Leiden database333https://home.strw.leidenuniv.nl/ewine/photo/ that are included in our chemical network in the Meudon PDR Code (Heays et al., 2017).
2.3 Protoplanetary disk physical structure
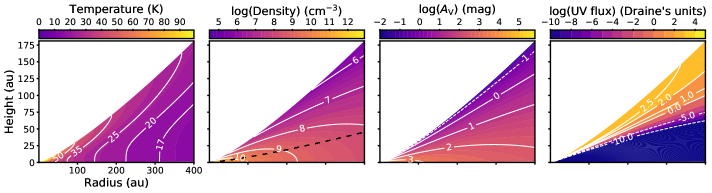
Our fiducial protoplanetary disk astrochemical model is based on the MWC 480 disk model of Le Gal et al. (2019), which consists in a 2D parametric physical structure onto which the chemistry is post-processed (see §2.4). The disk physical structure assumes a disk that is symmetric azimuthally and with respect to the midplane. Thus, it can be described in cylindrical coordinates centered on the inner star along two perpendicular axes characterizing the radius and height in the disk. Figure 2 represents the profiles of the gas temperature, density, visual extinction and UV flux throughout the disk, for which the parameterization is briefly summarized below and further described in Le Gal et al. (2019).
For a given radius from the central star, the vertical temperature profile is computed following the formalism of Rosenfeld et al. (2013) and Williams & Best (2014), originally developed by Dartois et al. (2003):
| (2) |
where and are respectively the midplane and atmosphere temperatures that vary as power law of the radii (Beckwith et al., 1990; Piétu et al., 2007; Le Gal et al., 2019). with the pressure scale height that, assuming vertical static equilibrium, can be expressed as follows:
| (3) |
with the Boltzmann constant, the reduced mass of the gas, the proton mass, the gravitational constant, and the mass of the central star. The midplane temperature is estimated following a simple irradiated passive flared disk approximation (e.g. Chiang & Goldreich, 1997; Dullemond et al., 2001; Huang et al., 2018):
| (4) |
with the stellar luminosity (Andrews et al., 2013), the Stefan-Boltzman constant and a typical flaring angle. The atmosphere temperature, , is based on observational constraints. So here we consider , with =48 K from Guilloteau et al. (2011).
The disk is assumed to be in hydrostatic equilibrium. Thus, for a given vertical temperature profile, the vertical density structure is determined by solving the equation of hydrostatic equilibrium, as described from Eq. (17) to (20) in Le Gal et al. (2019). The surface density of the disk is assumed to follow a simple power law varying as (Shakura & Sunyaev, 1973; Hersant et al., 2009):
| (5) |
where is the surface density at the characteristic radius that can be expressed as function of the mass of the disk, , and its outer radius, :
| (6) |
with here (Guilloteau et al., 2011).
The visual extinction profile is derived from the hydrostatic density profile using the gas-to-extinction ratio of (Wagenblast & Hartquist, 1989), with the vertical hydrogen column density of hydrogen nuclei. This gas-to-extinction ratio assumes a typical mean grain radius size of 0.1 m and dust-to-mass ratio of 0.01, consistent with model assumptions.
Finally, the UV flux profile is computed considering the UV flux impinging the disk convolved with the visual extinction profile. The unattenuated UV flux factor, , at a given radius depends on both the photons coming directly from the central embedded star and on the photons that are downward-scattered by small grains in the upper atmosphere of the disk. Thus, following Wakelam et al. (2016), we consider:
| (7) |
2.4 Protoplanetary disk chemical model
The disk chemistry is computed time-dependently in 1+1D using the gas-grain astrochemical model Nautilus (v.1.1) (Hersant et al., 2009; Wakelam et al., 2016) in three phase mode (Ruaud et al., 2016), i.e. including gas-phase, grain-surface and grain-bulk chemistry (see Le Gal et al., 2019, for more details). First, the chemical evolution of a representative starless dense molecular cloud is modeled up to a characteristic age of years (e.g. Elmegreen, 2000; Hartmann et al., 2001). For this 0D model we use typical constant physical conditions: grain and gas temperatures of 10 K, a gas density of ζ=5×10^-17 _3_3
3 Results
3.1 Impact of cosmic-ray treatment
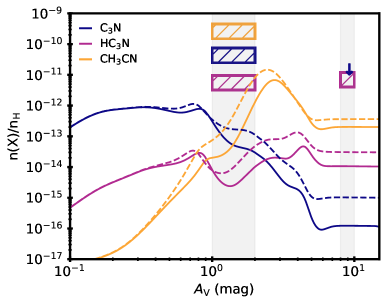
Figure 3 presents the abundances of C3N, HC3N and CH3CN computed with the Meudon PDR Code as function of the visual extinction , for two models. Both models consider our new chemical network and the initial gas-phase elemental abundances prescribed in Pety et al. (2005) and Goicoechea et al. (2006) (see Table 1) but each model uses a different CR ionization rate. The standard model uses the CR ionization rate canonical value of per \ceH2 (Pety et al., 2005; Goicoechea et al., 2006), and the high- model uses a higher CR ionization rate of per \ceH2, as calculated from (Eq. 1). By impacting the ion abundances in molecular clouds, the CR ionization rate indirectly drives the abundances of their daughter neutral molecules (see § 2.1). The nitrile abundances are indeed higher with the high- model than with the standard model, but both models under-predict by several orders of magnitude the abundances observed toward the Horsehead nebula.
Rimmer et al. (2012) showed that a varying across the cloud tends to produce more accurate results. However, for the visual extinctions associated with the PDR region and for molecules of interest studied here, varying across the cloud does not significantly impact the results compared to a constant- model. In the Core region, the varying-versus-constant model abundances are about half an order of magnitude different.
Changing the CR ionization rate also impacts the gas temperature, as shown in the bottom panels of Fig. 4. Typically, increasing shifts the temperature gradient closer to the PDR’s edge. As a result, a higher leading to higher temperatures and thus higher reaction rates, the absolute abundances of nitriles are slightly increased in the PDR with a high- model. In addition, likely due to the shift in temperature, the abundance patterns are shifted outwards (i.e. closer to the illuminated edge of the PDR) in the case of a higher . In summary, while the CR treatment has an impact on the complex nitrile chemistry, increasing nitrile abundances by almost an order of magnitude in the PDR region, the effect is small compared to the mismatch between models and observations (see Fig. 3).
3.2 Impact of the C/O ratio
Major carriers of O and C are expected to freeze out under different conditions. In particular a substantial amount of O can become incorporated into water ice which is one of the least volatile common interstellar molecules, resulting in an elevated C/O ratio in the gas-phase. In order to mimic the differential freeze-out of volatiles on grains, we varied the oxygen gas-phase elemental abundance from to while keeping the carbon abundance fixed. This led to a variation of the C/O ratio from 0.4 to 1.5. The lowest considered O abundance is a factor of two higher than the CO abundance derived in the Horsehead PDR (, Pety et al., 2005), while the highest considered O abundances is below the cosmic O abundance of (Asplund et al., 2009) to (Przybilla et al., 2008). The choice of fixing the carbon elemental abundance and varying the oxygen one, is also justified by the fact that, between these two elements, the elemental gas-phase abundance of oxygen is the less constrained (Jenkins, 2009; Whittet, 2010; Jones & Ysrad, 2019), as discussed in Le Gal et al. (2014).
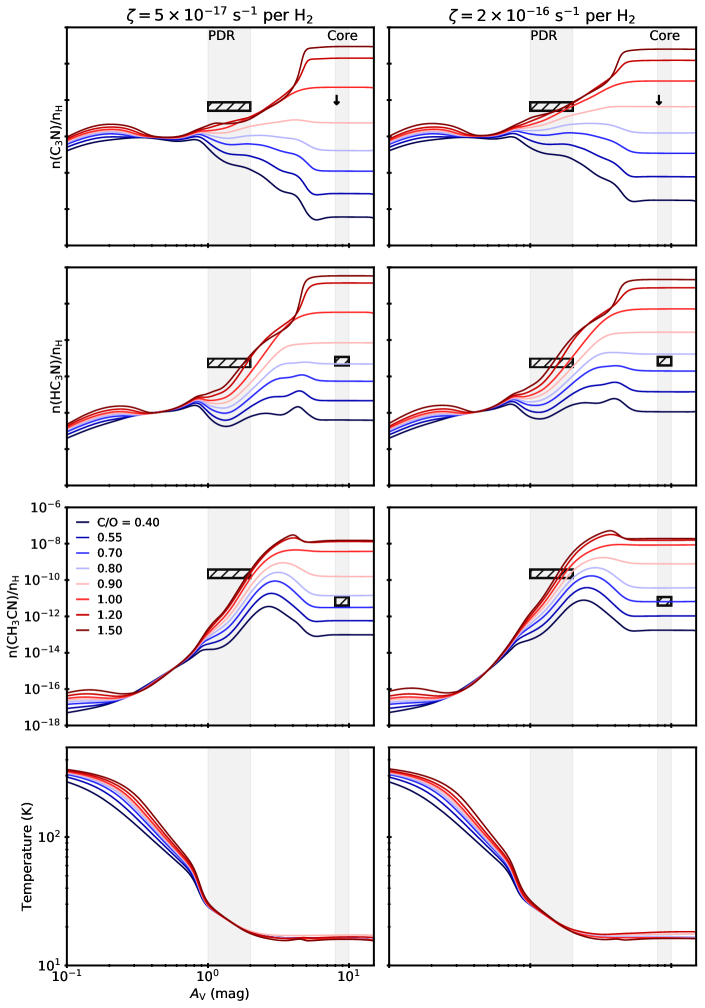
Figure 4 shows the impact of the gas-phase C/O ratio on the abundances of C3N, HC3N and CH3CN and on the gas temperature as function of the visual extinction in our model of the Horsehead nebula. An O-poor chemistry (i.e. a high C/O ratio) results in higher abundances of the three nitriles. For a CR ionization rate of per \ceH2 and a gas-phase C/O ratio in the range , our new gas-phase chemistry model can reproduce the three nitrile observations at the PDR position within an order of magnitude. As for the Core position, our best fit models are found for lower C/O ratios, in the range . This lowering of C/O with increasing visual extinction could be explained by photon-mediated release of refractory carbon into gas phase in the PDR region, and/or the onset of freeze out of carbon species in the core region. Whatever the mechanism, the decrease of C/O with increasing visual extinction suggests that the gas-phase C/O ratio vary across astrophysical objects.
It is also important to mention that the chemical rates used in astrochemical models sometimes present large uncertainties. We ran two additional models to test the impact of such uncertainties on the major reaction rates listed in Table 2 which are driving the complex nitrile chemistry. These additional simulations compute the chemistry with (i) the maximum allowed rates, and (ii) the minimum allowed rates. The results are that the nitrile abundances of interest for this study vary by less than a factor of three in the PDR and Core regions, which is small compared to the more than two orders of magnitude mismatch between observations and models using the standard C/O value. Though this does not constitute a rigorous detailed sensitivity analysis such as those developed for instance by Vasyunin et al. (2004, 2008) and Wakelam et al. (2005, 2006, 2010), our simple analysis suggests that our results are robust.
Since we are mainly interested in the PDR nitrile chemistry, we consider our best-fit model the model with the lowest C/O ratio that reproduces at the PDR position the three complex nitrile abundances shown Fig. 4. The model with per \ceH2 and C/O fulfills these criteria.
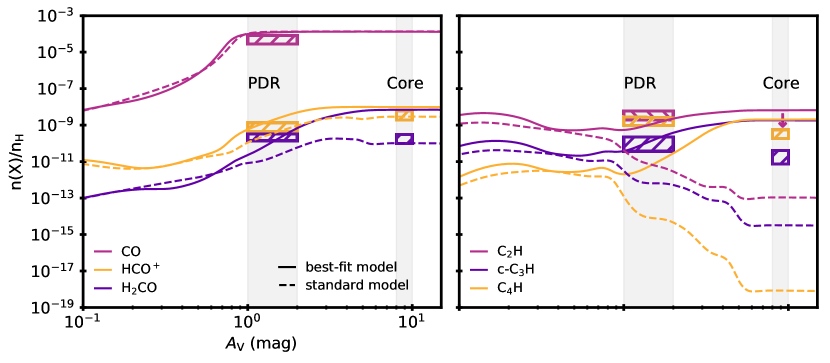
Figure 5 shows the modeled abundances, obtained with our best-fit model, of other typical oxygenated and carbonated molecules that were also observed toward the Horsehead nebula, i.e CO (Pety et al., 2005), HCO+ (Goicoechea et al., 2009), \ceH2CO (Guzmán et al., 2011), and the hydrocarbons C2H, \cec-C3H, and \ceC4H (Pety et al., 2005; Guzmán et al., 2015). For comparison, the standard model results are also presented in the same figure. The C/O variation does not significantly impact the CO abundance throughout the cloud, which is consistent with the fact that CO is the main reservoir of carbon and the carbon elemental abundance is fixed in our models. Our best fit model displays better agreement between model and observations in the PDR for the other O-bearing molecules we consider, \ceH2CO and \ceHCO+.
With regards to the hydrocarbons, our best model better matches the observations at the PDR position, generally by orders of magnitude, compared to the standard model. This is an expected results because atomic O is a main destroyer for small hydrocarbons such as \ceC2H, \cec-C3H and \ceC4H (Millar et al., 1987; Millar & Herbst, 1990). Thus, while C is kept constant, diminishing O increases the hydrocarbon abundances. However, even our best fit model does not fully reproduce the observed abundances (see for instance \ceC4H in Fig. 5), indicative of that the C/O ratio does not provide a complete explanation for the abundant hydrocarbon chemistry in the Horsehead PDR.
Regarding the Core position, our best fit model generally over-predicts the observations, but this might simply be explained by the fact that freeze-out on grains is not included in our model. It could also be that the gas-phase C/O ratio decreases within the nebula, as suggested by the C/O grid results shown in Fig. 4 when compared to the observations in each observed positions.
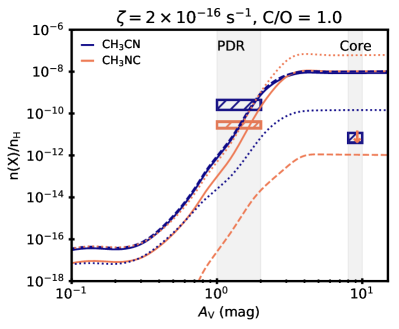
3.3 \ceCH3NC vs \ceCH3CN chemical pathways
Another interesting nitrile molecule to study is the methyl isocyanide (\ceCH3NC), the isomer of methyl cyanide (\ceCH3CN). First detected toward Sgr B2 (Cernicharo et al., 1988; Remijan et al., 2005), \ceCH3NC was also detected toward the Horsehead nebula (Gratier et al., 2013), Orion KL (López et al., 2014), and more recently toward the solar-type binary protostar IRAS 16293-2422 (Calcutt et al., 2018). A few theoretical and experimental studies have investigated the isomers’ chemistry and their abundance ratio (Huntress & Mitchell, 1979; Defrees et al., 1985; Anicich et al., 1995), and converged on the same major gas-phase production pathways for both via the reaction:
| (8) | |||
| (9) |
with and given in Table 2, followed by the dissociative recombinations of both protonated ions \ceCH3NCH+ and its isomer \ceCH3CNH+ to form \ceCH3NC and \ceCH3CN, respectively (see reaction rates in Table 2). However, the branching ratio is poorly constrained and depends on the stabilization processes of the intermediate complex (\ceCH3NCH+)∗ (e.g. Anicich et al., 1995). Due to its lower energy state, \ceCH3CNH+ is found to be the major product of the reaction \ceCH3+ + HCN (9). However, its formation requires the isomerization of the intermediate complex (\ceCH3NCH+)∗, which likely happens due to collisions with a third body. Thus, the ratio between the two isomeric ions depends on the competition between the relaxation and isomerization rates of the intermediary complex. The resulting \ceCH3NCH+/\ceCH3CNH+ ratio was estimated to lie in the range 0.1–0.4 by one theoretical study and assumed to propagate to a \ceCH3NC/\ceCH3CN ratio of 0.1–0.4 via the respective subsequent dissociative recombinations (Defrees et al., 1985).
Here, we investigated the impact of the branching ratios in between the pathways (8) and (9) on the resulting \ceCH3NC/\ceCH3CN ratio in our PDR model. Figure 6 presents the results obtained using our best fit model and three different branching ratios leading to: 100%, 80% and 0% of isomerization. The best fit results are obtained for a branching ratio of 80% (i.e. \ceCH3NC/\ceCH3CN ), in agreement with the theoretical calculation of Defrees et al. (1985). However, to our knowledge the \ceCH3NCH+ dissociative recombination has not been studied yet and even though the rate of the \ceCH3CND+ dissociative recombination was measured (Vigren et al., 2008) its branching ratio remains uncertain (e.g. Plessis et al., 2010, 2012; Loison et al., 2014). It would thus be interesting to study whether the dissociative recombination of \ceCH3CNH+ and \ceCH3NCH+ could lead to disproportionate prevalence of each initial isomer. Further theoretical and experimental studies are therefore needed to assess the validity of our astrochemically motivated branching ratios.
3.4 Complex nitrile production in a protoplanetary disk with a high C/O ratio
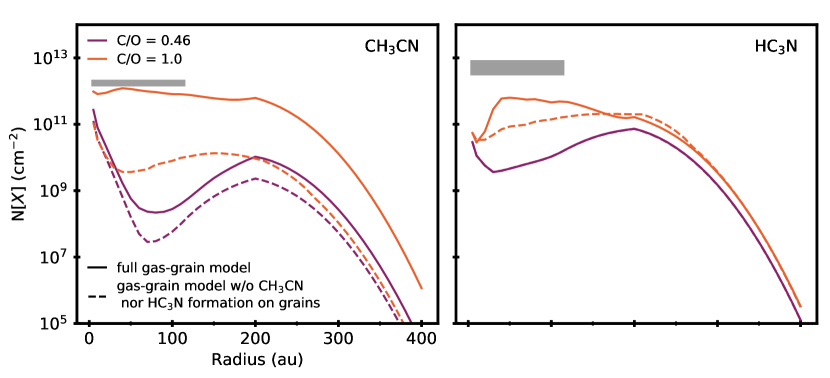
To test if our new understanding of the complex nitrile PDR chemistry can be generalized to disks, we used a fiducial protoplanetary disk astrochemical model, loosely based on the disk around MWC 480, from Le Gal et al. (2019) described § 2.3 and § 2.4. We ran the chemical post-processing for two different C/O ratios: (i) C/O, as in our PDR standard model, and (ii) C/O as in our PDR best fit model. For each of these C/O ratios we ran two disk models, a full gas-grain model and a gas-grain model where CH3CN and HC3N are only formed in the gas phase. The results of this total of four disk models on the abundances of HC3N and CH3CN are shown in Fig. 7. A huge gap is observed from to au in the computed nitrile column densities for the standard C/O ratio disk models, and disappears for higher C/O. The prevalence of grains’ pathway formation increases with C/O, and even becomes negligible in the formation of HC3N for standard C/O. Even though our disk model also includes grain chemistry, the main result from our PDR study holds for disk astrochemistry, i.e. that an elevated C/O ratio better reproduce the nitrile observations. Without any tuning of our disk model, our best-fit model predictions are within an order of magnitude for the CH3CN case. For the HC3N, the results are in agreement, at the order of magnitude level, for the inner 100 au of the disk, where likely most of the emission originates (Bergner et al., 2018).
4 Discussion
4.1 Nitrile formation pathways
In our PDR models, the C3N formation is dominated by the reaction:
| (10) |
with given in Table 2. \cec-C3H being itself mainly produced by the electronic recombination of \cec-C3H2+. Thus, the under-prediction of C3N by our model in the PDR region could be explained by the under-prediction of \cec-C3H (see Fig. 5). Therefore, for a fixed abundance of N, a carbon-enriched medium would enhance the production of C3N. As for its destruction, photo-dissociation dominates in the PDR (see the corresponding reaction rate Table 2), but depending on the C/O ratio two other reactions also participate in the C3N destruction, i.e.:
| (11) | |||
| (12) |
with and given in Table 2. Reaction (11) even becomes the primary destruction pathway of C3N in O-rich (C/O ) PDR. While, a priori, it may seem odd for a photo-dissociation process to not be the primary destruction mechanism in PDR, in our model this is explained by the high concentration of atomic oxygen in this region for low C/O ratios. In O-poor (C/O ) PDR, C3N is primarily destroyed through a combination of photo-dissociation and by atomic carbon (12).
HC3N is formed from a variety of different reactions involving carbon- and nitrogen-containing molecules:
| (13) | |||
| (14) | |||
| (15) | |||
| (16) | |||
| (17) |
with to given in Table 2. Thus, with a lower amount of one of the main hydrocarbon destroyer, atomic O, and a higher amount of ‘free’ carbon in the gas phase, more reaction pathways meaningfully contribute to the formation of HC3N, via these diverse carbon-rich intermediates. HC3N is mainly destroyed by UV-photons up to an mag, via the reaction:
| (18) |
with given in Table 2. For mag, the impact of destruction by dominant ions (e.g. \ceH+, \ceH3+, \ceH3O+, \ceC+, \ceHCO+) gradually increases with the optical depth, since UV-photon penetration diminishes and most of the ion abundances increase. Other destruction pathways involving atomic carbon forming bigger carbon chain molecules appear with increasing optical depth, but these are typically far less common in our grid models and are only relevant in dense clouds with higher carbon abundances.
The formation of CH3CN is dominated by the dissociative recombination of CH3CNH+ with electrons, where CH3CNH+ itself is primarily formed by the radiative association (9) and the following:
| (19) |
with given in Table 2. Similarly, and as already presented in § 3.3, the formation of \ceCH3NC is dominated by the dissociative recombination of CH3NCH+ with electrons, with CH3NCH+ primarily formed by the radiative association (8). \ceCH3+ is formed via successive hydrogenation from \ceC+. HCN and HNC also descend from atomic carbon (Le Gal et al., 2014; Loison et al., 2014). As a consequence, the formations of CH3CN and its isomer \ceCH3NC seem to be guided mostly by the carbon abundance, explaining that the abundance of CH3CN increases with C/O (see Fig. 4). The destruction of the isomers are dominated by photo-dissociation:
| (20) |
with given in Table 2.
To summarize, the enhancement in nitrile abundances appear to be tightly correlated with the C/O ratio. More interestingly however, our study highlights the importance of the relative elemental gas-phase abundances with respect to one another, and emphasizes the indirect role of oxygen in nitrile chemistry. The latter has a dramatic impact on the carbon chemistry in O-rich molecular environments, where most of the carbon is rapidly locked in CO and atomic O is a main destroyer for hydrocarbons, hampering the development of more complex carbon chemistry. In addition, we have shown in § 3.2 that the nitrile abundances increase with (Fig. 4). Indeed, the ionization fraction is directly linked to , which governs the production of ions, such as \ceCH3+, \ceHC3NH+ and \cec-C3H2+, parent molecules of the complex nitriles here under study. \ceCH3+ react with HCN and HNC to produce \ceCH3CNH+, that readily recombines with electrons to form CH3CN; \ceHC3NH+ recombines with electrons to form HC3N (13); and \cec-C3H2+ recombines with electrons to form \cec-C3H which reacts with N to produce C3N (10).
4.2 The role of C/O in PDR and disk atmosphere nitrile chemistry
The strong impact of the C/O ratio on the nitrile chemistry can likely be explained by the fact that in the gas phase, for a fixed amount of C element, O-removal decreases one of the main destruction pathways of hydrocarbons, which are the parent molecules of nitriles. To this effect adds the reactions of small carbon and oxygen species to form CO. Typically, in molecular clouds, most of the carbon hastily reacts with all available oxygen to form CO, effectively removing it from the reaction pathways that build up more complex molecules, such as complex nitriles. O-removal thus leaves more ‘free’ carbon available in the gas phase to form carbon-containing molecules such as hydrocarbons, carbon chains and nitriles. As a comparison, the standard model results in a CO abundance of almost , i.e. quasi all the carbon available in our models (see Table 1), whereas our best-fit model produces a CO abundance of . This leaves ‘free’ carbon to build more complex carbon-containing molecules.
Varying the C/O ratio also impacts the gas temperature for mag, as shown in the last panel row of Fig. 4. An increase in C/O ratio increases the gas temperature. This is due to the fact that, in the present work, we varied the abundance of atomic O to change the C/O ratio, thus reducing one of the main gas coolant in this region of the PDR. To test the impact of varying the C/O ratio via the carbon elemental abundance instead of the oxygen, we ran additional models. The main difference is in the resulting CO abundance. For a fixed C/O ratio, it increases with the amount of carbon. As a consequence, the gas temperature decreases at the edge of the PDR, since CO is another important gas coolant. However, these differences diminish with the increase of the visual extinction and are minor at the PDR position and in particular on the nitrile abundances. Thus, the main results found in the present work on the C/O impact on the Horsehead nebula chemistry is agnostic to whether C or O is varied to achieve a C/O ratio of 1.
In disks, the C/O ratio is also strongly impacting the nitrile chemistry with the additional effect of changing the morphology of the nitrile abundance throughout the disk, as shown in Fig. 7. Whether or not CH3CN forms in gas or through gas-grain chemistry in disks, an elevated C/O in disks also helps in better reproducing the observations. However, grain chemistry seems to be needed to better reproduce the observations, in agreement with Öberg et al. (2015) and Loomis et al. (2018). Our finding of a C/O needed to reproduce the complex nitriles chemistry observed in disk atmospheres is in good agreement with the results of Bergin et al. (2016) that also find that a C/O ratio exceeding unity is required to reproduce the observations of \ceC2H in disks. These authors therefore proposed \ceC2H as probe of C/O-enriched disk layers. Here we propose that complex nitriles could also serve as such probe in both PDR and disks, with the vantage of also probing the internal parts of the latter ( au) as predicted by our models (see Fig. 7). Moreover, the fact that complex nitriles, such as HC3N and CH3CN, are much more commonly observed in disks than O-containing complex molecules, such as \ceCH3OH, highly suggests that organic chemistry is regulated by the C/O ratio and that disk atmosphere chemistry seems to be more generally C-rich than O-rich.
5 Conclusions
We tackled the chemistry of nitriles in PDR, in order to, first, understand the observations found for the nitriles C3N, HC3N, CH3CN and \ceCH3NC toward the Horsehead PDR (Gratier et al., 2013), and second, test if our improved PDR chemistry could help to explain the recent observations of HC3N and CH3CN in disk atmospheres (Öberg et al., 2015; Bergner et al., 2018). To this aim, we extended the chemistry of the Meudon PDR code (v.1.5.2) up to these four nitriles and explored the impact of some key parameters, such as the cosmic-ray ionization rate and the gas-phase elemental C/O ratio, on our modeled nitrile results. Our main conclusions are summarized below:
-
1.
Varying the C/O ratio between 0.4 and 1.5 in a model of the Horsehead PDR results in orders of magnitude changes in nitrile abundances.
-
2.
A gas-phase C/O ratio of can reproduce the C3N, HC3N, CH3CN and \ceCH3NC abundances within an order of magnitude in the Horsehead PDR, without any grain-surface chemistry.
-
3.
The cosmic-ray ionization rate moderately affects the nitrile chemistry through its impact on electrons and hydrocarbon ions (e.g. \ceCH3+, \ceC3H2+). A per \ceH2 better fits the observations than the standard value of per \ceH2.
-
4.
Our best fit PDR model (i.e. with per \ceH2 and C/O) can reproduce both the relative abundances of \ceCH3NC and \ceCH3CN when adopting a branching ratio of 0.8 isomerization for the reaction \ceCH3+ + HCN (9).
-
5.
An elevated C/O ratio () could also be the key for understanding complex nitrile disk chemistry. Using a fiducial protoplanetary disk astrochemical model, we find that disk observations of CH3CN and HC3N are reproduced within an order of magnitude, while our standard model under-predicts the same molecules by 2-3 orders of magnitude.
While the good agreement between observations and models in both a classic PDR and a planet-forming disk, it is important to note that the nitrile grain chemistry is still poorly constrained, and it may contribute to both kinds of regions (e.g. Bertin et al., 2017a, b; Calcutt et al., 2018; Nguyen et al., 2019). Further experiments and theory on nitrile grain surface chemistry and desorption are needed to make progress here. Thus, it would be interesting to add grain chemistry, and in particular grain nitrile chemistry, in the Meudon PDR code to test how the results presented here would be affected. Furthermore, other parameters would be worth testing in future model developments, such as the impact of stellar X-ray irradiation on disk chemistry which could affect its ionization (e.g. Glassgold et al., 1997; Rab et al., 2018; Waggoner & Cleeves, 2019), and the sensitivity of disk chemistry to grain sizes (e.g. Wakelam et al., 2019) as smaller grains provide a higher surface area relative to their volume and thus more reaction sites and also tend to have temperatures closer to that of the gas. In the meantime we note that the strong impact of C/O on nitrile chemistry may enable us to use nitriles to constrain this important parameter in disks and PDR analogs.
\restartappendixnumbering
Appendix A Critical chemical reactions added to the Meudon PDR Code network
| Chemical reactions | rate | range | Ref.(b) | Rate | ||||||||
| () | type(a) | (K) | uncertainties(c) | |||||||||
| Main formation and destruction pathways for \ceCH3CNH+ & \ceCH3CN | ||||||||||||
| \ceCH3+ | \ceHCN | \ceCH3CNH+ | 7.20(-9) | -0.50 | 0.00 | (1) | [1], [2] | |||||
| \ceCH3+ | \ceHCN | \ceCH3CNH+ | 8.00(-11) | -3.00 | 0.00 | (1) | [2], [3] | |||||
| \ceCH3+ | \ceHNC | \ceCH3CNH+ | 9.00(-9) | -0.50 | 0.00 | (1) | [4] | |||||
| \ceCH3CNH+ | \cee- | \ceH | \ceH | \ceH2CCN | 8.00(-8) | -0.50 | 0.00 | (2) | [4] | |||
| \ceCH3CNH+ | \cee- | \ceH | \ceCH3CN | 1.30(-7) | -0.50 | 0.00 | (2) | [4] | ||||
| \ceCH3CNH+ | \cee- | \ceHNC | \ceCH3 | 6.00(-8) | -0.50 | 0.00 | (2) | [4] | ||||
| \ceCH3CNH+ | \cee- | \ceHCN | \ceCH3 | 6.00(-8) | -0.50 | 0.00 | (2) | [4] | ||||
| \ceCH3CN | \ceCN | \ceCH3 | 2.95(-9) | 0.00 | 3.07 | (3) | – | [5] | ||||
| Main formation and destruction pathways for \ceCH3NCH+ & \ceCH3NC | ||||||||||||
| \ceCH3+ | \ceHCN | \ceCH3NCH+ | 1.80(-9) | -0.50 | 0.00 | (1) | [1], [2] | |||||
| \ceCH3+ | \ceHCN | \ceCH3NCH+ | 2.00(-11) | -3.00 | 0.00 | (1) | [2], [3] | |||||
| \ceCH3NCH+ | \cee- | \ceH | \ceCH3NC | 1.30(-7) | -0.50 | 0.00 | (2) | [4](⋆) | ||||
| \ceCH3NCH+ | \cee- | \ceHCN | \ceCH3 | 6.00(-8) | -0.50 | 0.00 | (2) | [4](⋆) | ||||
| \ceCH3NC | \ceCN | \ceCH3 | 2.95(-9) | 0.00 | 3.07 | (3) | – | [5](⋆) | ||||
| Main formation and destruction pathways for \ceC3N | ||||||||||||
| \ceN | \cec-C3H | \ceH | \ceC3N | 1.10(-10) | 0.17 | 0.00 | (2) | [4] | ||||
| \ceC3N | \ceC2 | \ceCN | 5.00(-10) | 0.00 | 1.80 | (3) | – | [6] | ||||
| \ceC3N | \ceO | \ceCO | \ceCCN | 1.00(-10) | 0.00 | 0.00 | (2) | [7] | ||||
| \ceC3N | \ceC | \ceCN | \ceC3 | 2.40(-10) | 0.00 | 0.00 | (2) | [4] | ||||
| Main formation and destruction pathways for \ceHC3N | ||||||||||||
| \ceHC3NH+ | \cee- | \ceH | \ceHC3N | 6.00(-7) | -0.58 | 0.00 | (2) | [8] | ||||
| \ceC4H | \ceN | \ceC | \ceHC3N | 7.00(-11) | 0.17 | 0.00 | (2) | [4] | ||||
| \ceC | \ceH2CCN | \ceH | \ceHC3N | 1.00(-10) | 0.00 | 0.00 | (2) | [4] | ||||
| \ceN | \cec-C3H2 | \ceH | \ceHC3N | 1.00(-11) | 0.00 | 2000.00 | (2) | [8] | ||||
| \ceC2H2 | \ceCN | \ceH | \ceHC3N | 2.72(-10) | -0.52 | 19.00 | (2) | [6] | ||||
| \ceHC3N | \ceCN | \ceC2H | 7.13(-9) | 0.00 | 2.59 | (3) | – | [5] | ||||
References
- Abergel et al. (2003) Abergel, A., Teyssier, D., Bernard, J. P., et al. 2003, A&A, 410, 577
- Andrews et al. (2013) Andrews, S. M., Rosenfeld, K. A., Kraus, A. L., & Wilner, D. J. 2013, ApJ, 771, 129
- Anicich (2003) Anicich, V. G. 2003, JPL Publication 03-19, 1
- Anicich et al. (1995) Anicich, V. G., Sen, A. D., Huntress, Wesley T., J., & McEwan, M. J. 1995, J. Chem. Phys., 102, 3256
- Asplund et al. (2009) Asplund, M., Grevesse, N., Sauval, A. J., & Scott, P. 2009, ARA&A, 47, 481
- Beckwith et al. (1990) Beckwith, S. V. W., Sargent, A. I., Chini, R. S., & Guesten, R. 1990, AJ, 99, 924
- Bergin et al. (2016) Bergin, E. A., Du, F., Cleeves, L. I., et al. 2016, ApJ, 831, 101
- Bergner et al. (2018) Bergner, J. B., Guzmán, V. G., Öberg, K. I., Loomis, R. A., & Pegues, J. 2018, ApJ, 857, 69
- Bergner et al. (2019) Bergner, J. B., Öberg, K. I., Bergin, E. A., et al. 2019, ApJ, 876, 25
- Bertin et al. (2017a) Bertin, M., Doronin, M., Fillion, J. H., et al. 2017a, A&A, 598, A18
- Bertin et al. (2017b) Bertin, M., Doronin, M., Michaut, X., et al. 2017b, A&A, 608, A50
- Calcutt et al. (2018) Calcutt, H., Fiechter, M. R., Willis, E. R., et al. 2018, A&A, 617, A95
- Cernicharo et al. (1988) Cernicharo, J., Kahane, C., Guelin, M., & Gomez-Gonzalez, J. 1988, A&A, 189, L1
- Chapillon et al. (2012) Chapillon, E., Dutrey, A., Guilloteau, S., et al. 2012, ApJ, 756, 58
- Chiang & Goldreich (1997) Chiang, E. I., & Goldreich, P. 1997, ApJ, 490, 368
- Cleeves et al. (2015) Cleeves, L. I., Bergin, E. A., Qi, C., Adams, F. C., & Öberg, K. I. 2015, ApJ, 799, 204
- Cleeves et al. (2018) Cleeves, L. I., Öberg, K. I., Wilner, D. J., et al. 2018, ApJ, 865, 155
- Cuadrado et al. (2015) Cuadrado, S., Goicoechea, J. R., Pilleri, P., et al. 2015, A&A, 575, A82
- Dartois et al. (2003) Dartois, E., Dutrey, A., & Guilloteau, S. 2003, A&A, 399, 773
- Defrees et al. (1985) Defrees, D. J., McLean, A. D., & Herbst, E. 1985, ApJ, 293, 236
- Draine (1978) Draine, B. T. 1978, ApJS, 36, 595
- Dullemond et al. (2001) Dullemond, C. P., Dominik, C., & Natta, A. 2001, ApJ, 560, 957
- Dutrey et al. (1997) Dutrey, A., Guilloteau, S., & Guelin, M. 1997, A&A, 317, L55
- Elmegreen (2000) Elmegreen, B. G. 2000, ApJ, 530, 277
- Fuente et al. (2010) Fuente, A., Cernicharo, J., Agúndez, M., et al. 2010, A&A, 524, A19
- Fuente et al. (2003) Fuente, A., Rodrıguez-Franco, A., Garcıa-Burillo, S., Martın-Pintado, J., & Black, J. H. 2003, A&A, 406, 899
- Gerin et al. (2009) Gerin, M., Goicoechea, J. R., Pety, J., & Hily-Blant, P. 2009, A&A, 494, 977
- Glassgold & Langer (1974) Glassgold, A. E., & Langer, W. D. 1974, ApJ, 193, 73
- Glassgold et al. (1997) Glassgold, A. E., Najita, J., & Igea, J. 1997, ApJ, 480, 344
- Goicoechea et al. (2009) Goicoechea, J. R., Pety, J., Gerin, M., Hily-Blant, P., & Le Bourlot, J. 2009, A&A, 498, 771
- Goicoechea et al. (2006) Goicoechea, J. R., Pety, J., Gerin, M., et al. 2006, A&A, 456, 565
- Gratier et al. (2013) Gratier, P., Pety, J., Guzmán, V., et al. 2013, A&A, 557, A101
- Grenier et al. (2015) Grenier, I. A., Black, J. H., & Strong, A. W. 2015, ARA&A, 53, 199
- Guilloteau et al. (2011) Guilloteau, S., Dutrey, A., Piétu, V., & Boehler, Y. 2011, A&A, 529, A105
- Guilloteau et al. (2016) Guilloteau, S., Reboussin, L., Dutrey, A., et al. 2016, A&A, 592, A124
- Guzmán et al. (2011) Guzmán, V., Pety, J., Goicoechea, J. R., Gerin, M., & Roueff, E. 2011, A&A, 534, A49
- Guzmán et al. (2015) Guzmán, V. V., Pety, J., Goicoechea, J. R., et al. 2015, ApJ, 800, L33
- Habart et al. (2005) Habart, E., Abergel, A., Walmsley, C. M., Teyssier, D., & Pety, J. 2005, A&A, 437, 177
- Harada et al. (2010) Harada, N., Herbst, E., & Wakelam, V. 2010, Astrophysical Journal, 721, 1570
- Hartmann et al. (2001) Hartmann, L., Ballesteros-Paredes, J., & Bergin, E. A. 2001, ApJ, 562, 852
- Heays et al. (2017) Heays, A. N., Bosman, A. D., & van Dishoeck, E. F. 2017, A&A, 602, A105
- Henning et al. (2010) Henning, T., Semenov, D., Guilloteau, S., et al. 2010, ApJ, 714, 1511
- Herbst (1985) Herbst, E. 1985, Astrophysical Journal, 291, 226
- Hersant et al. (2009) Hersant, F., Wakelam, V., Dutrey, A., Guilloteau, S., & Herbst, E. 2009, A&A, 493, L49
- Hogerheijde et al. (2011) Hogerheijde, M. R., Bergin, E. A., Brinch, C., et al. 2011, Science, 334, 338
- Huang et al. (2018) Huang, J., Andrews, S. M., Dullemond, C. P., et al. 2018, arXiv e-prints, arXiv:1812.04041
- Hunter (2007) Hunter, J. D. 2007, Computing in Science Engineering, 9, 90
- Huntress & Mitchell (1979) Huntress, W. T., J., & Mitchell, G. F. 1979, ApJ, 231, 456
- Indriolo et al. (2015) Indriolo, N., Neufeld, D. A., Gerin, M., et al. 2015, ApJ, 800, 40
- Jenkins (2009) Jenkins, E. B. 2009, ApJ, 700, 1299
- Jones & Ysrad (2019) Jones, A. P., & Ysrad, N. 2019, arXiv e-prints, arXiv:1906.01382
- Jones et al. (2001–) Jones, E., Oliphant, T., Peterson, P., et al. 2001–, SciPy: Open source scientific tools for Python, , . http://www.scipy.org/
- Kastner et al. (2015) Kastner, J. H., Qi, C., Gorti, U., et al. 2015, ApJ, 806, 75
- Kastner et al. (2018) Kastner, J. H., Qi, C., Dickson-Vandervelde, D. A., et al. 2018, ApJ, 863, 106
- Le Bourlot et al. (2012) Le Bourlot, J., Le Petit, F., Pinto, C., Roueff, E., & Roy, F. 2012, A&A, 541, A76
- Le Bourlot et al. (1993) Le Bourlot, J., Pineau Des Forets, G., Roueff, E., & Flower, D. R. 1993, A&A, 267, 233
- Le Gal et al. (2017) Le Gal, R., Herbst, E., Dufour, G., et al. 2017, A&A, 605, A88
- Le Gal et al. (2014) Le Gal, R., Hily-Blant, P., Faure, A., et al. 2014, A&A, 562, A83
- Le Gal et al. (2019) Le Gal, R., Öberg, K. I., Loomis, R. A., Pegues, J., & Bergner, J. B. 2019, ApJ, 876, 72
- Le Petit et al. (2006) Le Petit, F., Nehmé, C., Le Bourlot, J., & Roueff, E. 2006, ApJS, 164, 506
- Le Petit et al. (2016) Le Petit, F., Ruaud, M., Bron, E., et al. 2016, A&A, 585, A105
- Loison et al. (2014) Loison, J.-C., Wakelam, V., & Hickson, K. M. 2014, MNRAS, 443, 398
- Loison et al. (2017) Loison, J.-C., Agúndez, M., Wakelam, V., et al. 2017, MNRAS, 470, 4075
- Loomis et al. (2019) Loomis, R., Oberg, K. I., Andrews, S., & et al. 2019, submitted to ApJ
- Loomis et al. (2018) Loomis, R. A., Cleeves, L. I., Öberg, K. I., et al. 2018, ApJ, 859, 131
- López et al. (2014) López, A., Tercero, B., Kisiel, Z., et al. 2014, A&A, 572, A44
- Mathis et al. (1977) Mathis, J. S., Rumpl, W., & Nordsieck, K. H. 1977, ApJ, 217, 425
- McKinney (2010) McKinney, W. 2010, in Proceedings of the 9th Python in Science Conference, ed. S. van der Walt & J. Millman, 51 – 56
- Millar & Herbst (1990) Millar, T. J., & Herbst, E. 1990, MNRAS, 242, 92
- Millar et al. (1987) Millar, T. J., Leung, C. M., & Herbst, E. 1987, A&A, 183, 109
- Nath & Biermann (1994) Nath, B. B., & Biermann, P. L. 1994, MNRAS, 270, L33
- Nguyen et al. (2019) Nguyen, T., Fourré, I., Favre, C., et al. 2019, A&A, 628, A15
- Öberg et al. (2015) Öberg, K. I., Guzmán, V. V., Furuya, K., et al. 2015, Nature, 520, 198
- Patel et al. (2015) Patel, B. H., Percivalle, C., Ritson, D. J., Duffy, C. D., & Sutherland, J. D. 2015, Nature Chemistry, 7, 301 EP . https://doi.org/10.1038/nchem.2202
- Pety et al. (2007) Pety, J., Goicoechea, J. R., Hily-Blant, P., Gerin, M., & Teyssier, D. 2007, A&A, 464, L41
- Pety et al. (2005) Pety, J., Teyssier, D., Fossé, D., et al. 2005, A&A, 435, 885
- Pety et al. (2012) Pety, J., Gratier, P., Guzmán, V., et al. 2012, A&A, 548, A68
- Piétu et al. (2007) Piétu, V., Dutrey, A., & Guilloteau, S. 2007, A&A, 467, 163
- Plessis et al. (2012) Plessis, S., Carrasco, N., Dobrijevic, M., & Pernot, P. 2012, Icarus, 219, 254
- Plessis et al. (2010) Plessis, S., Carrasco, N., & Pernot, P. 2010, J. Chem. Phys., 133, 134110
- Powner et al. (2009) Powner, M. W., Gerland, B., & Sutherland, J. D. 2009, Nature, 459, 239 EP . http://dx.doi.org/10.1038/nature08013
- Przybilla et al. (2008) Przybilla, N., Nieva, M.-F., & Butler, K. 2008, ApJ, 688, L103
- Qi et al. (2013) Qi, C., Öberg, K. I., Wilner, D. J., & Rosenfeld, K. A. 2013, ApJ, 765, L14
- Rab et al. (2018) Rab, C., Güdel, M., Woitke, P., et al. 2018, A&A, 609, A91
- Remijan et al. (2005) Remijan, A. J., Hollis, J. M., Lovas, F. J., Plusquellic, D. F., & Jewell, P. R. 2005, ApJ, 632, 333
- Rimmer et al. (2012) Rimmer, P. B., Herbst, E., Morata, O., & Roueff, E. 2012, A&A, 537, A7
- Rosenfeld et al. (2013) Rosenfeld, K. A., Andrews, S. M., Wilner, D. J., Kastner, J. H., & McClure, M. K. 2013, ApJ, 775, 136
- Ruaud et al. (2016) Ruaud, M., Wakelam, V., & Hersant, F. 2016, MNRAS, 459, 3756
- Shakura & Sunyaev (1973) Shakura, N. I., & Sunyaev, R. A. 1973, A&A, 24, 337
- Sutherland (2016) Sutherland, J. D. 2016, Angewandte Chemie International Edition, 55, 104. https://onlinelibrary.wiley.com/doi/abs/10.1002/anie.201506585
- van der Walt et al. (2011) van der Walt, S., Colbert, S. C., & Varoquaux, G. 2011, Computing in Science and Engineering, 13, 22
- van Dishoeck & Blake (1998) van Dishoeck, E. F., & Blake, G. A. 1998, ARA&A, 36, 317
- Vasyunin et al. (2008) Vasyunin, A. I., Semenov, D., Henning, T., et al. 2008, ApJ, 672, 629
- Vasyunin et al. (2004) Vasyunin, A. I., Sobolev, A. M., Wiebe, D. S., & Semenov, D. A. 2004, Astronomy Letters, 30, 566
- Vigren et al. (2008) Vigren, E., Kamińska, M., Hamberg, M., et al. 2008, Physical Chemistry Chemical Physics (Incorporating Faraday Transactions), 10, 4014
- Wagenblast & Hartquist (1989) Wagenblast, R., & Hartquist, T. W. 1989, MNRAS, 237, 1019
- Waggoner & Cleeves (2019) Waggoner, A. R., & Cleeves, L. I. 2019, arXiv e-prints, arXiv:1908.08048
- Wakelam et al. (2019) Wakelam, V., Chaietillon, E., Dutrey, A., et al. 2019, MNRAS, 484, 1563
- Wakelam et al. (2010) Wakelam, V., Herbst, E., Le Bourlot, J., et al. 2010, A&A, 517, A21
- Wakelam et al. (2006) Wakelam, V., Herbst, E., & Selsis, F. 2006, A&A, 451, 551
- Wakelam et al. (2016) Wakelam, V., Ruaud, M., Hersant, F., et al. 2016, A&A, 594, A35
- Wakelam et al. (2005) Wakelam, V., Selsis, F., Herbst, E., & Caselli, P. 2005, A&A, 444, 883
- Wakelam et al. (2012) Wakelam, V., Herbst, E., Loison, J. C., et al. 2012, ApJS, 199, 21
- Whittet (2010) Whittet, D. C. B. 2010, ApJ, 710, 1009
- Williams & Best (2014) Williams, J. P., & Best, W. M. J. 2014, ApJ, 788, 59