Memory Centric Characterization and Analysis of SPEC CPU2017 Suite1
Abstract.
In this paper we provide a comprehensive, memory-centric characterization of the SPEC CPU2017 benchmark suite, using a number of mechanisms including dynamic binary instrumentations, measurements on native hardware using hardware performance counters and OS based tools.
We present a number of results including working set sizes, memory capacity consumptions and, memory bandwidth utilization of various workloads. Our experiments reveal that the SPEC CPU2017 workloads are surprisingly memory intensive, with approximately 50% of all dynamic instructions being memory intensive ones. We also show that there is a large variation in the memory footprint and bandwidth utilization profiles of the entire suite, with some benchmarks using as much as 16 GB of main memory and up to 2.3 GB/s of memory bandwidth.
We also perform instruction execution and distribution analysis of the suite and find that the average instruction count for SPEC CPU2017 workloads is an order of magnitude higher than SPEC CPU2006 ones. In addition, we also find that FP benchmarks of the SPEC 2017 suite have higher compute requirements: on average, FP workloads execute three times the number of compute operations as compared to INT workloads.
1. Introduction
| Benchmark | Domain | Inputs |
|---|---|---|
| perlbench | Perl Interpreter | Interprets SpamAssassin, MHonArc, and an internal script |
| gcc | GNU C Compiler | C source code file compiled with different optimizations |
| mcf | Route Planning | Solves large-scale minimum cost flow problem |
| omnetpp | Discrete Event Simulation | Simulates a 10 Gb Ethernet network |
| xalancbmk | XML to HTML Conversion | XML documents to HTML, text, and other XML types |
| x264 | Video Compression | Compresses portions of Blender Open Movie Project’s ”Big Buck Bunny” |
| deepsjeng | Artificial Intelligence | Plays Chess variants employing alpha-beta tree search |
| leela | Artificial Intelligence | Computer Go featuring Monte Carlo tree search |
| exchange2 | Artificial Intelligence | Recursively solves 27 9x9 Sudoku puzzles |
| xz | General Data Compression | Tar archive, database of ClamAV signatures and a file with text and image data |
| bwaves | Explosion Modeling | Simulates blast waves in 3D |
| cactuBSSN | Physics: Relativity | Uses BSSN formulation of Einstein equation and employs finite differencing in space |
| namd | Molecular Dynamics | 92224 atom simulation of Apolipoprotein A-I |
| parest | Biomedical Imaging | 3D reconstruction of interior of a body using multiple 2D observations |
| povray | Ray Tracing | Renders a 2560x2048 pixel image of a chess board with pieces |
| lbm | Fluid Dynamics | Simulates flow of an incompressible fluid in 3D |
| wrf | Weather Forecasting | Simulates the January 2000 North American Blizzard |
| blender | 3D Rendering and Animation | Simulates reduced version of the Weybec Crazy Glue shot 3 data set to image |
| cam4 | Atmosphere Modeling | Atmospheric Component of the NCAR Earth System |
| pop2 | Wide-scale Ocean Modeling | Ocean Component of the NCAR Earth System |
| imagick | Image Manipulation | Performs various transformations on input images |
| nab | Molecular Dynamics | Models molecules with varying number of atoms |
| fotonik3d | Computational Electromagnetics | Employs finite-difference time-domain method for the Maxwell equations |
| roms | Regional Ocean Modeling | A free-surface, hydrostatic, primitive equation model |
The study of computer architecture and system design depends on the availability of new workloads that are able to faithfully represent the contemporary and future applications of a given vertical. In the CPU design domain Standard Performance Evaluation Corporation (SPEC) has been releasing the SPEC CPU suite for close to three decades now, starting in 1992. These benchmarks have become the standard for any researcher or commercial entity wishing to benchmark their architecture or design against existing ones.
The latest offering of SPEC CPU suite, SPEC CPU 2017, was released in June 2018 (Bucek et al., 2018), ending a decade long wait for a new set of CPU benchmarks – the version before this was released in 2006. SPEC CPU 2017 retains a number of the benchmarks from previous iterations, but has also added many new ones to reflect the changing nature of applications. The 2017 suite has added a lot of excitement in the community with researchers already working on characterizing the set of workloads to figure out system bottlenecks (Limaye and Adegbija, 2018; Panda et al., 2018).
In the last decade, main memory, typically made of Dynamic Random Access Memory (DRAM) in most contemporary systems, has become a first class component of the compute system design space. The last decade has seen a renewed interest in the architectural design space exploration of main memory, including novel additions to the existing interfaces and architecture (JEDEC, DDR3, DDR4, DDR5) (Ahn et al., 2015; Udipi et al., 2010; Liu et al., 2012; Hassan et al., 2016). Not only this, exploration of emerging memory technologies like Phase Change Memory, MRAM etc., to find their space in the memory hierarchy has also been carried out (Lee et al., 2009; Jin et al., 2014). To that end, a number of works have carried out these explorations for using emerging memories in both the cache and main memory architectures (Awasthi et al., 2012; Zhang and Li, 2009; Kültürsay et al., 2013; Xu et al., 2011; Wu et al., 2009).
SPEC 2006 (Henning, 2006) has played a very important part in these explorations. The SPEC suites have had a set of memory intensive workloads (e.g. mcf). Innovations to cache and memory hierarchies have been tested using these workloads by either (i) selecting individual workloads from the suite, or (ii) creating workload mixes, with varying types of memory behavior (also known as multi-programmed workloads). This was made possible by the already characterized memory behavior patterns of different workloads in the SPEC 2006 suite (Jaleel, 2010).
However, with SPEC CPU2017 being a relatively new offering, there is no existing work that characterizes the memory hierarchy behavior of the suite. In this work, we wish to bridge this existing gap in literature. As a result, we make the following important contributions in this paper:
-
(1)
Across the SPEC CPU2017 suite, we provide a holistic characterization of the dynamic instruction execution profiles of different workloads, for both Rate and Speed categories, and observe that most workloads have a large number of memory related operations: close to 50% across the suite. We also provide an opcode level classification of workloads.
-
(2)
Most importantly, we provide a detailed analysis of the memory behavior of various benchmarks, using a combination of dynamic instrumentation tools (Pin/Pintools), hardware performance counters and operating system level tools to report the overall working set size, memory bandwidth consumption and memory resident working set sizes of different workloads, respectively.
The rest of the paper is organized as follows. Section 2 gives a background of CPU2017 benchmarks. Section 3 proposes the methodology used to characterize the benchmarks. Section 4 and 5 analyses the benchmarks at an instruction and memory level, respectively. Section 6 discusses the benchmarks which are newly added to the SPEC CPU suite. Finally, we discuss the related works in Section 7 and conclude in Section 8.
2. SPEC CPU2017
SPEC CPU is a widely acknowledged suite of compute intensive benchmarks, which tests processor’s, memory system’s and compiler’s performance. A number of versions of SPEC have been released over the years, with the latest version, released in 2017, and aptly named, SPEC CPU2017. CPU2017 (CPU, [n. d.]a) considers state-of-the-art applications, organizing 43 benchmarks into four different sub-suites: 10 rate integer (INTRate), 10 speed integer (INTSpeed), 13 rate floating point (FPRate) and 10 speed floating point (FPSpeed). The speed and rate suites vary in workload sizes, compile flags and run rules. SPECspeed measures the time for completion by running a single copy of each benchmark, with an option of using multiple OpenMP threads. Hence, speed is a measure of single thread performance, typically measured by metrics like IPC (Instructions Per Cycle). On the other hand, SPECrate measures the throughput of the overall chip, with possibly multiple cores, by running multiple, concurrent copies of the same benchmark with OpenMP disabled. Most applications have both rate and speed versions (denoted as 5nn.benchmark_r and 6nn.benchmark_s, respectively), except for namd, parest, povray and blender, which only have the rate versions, and pop2, which only has the speed version. Similar to SPEC CPU2006, SPEC CPU2017 has been provided with three input sets: test (to test if executables are functional), train (input set built using feedback-directed optimization and used for training binaries), and ref (timed data set of the real applications, which is intended for a reportable run).
CPU2017 benchmarks and their input sets are described in Table 1. Benchmarks from perlbench to xz are integer, while the rest are floating point applications. Workloads are modified to compress I/O operations other than file read/write as the intent is to measure the compute intensive portion of a real application, while minimizing I/O, thereby focusing on the performance of the CPU, memory and the compiler. SPEC CPU benchmarks are distributed as source code and must be compiled, which raises the question that how must they be compiled? There exists many possibilities ranging from debug, no-optimize to a highly customized optimization. Any point in between would result in different results than others. For CPU2017, SPEC has chosen to allow two points in the range: base, where all modules of a given language in a suite must be compiled using the same flags, in the same order and peak which allows greater flexibility in order to achieve better performance. For peak, different compiler options may be used for each benchmark, and feedback-directed optimization is allowed.
3. Methodology
| Model | 40-core Intel Xeon E5-2698 v4 |
|---|---|
| CPU Frequency | 2.2GHz |
| L1i cache | 8-way, 32 KB |
| L1d cache | 8-way, 32 KB |
| L2 cache | 8-way, 256 KB |
| L3 cache | Shared 20-way, 50 MB |
| Cache line size | 64 Bytes |
| Main Memory | 505 GB, DDR4 |
| Dynamic Frequency Scaling | On |
To study the characteristics of CPU2017 workloads, we used a number of tools to analyse their behavior. The analysis in this paper is based on the x86_64 instruction set. The binaries for the workloads were created using the default, SPEC recommended compiler flags (CPU, [n. d.]b) (gcc -O3), using compilation scripts which ship with CPU 2017. Speed workloads are compiled to use 4 OpenMP threads, while rate workloads were executed with a single instance of the benchmark. We use Pin (Luk et al., 2005), a dynamic binary instrumentation framework available for both 32 and 64 bit versions of the instruction set. Pin provides a rich set of APIs that can be used to study various characteristics of program behavior at the Instruction Set Architecture (ISA) level. These APIs are used to create a number of tools, called Pintools, with each capable of carrying out a certain type of analysis. In this study, we use the following pintools: ldst (dynamic register/memory operand pattern profiler), opcodemix (dynamic opcode mix profiler), and dcache (a functional simulator of data cache).
For gathering information about workload behavior with real hardware, we use perf, a performance analysis tool (De Melo, 2010), and ps (ps, [n. d.]), an OS utility to collect process level memory related data for various workloads. Table 2 presents the configuration of the machine used to run experiments for Pin-based, hardware-counter and system-level experimentation and data collection. All the benchmarks were executed till completion. 627.cam4_s faced a runtime error and hence is deprecated from this study.
4. Instruction Profile
Analysis of the instruction profiles is a good mechanism for understanding a benchmark’s behavior and locating potential sources of bottlenecks in hardware and software. To that end, we first study the dynamic instruction count, instruction distribution and the runtime performance of CPU 2017 workloads.
Dynamic Instruction Count:
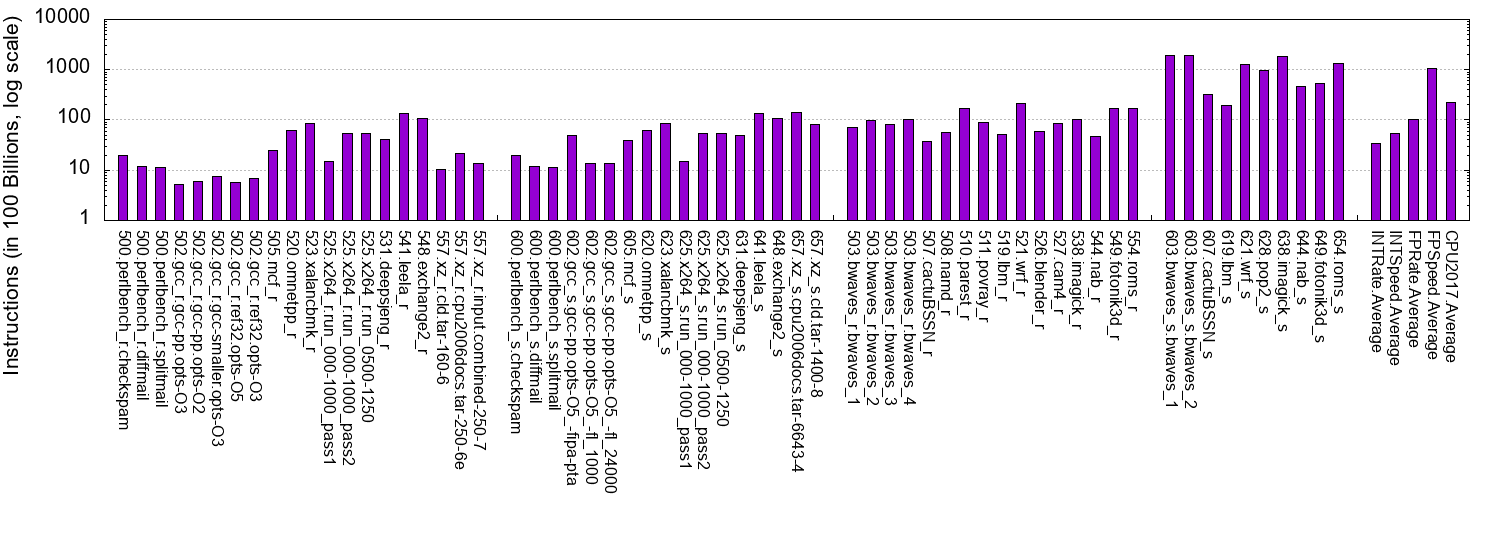
Figure 1 depicts the dynamic instruction count for each benchmark in the suite. Each benchmark is divided into its various input workloads, and presented in order of their sub-suites, with an indication of sub-suite average at the end. These results have been obtained using perf’s hardware event instructions. We note that the average instruction count for the SPEC CPU2017 is 22.19 trillion (1.4 Quadrillion in total) which is about an order of magnitude higher than the SPEC CPU2006 (Henning, 2006; Jaleel, 2010). It is observed that the FPSpeed suite have massive dynamic instruction count with respect to others, with bwaves_s reaching as high as 382 trillion. In general, Speed workloads have 1.5-10 times more instructions than the corresponding Rate ones, and floating point (FP) workloads have 3-17 times than the integer (INT) workloads.
Dynamic Instruction Count: Figure 1 depicts the dynamic instruction count, a count of total number of instructions executed by the workload. Each benchmark is divided into its constituent workloads, depending on the input set. These results were collected using perf’s hardware event instructions. We note that the average instruction count for SPEC CPU2017 workloads is 22.19 trillion (1.4 quadrillion in total) which is an order of magnitude higher than the SPEC CPU2006 (Henning, 2006; Jaleel, 2010). We also observe that the FPSpeed suite has a much larger dynamic instruction count with respect to others sub-suites, with bwaves_s executing as many as 382 trillion instructions. In general, Speed workloads have 1.5-10 more instructions than the corresponding Rate ones, and floating point (FP) workloads have 3-17 times than the integer (INT) workloads. These observations point to the general increase in the complexity of SPEC CPU workloads over the years.
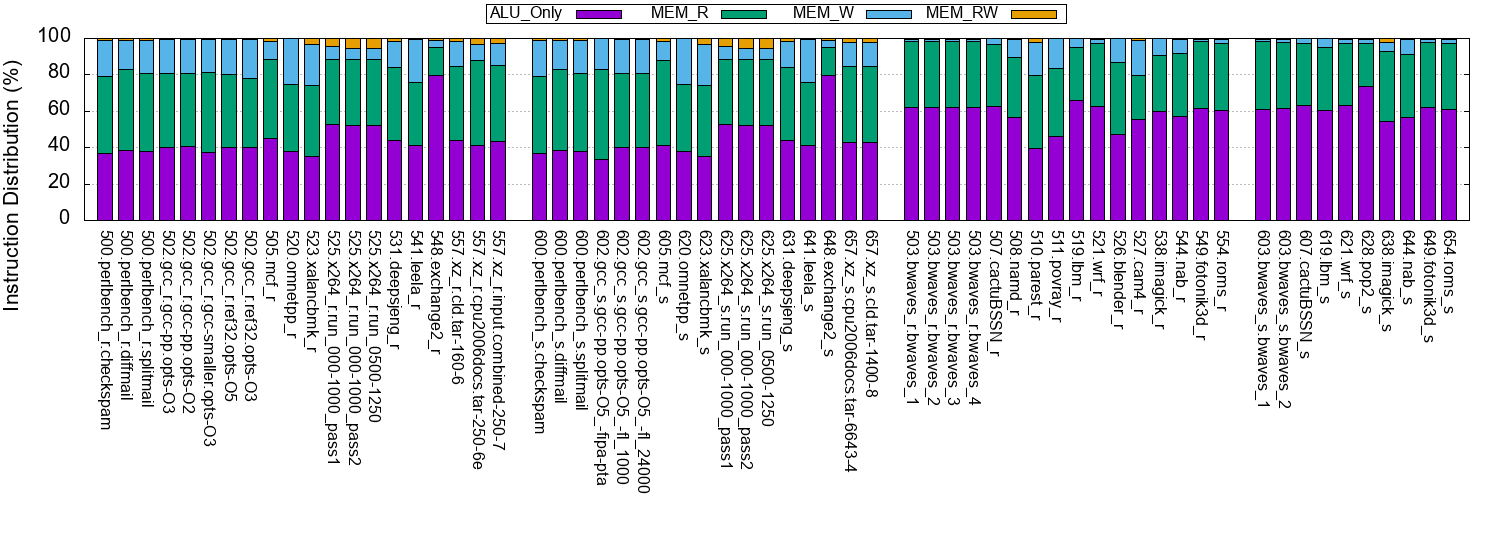
Instruction Distribution: To better understand the distribution of instructions that access memory, we present the instruction distribution for workloads in Figure 2\alphalph. These experiments were conducted using the ldst Pintool. Some benchmarks like perlbench, x264, bwaves and a few others have multiple input files, which are executed in succession to complete the run. We report the results of each of these runs individually, leading to multiple bars for a benchmark. To keep the discussion simple, we divide the instructions into four broad categories: instructions that do not refer memory (called ALU Only in the figure), instructions that have one or more source operands in memory (called MEM_R), instructions whose the destination operand is in memory (MEM_W), and instructions whose source and destination operands are in memory (MEM_RW)111Memory-to-memory instructions like movs in x86 are billed under the MEM_RW bucket..
This broad classification allows us to compare the types of instructions that are executed by each benchmark, and provides a first order insight into the memory behavior of these benchmarks. We make a few interesting observations. First, irrespective of the input sets provided, the instruction distribution of a benchmark, across these four buckets doesn’t change drastically. This is evidenced by the instruction distributions of all benchmarks that have multiple input files (perlbench, gcc, x264, xz, bwaves). Also, the instruction distribution across the four buckets doesn’t change significantly, irrespective of whether the speed or the rate version of the benchmark is being examined.
Most benchmarks have a fairly balanced percentage of instructions that fall under either one of the MEM_R/ MEM_W/ MEM_RW or the ALU_Only buckets. However, a few exceptions like exchange2 (AI) and pop2 (Ocean Modeling) exist where the contribution of ALU_Only operations is fairly significant at 79.6% and 73.5%, respectively. Floating point workloads also exhibit a lot of compute activity, with 60% ALU_Only instructions. However, on an average across the benchmark suite, SPECInt sub-suite exhibits executes more memory related instructions than the SPECFP one. Our observations are consistent with the earlier versions of SPEC: CPU2006 and CPU2000 (Jaleel, 2010).
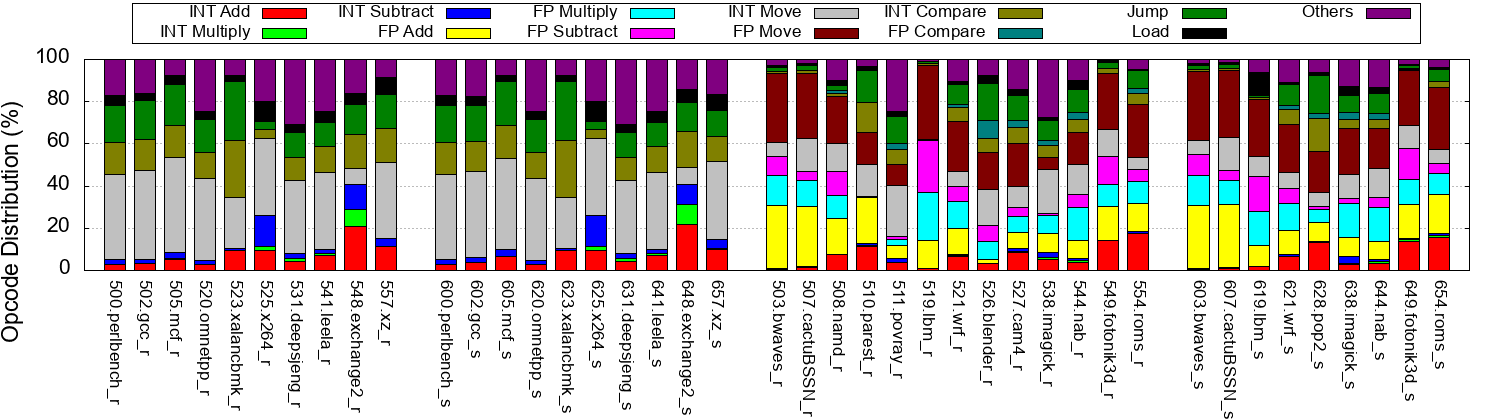
In order to get insights regarding the type of operations done by these instructions, we profile the benchmarks to report instruction level classification. Results, collected with the help of opcodemix pintool, are presented in Figure 2\alphalph. The results for one benchmark were averaged across all their input files. We observe that FP workloads, have approximately three times the number of arithmetic operations than the INT workloads. In addition, we observe that a majority of the memory operations in both integer and floating point sub-suites are dominated by their respective move operations. We also observe that memory instructions for both Int and FP benchmarks are predominantly read-only, which is consistent with the high-level results obtained in Figure 2\alphalph.
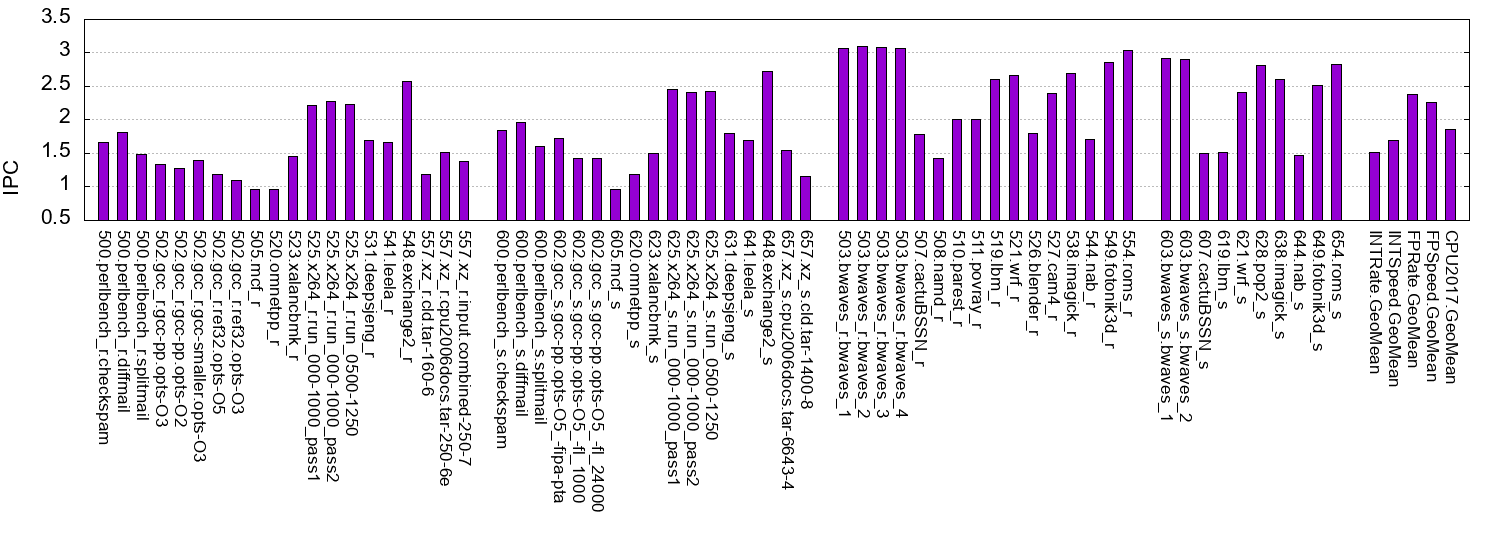
Performance: We report the performance of the workloads in terms of instruction per cycle (IPC) in Figure 3, on the system outlined in Table 2. IPC is calculated as the ratio of the hardware events instructions and cpu-cycles, obtained using perf. To account for variations in execution time due to variables that cannot be controlled, each experiment is run three times and the average values are reported. Order of benchmark execution is shuffled between repetitions to mitigate measurement bias. Rest of the experiments in the paper are not repeated. We observe that FP workloads have better IPC than INT ones. However, we do note that applications that execute a significant number of memory related operations (e.g. cactuBSSN_s, lbm_s, xz_.cld.tar-1400-8 and mcf) and have larger working sets, requiring more accesses to the memory hierarchy, have lower IPCs.
5. Memory Behavior
5.1. Spatial Locality Behavior
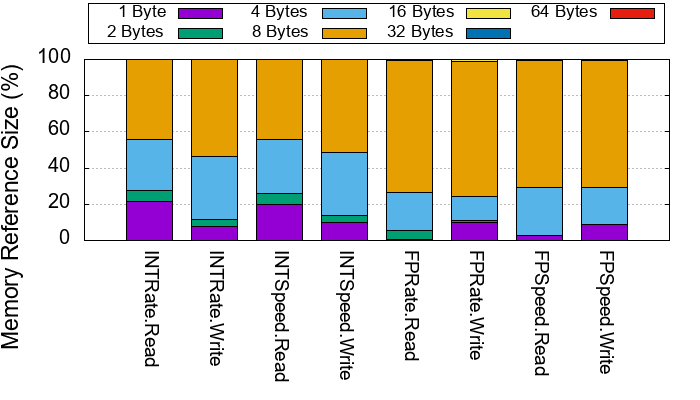
Next, we observe the spatial locality characteristics of the workloads by observing benchmarks using opcodemix Pintool. Opcodemix helps analyse of the amount and size of data touched by any memory operation that requires to traverse the cache and memory hierarchy. We classify the instructions based on the amount of data that they access during these operations. In the interest of space, we present results averaged across the suites in Figure 4. There is a broad range of data size granularities accessed by instructions, from 1 Byte to 64 Bytes, with the latter being the cacheline size as well. However, two important figures stand out. First, the majority of the accesses (64%) are for an exact 8 Byte granularity. Second, 99.5% of accesses (reads and writes) are for 8 Bytes or smaller access granularities. The number of accesses to larger data granularities is extremely small, and holds true across the suite. This indicates limited spatial data locality at the individual instruction level.
5.2. Working Set Sizes
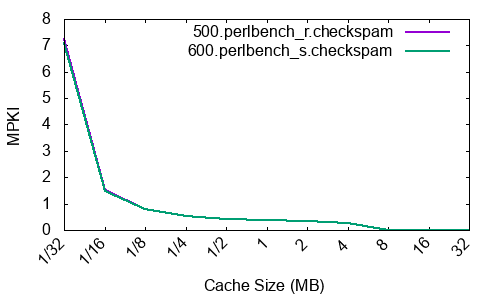
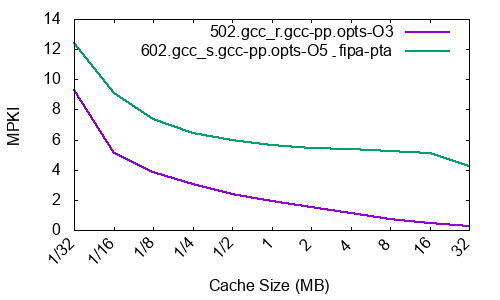
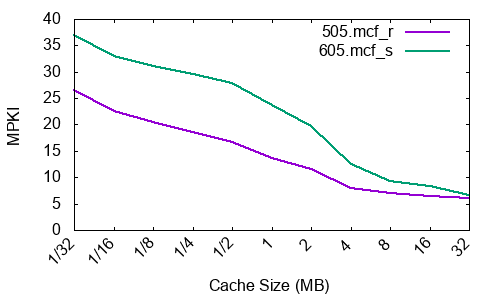
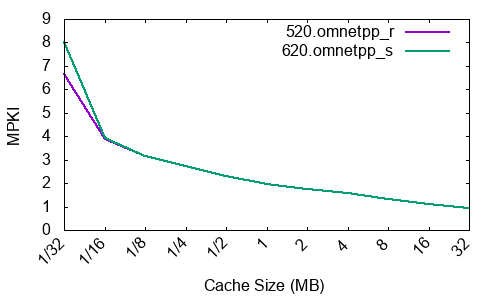

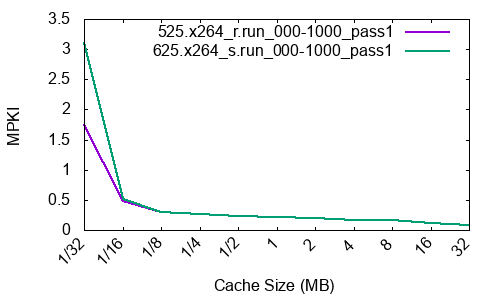
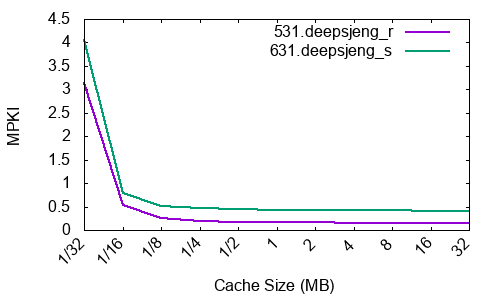
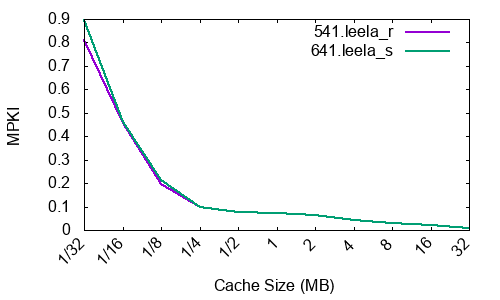
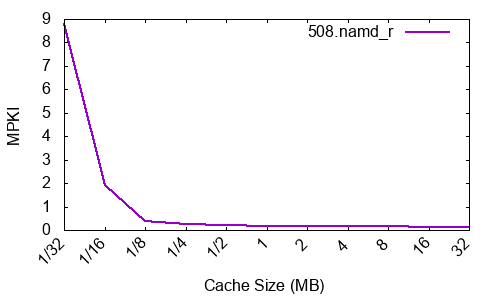
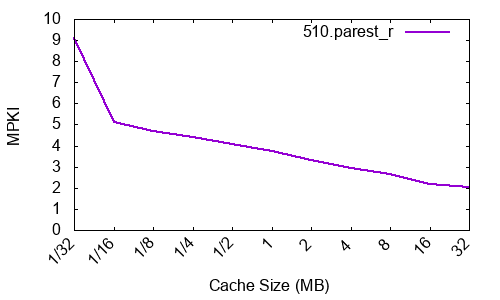
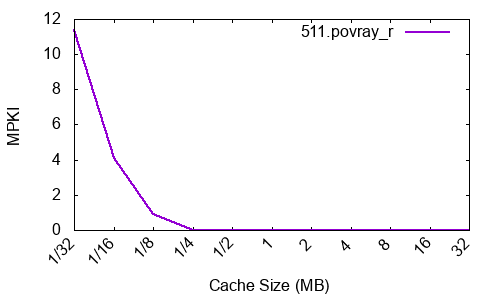
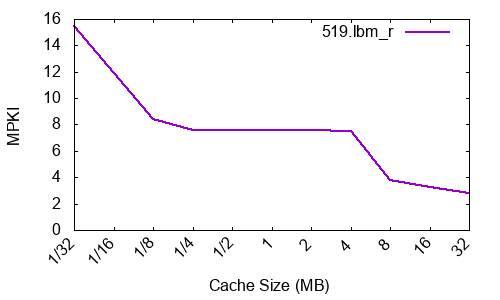
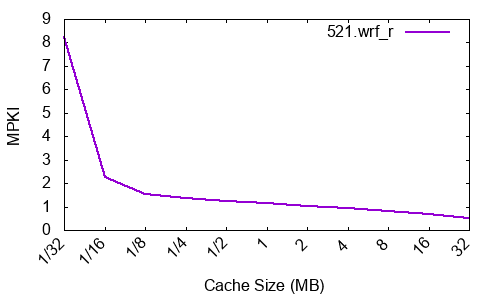
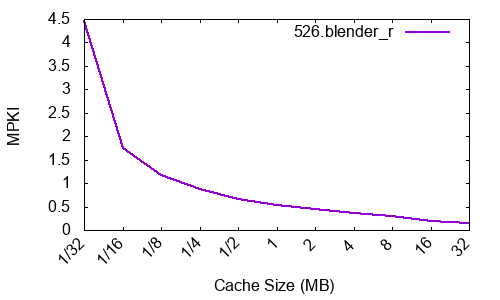
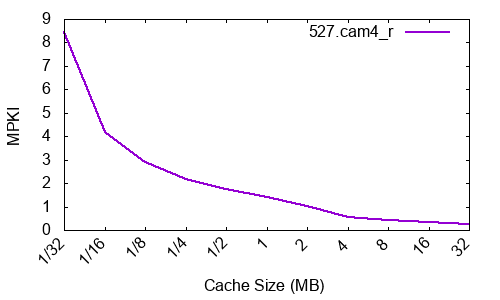
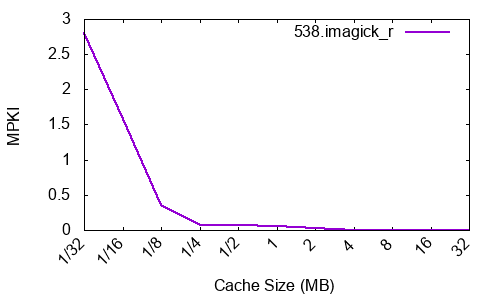
The working set size of an application and its sensitivity to cache capacity can be inferred by examining changes in cache performance of a system with its cache size. For each benchmark, we conduct a cache sensitivity analysis to obtain their working set size. Following the methodology from (Jaleel, 2010), we modeled a single, shared cache with 64Byte line size and LRU replacement policy, which varied as follows: direct mapped 32KB, 2-way 64KB, 4-way 128KB, 8-way 256KB, and so on till a 1024-way 32MB cache. The experiments are conducted using dcache, a functional cache simulator Pintool. Due to dynamic instruction counts in orders of 100 trillion and an effective slowdown incurred by simulation on dcache, benchmarks belonging to the FPSpeed suite couldn’t be completed and hence are deprecated from the working set size analysis. We consider only one input set for each benchmark.
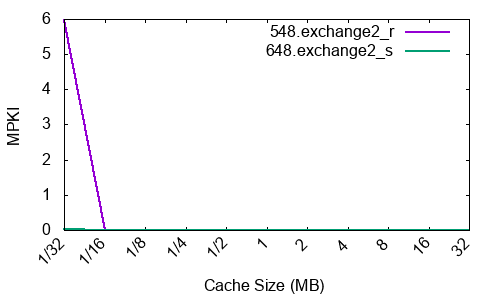
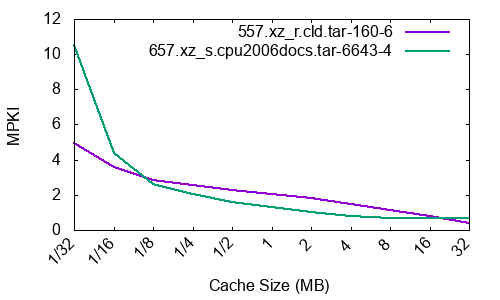
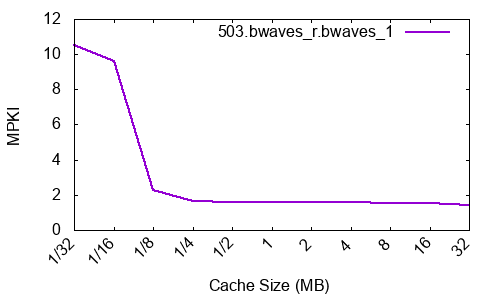
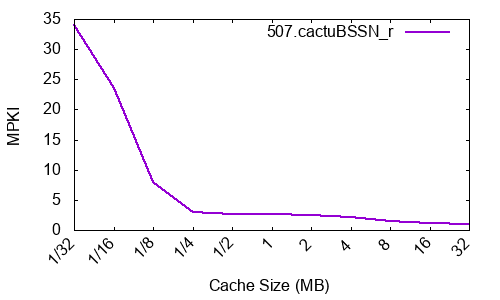
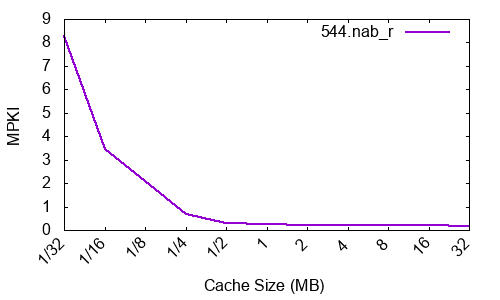
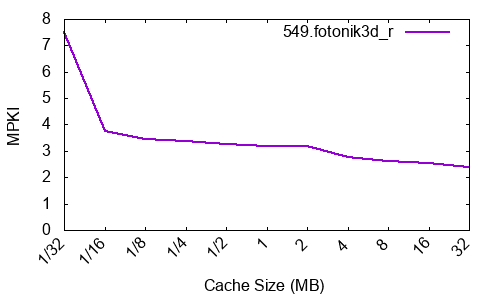
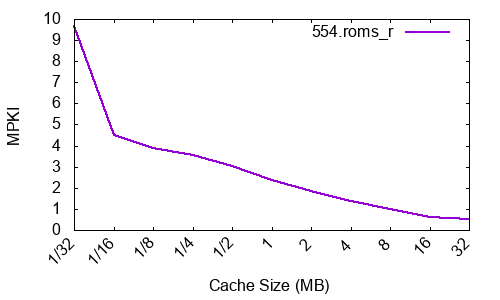
Our results for cache sensivity analysis are presented in Figure 5. We plot cache size in megabytes (MB) on x-axis and misses per kilo instructions (MPKI) on the y-axis. We observe that not all workloads perform well within the range of cache sizes. Based on the working set sizes, we divide the workloads into two group. The first group consists of applications like povray, imagick, nab, and perlbench have a limited need for the cache capacity, and can be well executed without the need to regularly refer the main memory. On the contrary, applications like cactuBSSN, lbm, and mcf fail to accomodate within the range of cache sizes, and hence have large working set sizes. The large working sets are often the consequence of the program’s algorithm that operates on large amount of data. For example, cactuBSSN executes a computational model to employ finite differencing in space using the Einstein equations, while lbm simulates an incompressible fluid in 3D. With working set sizes larger than the cache capacity, these applications refer the off-chip memory and hence affect the bandwidth.
Figure 5 reveals that most workloads exhibit a smooth exponential decrease in the MPKI value as the cache size increases. However, the suite comprises of some workloads where incrementally increasing cache size gives no significant improvements in cache performance, until a point of saturation is reached. At this step, a sudden drop in the MPKI is observed. Such behavior is evident in applications like bwaves and lbm, and signifies the working set of the workload. Benchamrks like xalancbmk, nab, fotonik3d, and lbm illustrate multiple such points, implying that they have multiple working set sizes. Most workloads suffer from cache misses even with a reasonable 32MB cache size, implying that memory hierarchy research, for both on-chip and off-chip components will remain important for these workloads.
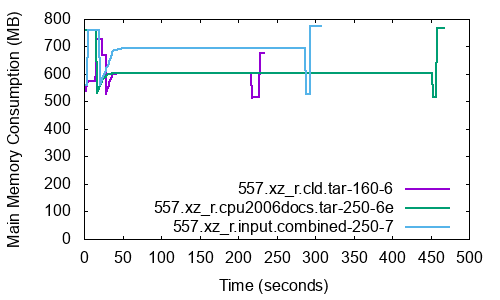
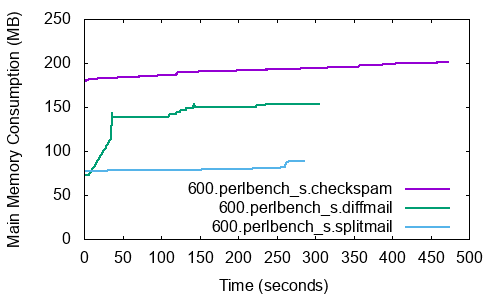
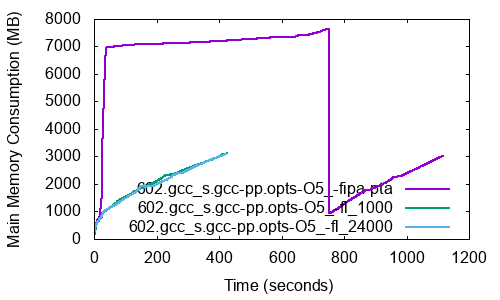
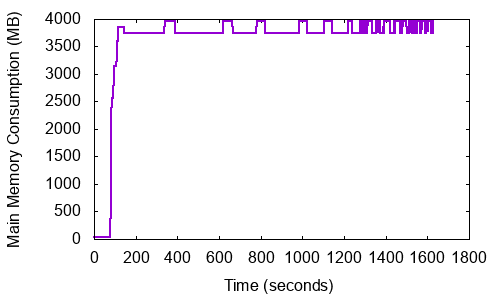

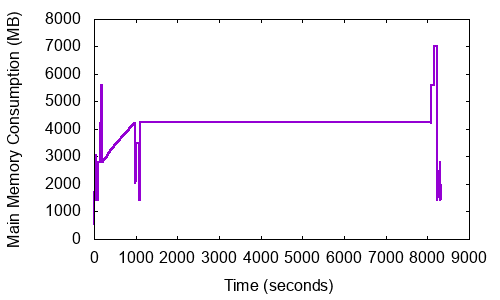
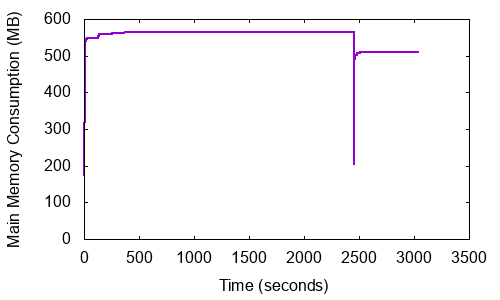
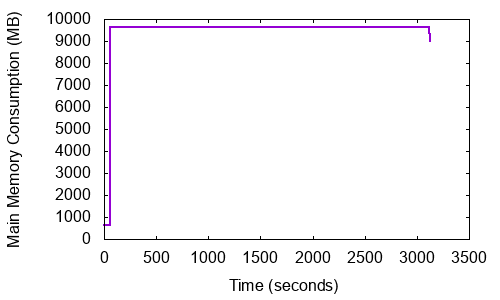
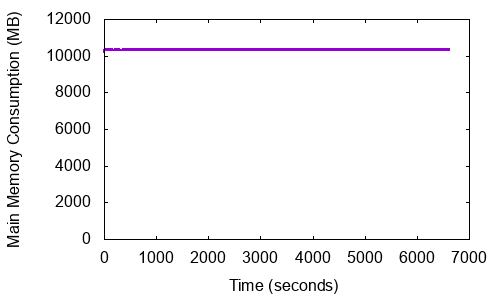
5.3. Memory Footprint
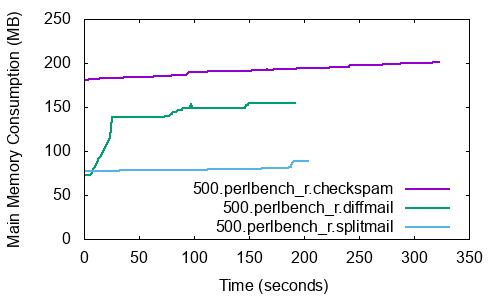
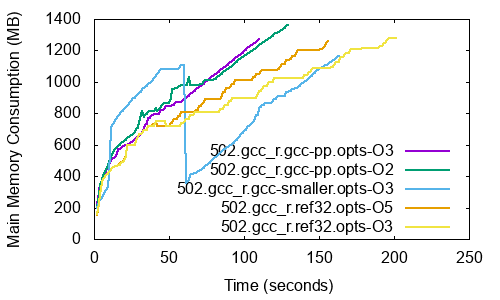
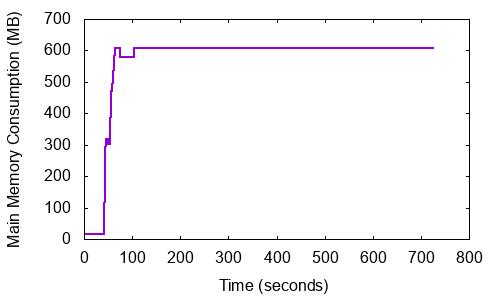
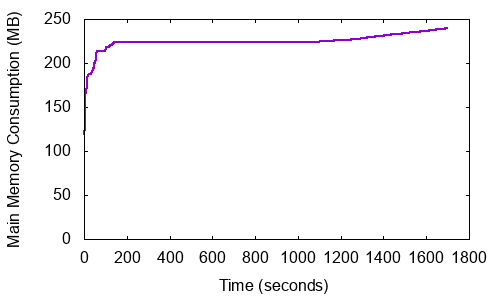
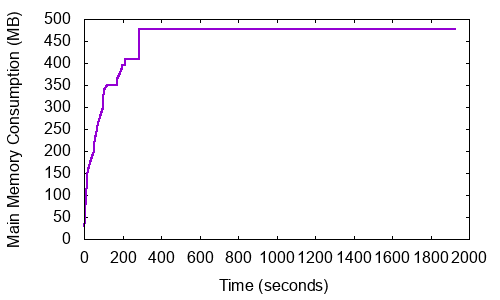
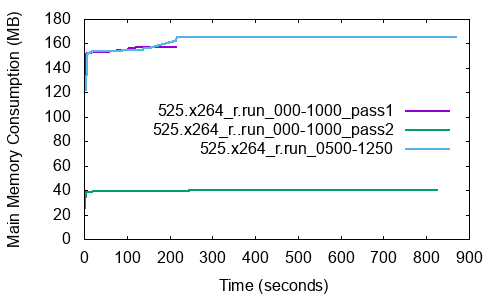
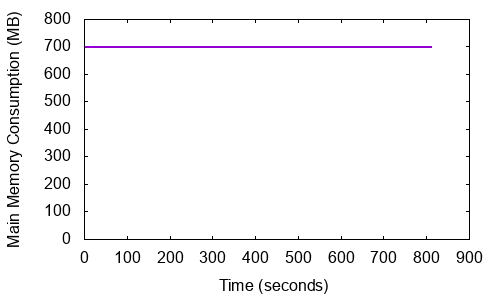
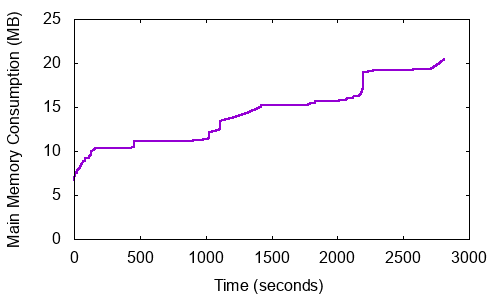
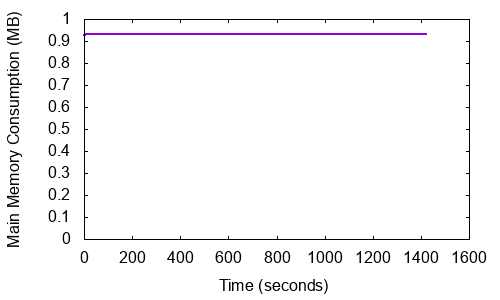
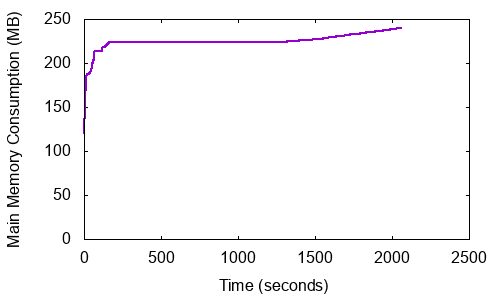
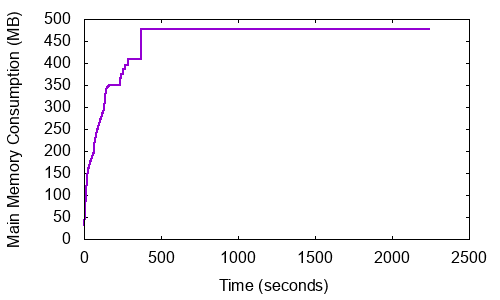
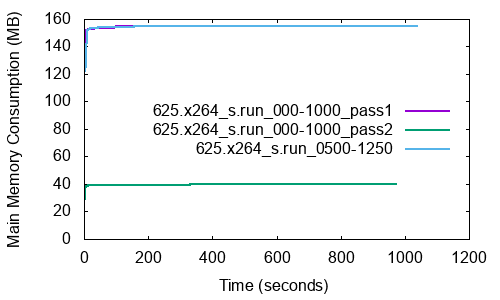
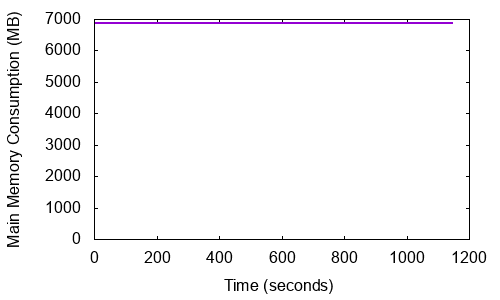
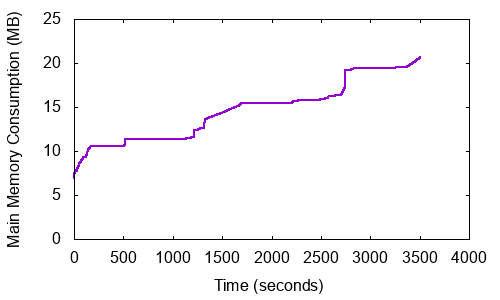
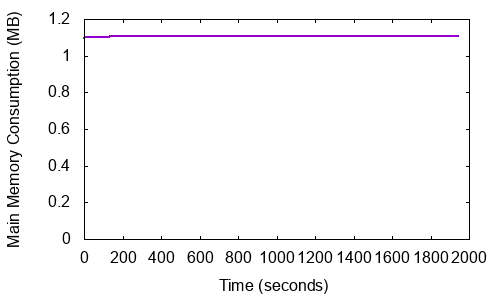
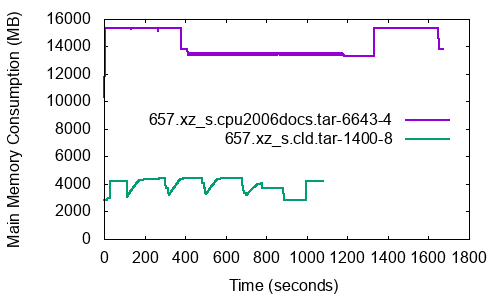
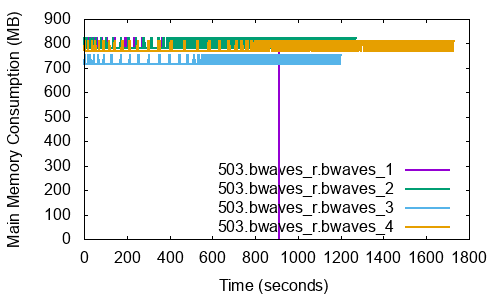
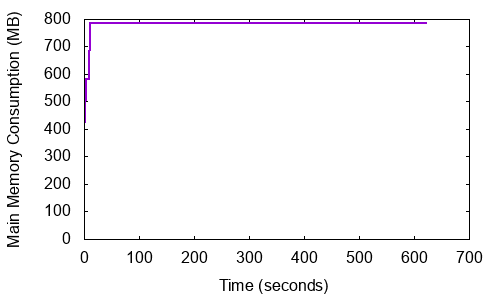
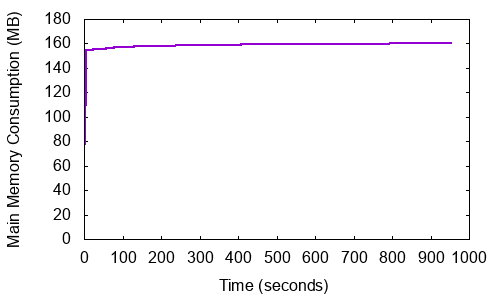
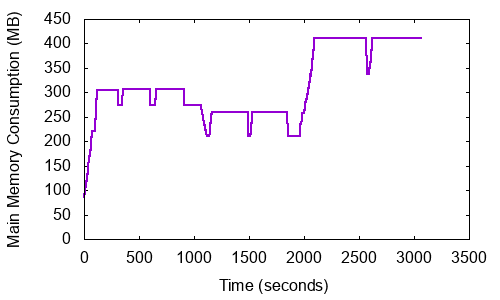
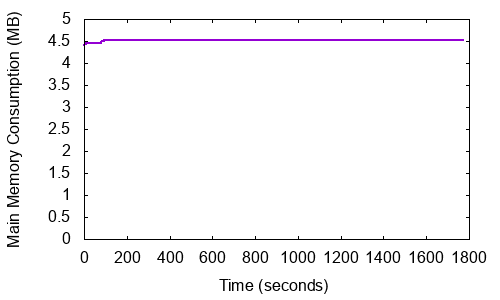
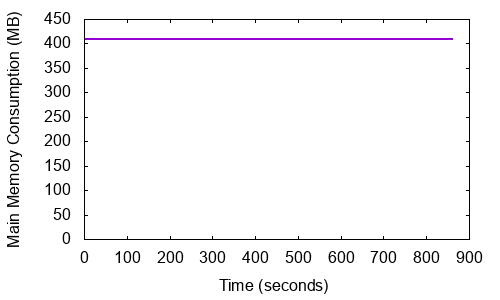
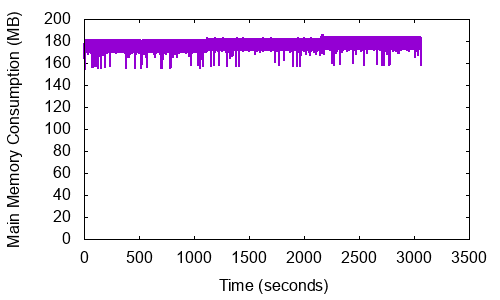
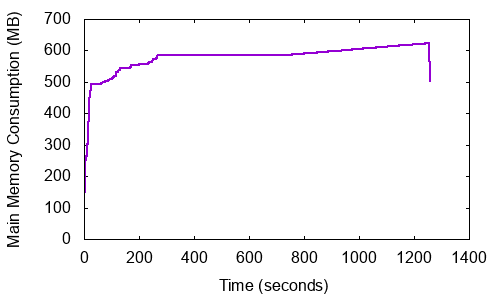
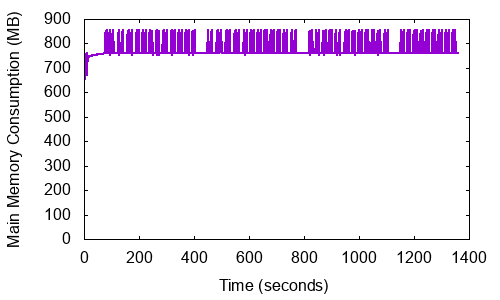
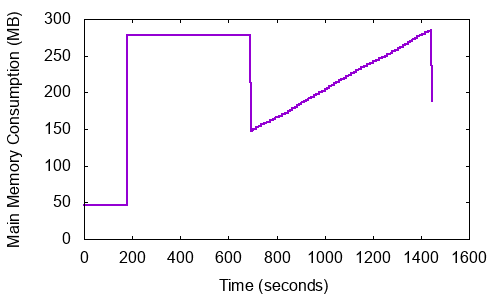
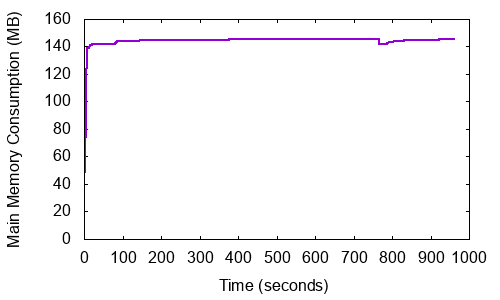
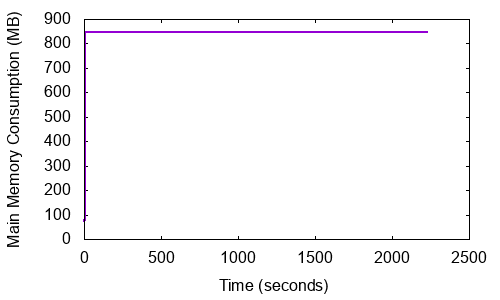
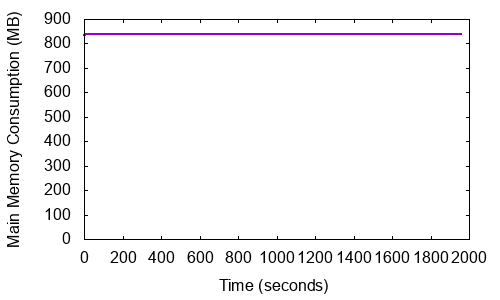
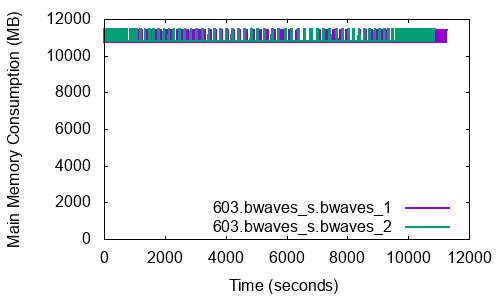
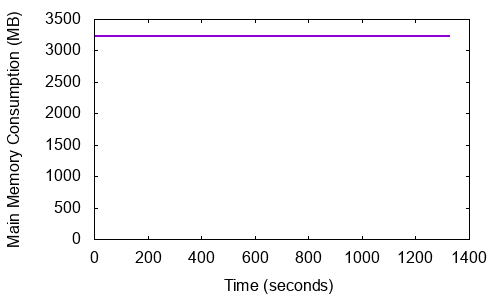
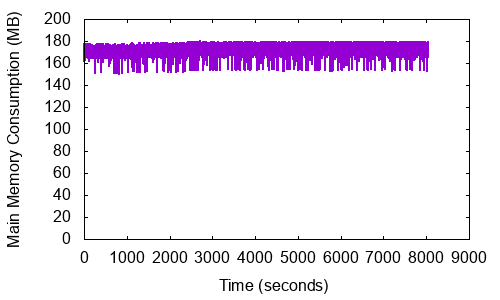
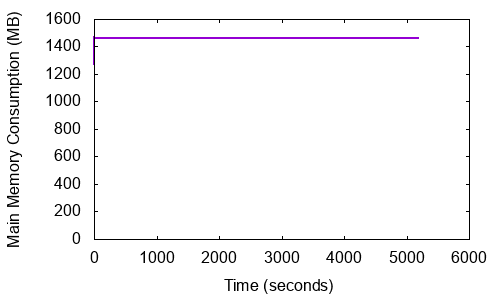
SPEC CPU2006 had a target memory footprint of 900MB for the benchmarks (Gove, 2007; Henning, 2007). Since then, the memory size has tremendously increased. We observe the Resident Set Size (RSS), the amount of memory allocated to a process in the main memory, sampled every second, using the Linux ps utility. RSS does not include swapped out memory. However, it does include memory from shared libraries as long as the pages from those libraries are actually in memory. A large RSS on an active system means that the process touches a lot of memory locations.
Figures 6,7 plot the time-varying main memory consumption in MB, and indicates that all of the Rate benchmarks, both integer and floating point, still have main memory consumption well below 900MB. However, Speed workloads have large RSS, with peak consumption as high as 16 GB. On average, Speed benchmarks have 10 more memory footprint than their corresponding Rate ones. Floating point benchmark suite have memory consumption of 3 more than the integer suite. Based on the average footprint throughout the execution, we order the benchmarks from extremely low to extremely high memory consumption. Benchmarks exchange2, povray, leela, namd, wrf, nab, and xalancbmk have low RSS values, which indicates negligible access to the main memory. Therefore, these benchmarks are expected have low working set sizes, which is evident from Section 5.2 results. On the contrary, bwaves_s, roms_s, fotonik3d_s, cactuBSSN_s and xz_s exhibit extremely large memory footprints. Furthermore, we observe that 90% of the workloads have main memory consumption below 5 GB, resulting in an average memory footprint of 1.82 GB.
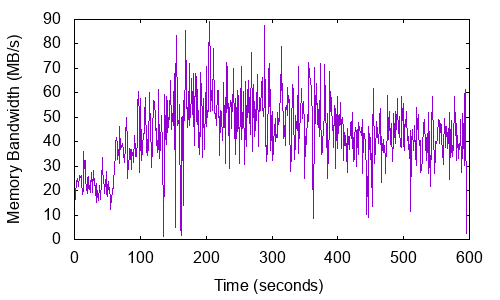
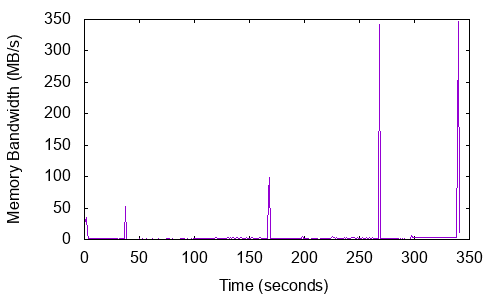
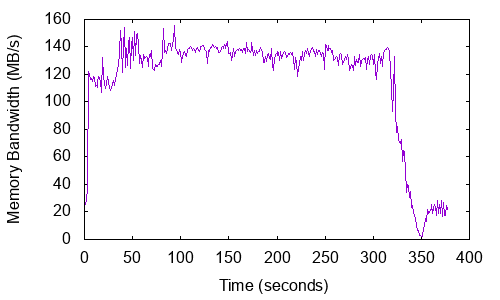
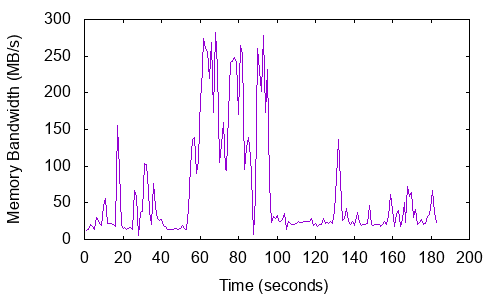
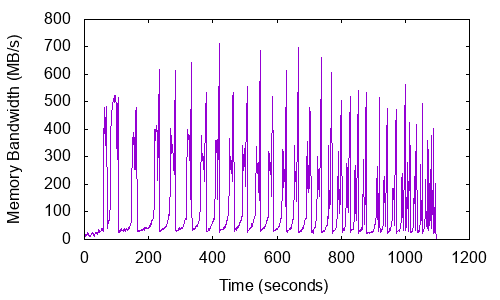
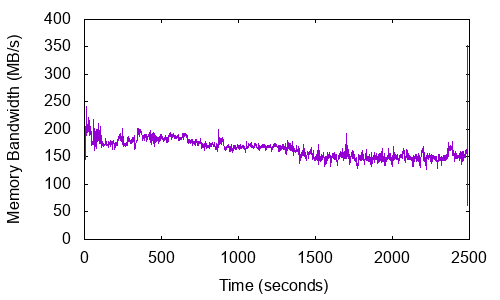
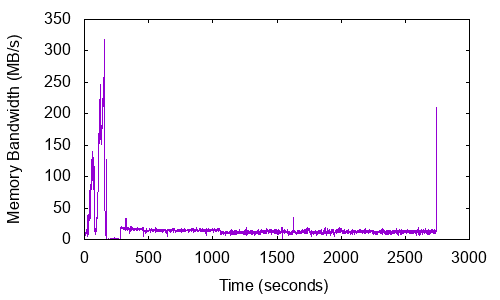
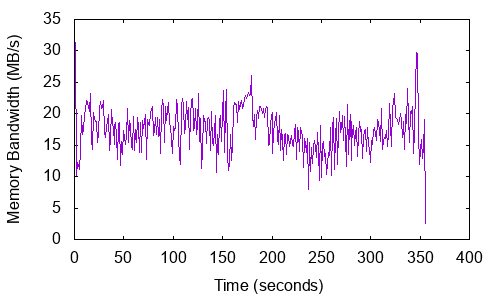
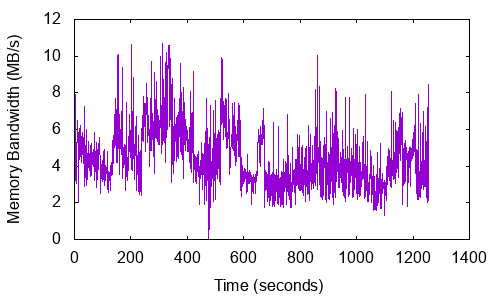
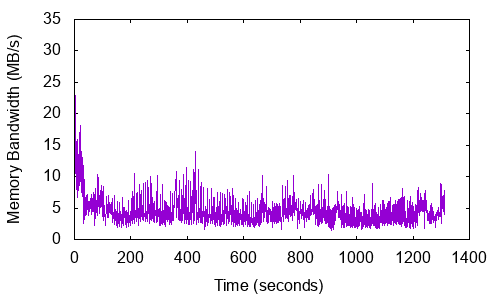
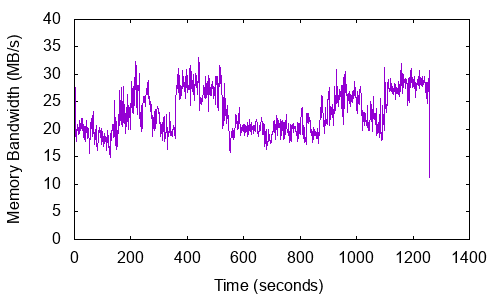
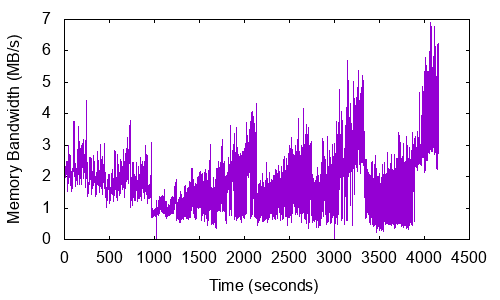
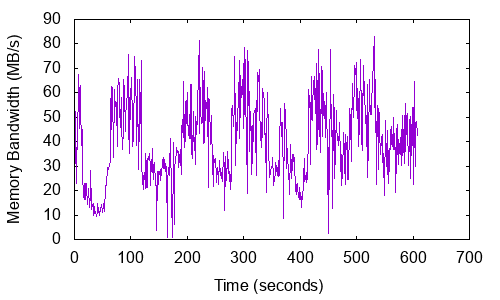
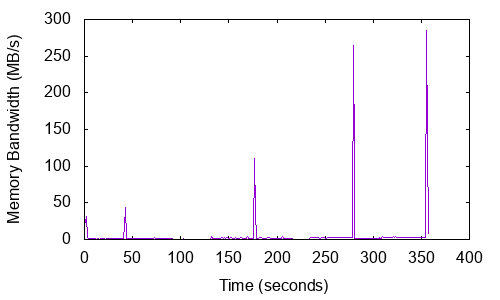
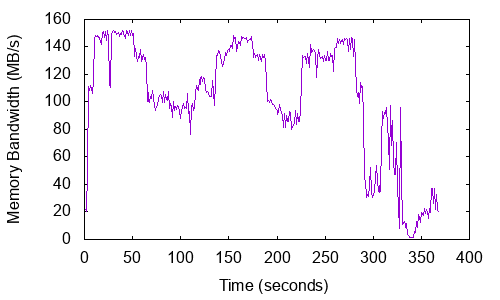
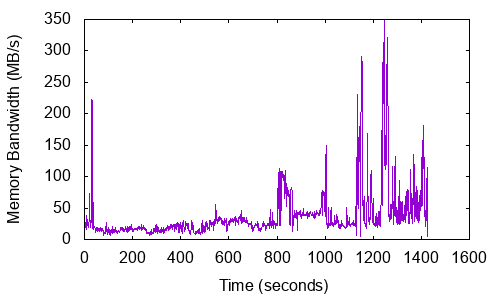
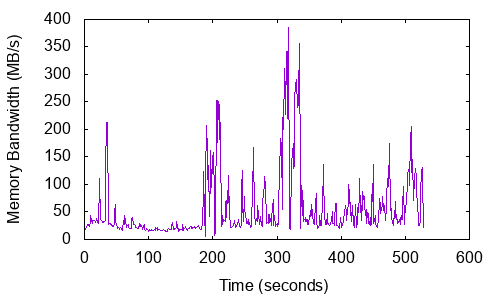
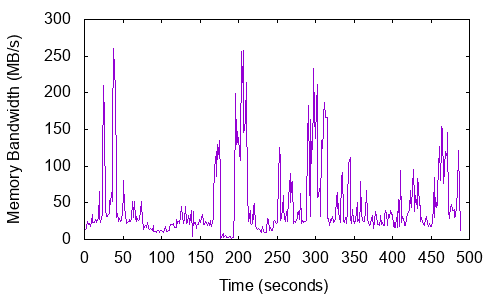
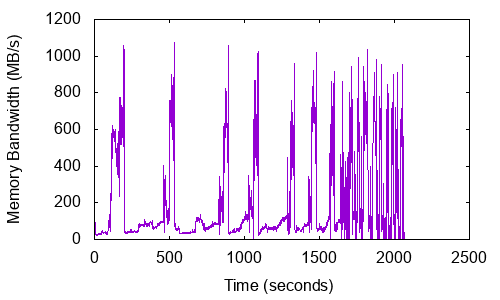
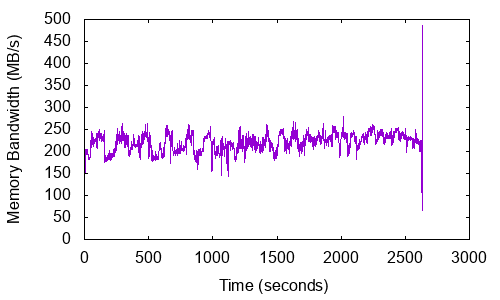
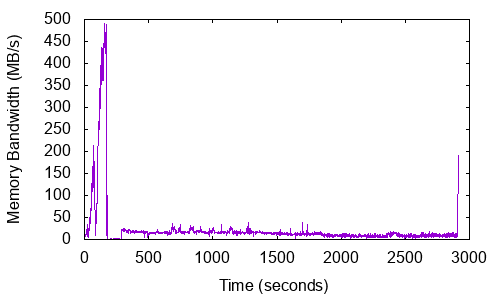
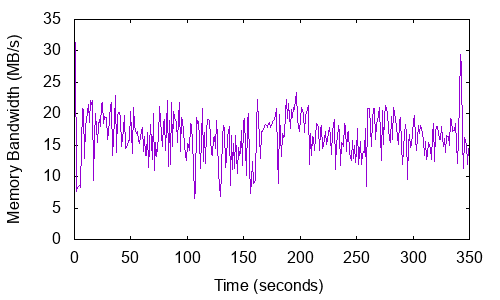
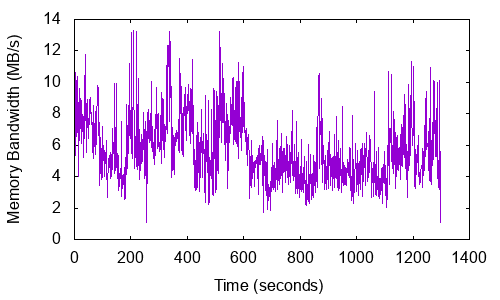
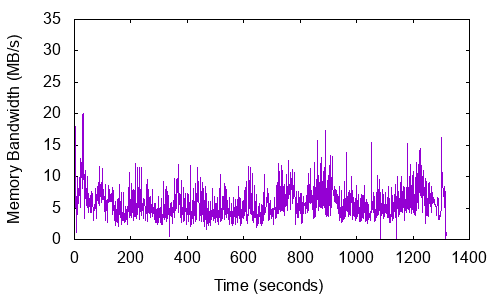
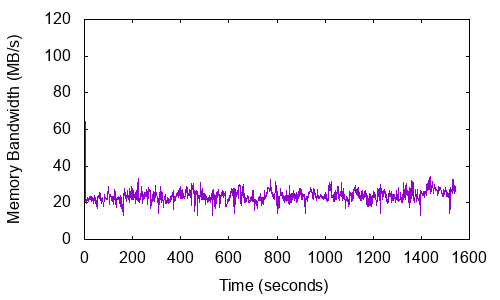
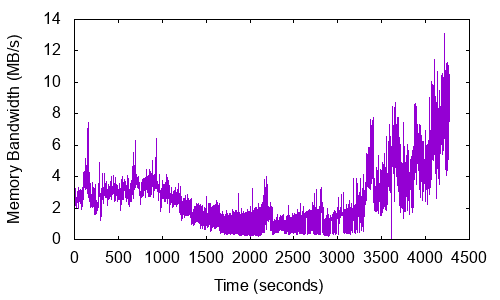
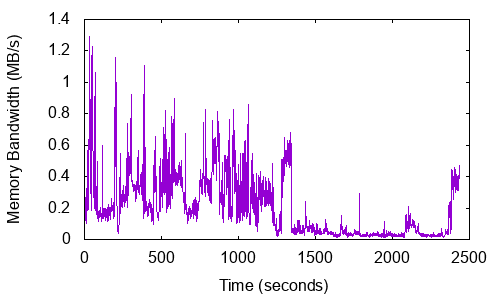
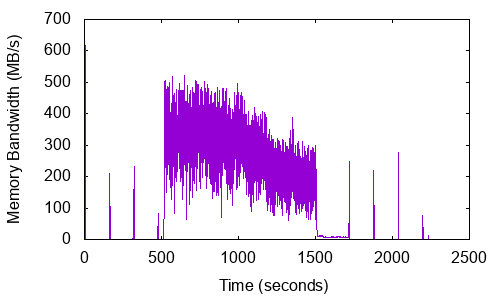
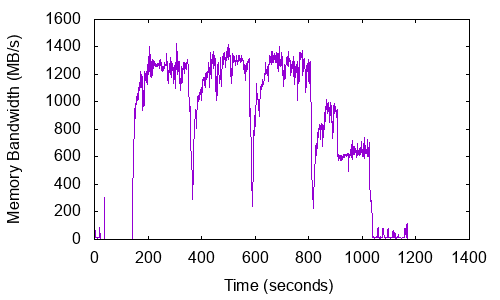
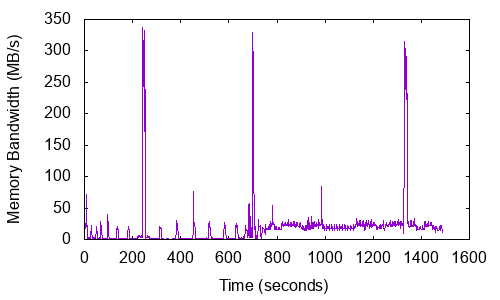
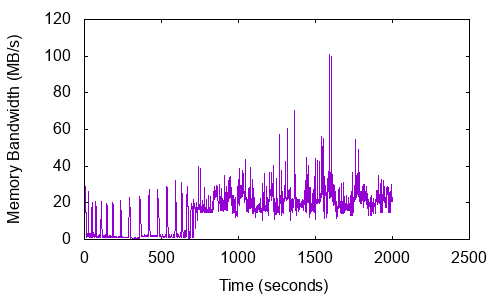
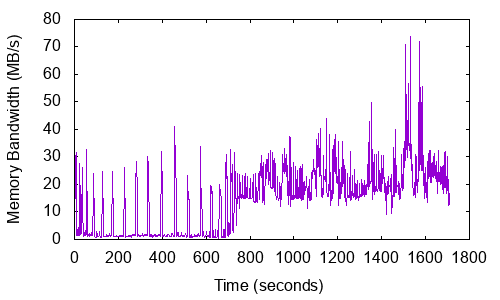
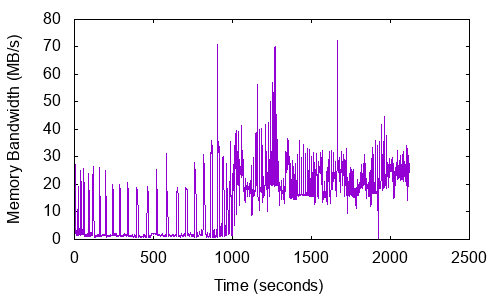
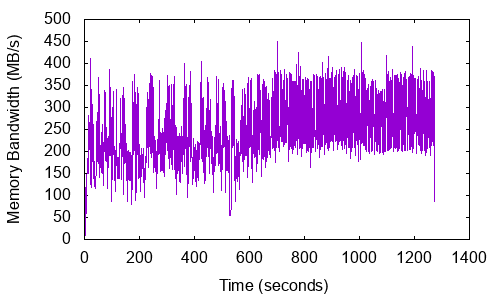
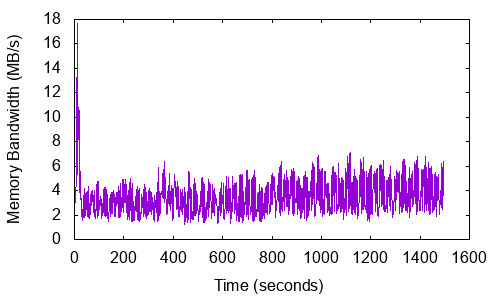
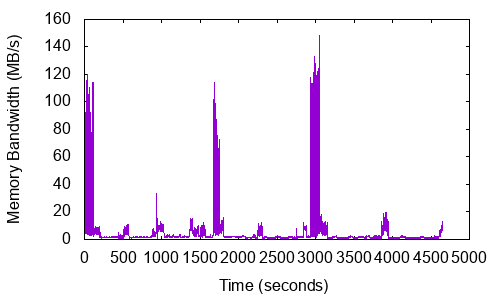
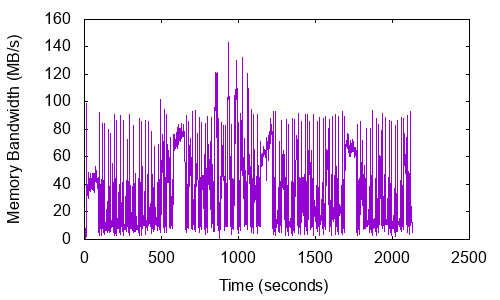
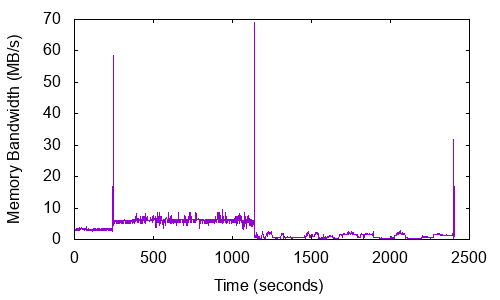
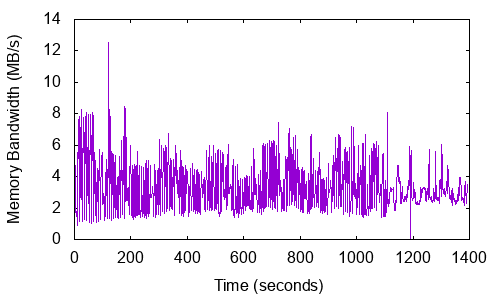
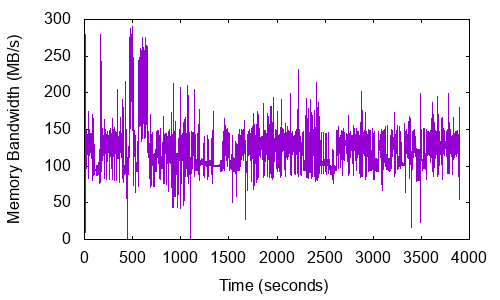
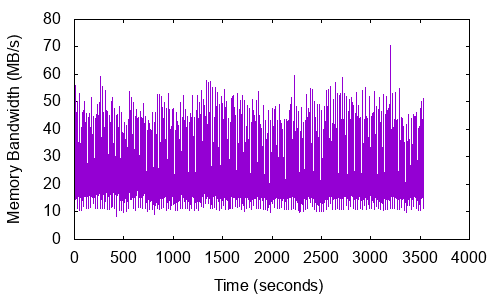
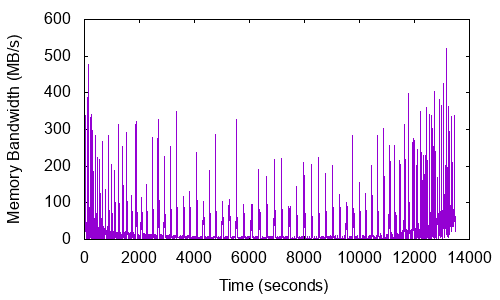
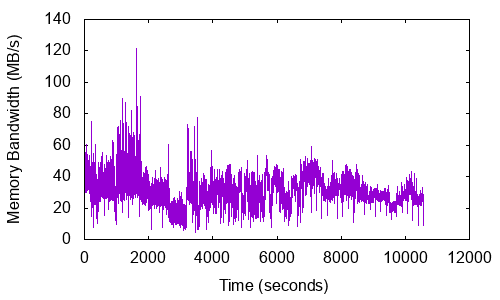
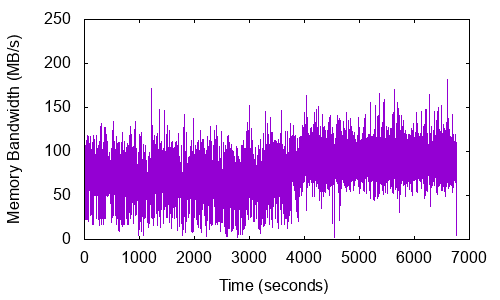
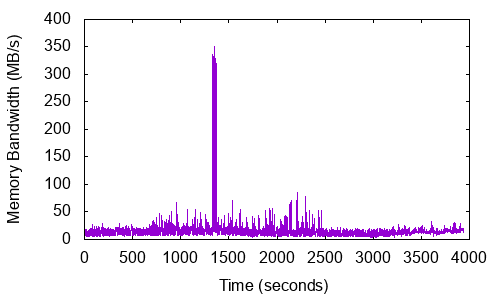
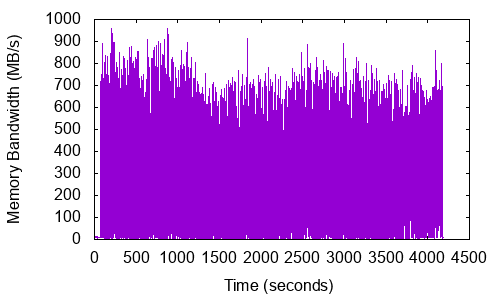
5.4. Memory Bandwidth
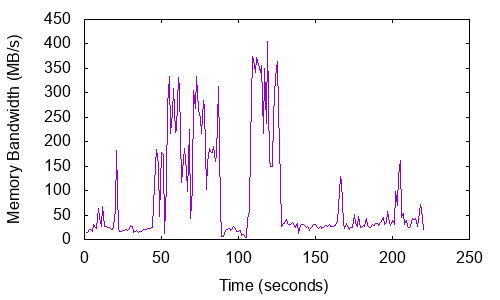
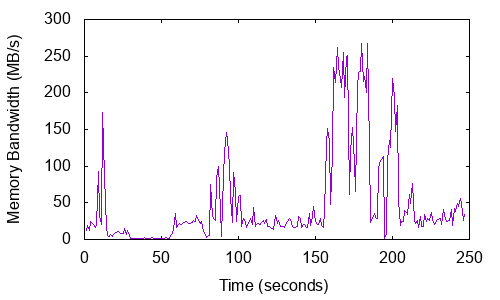
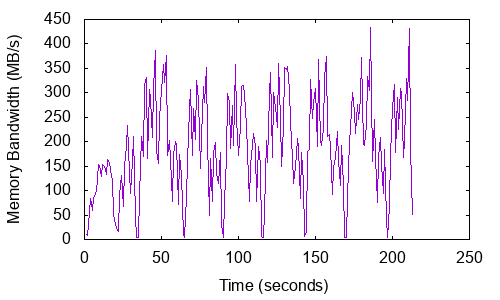
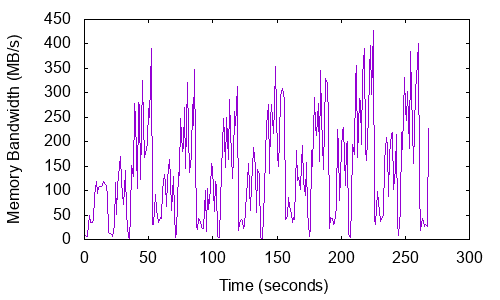
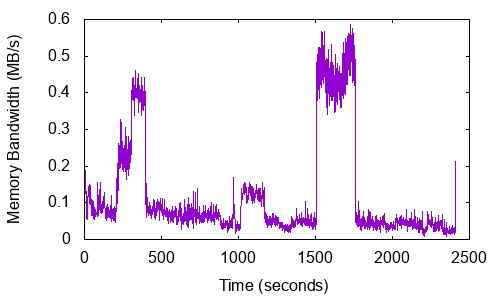
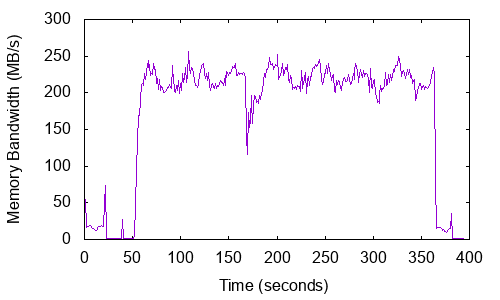
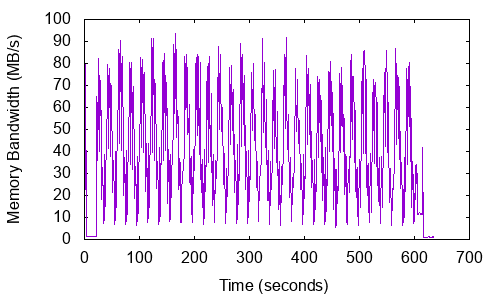
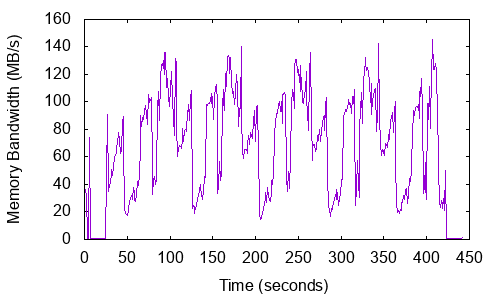
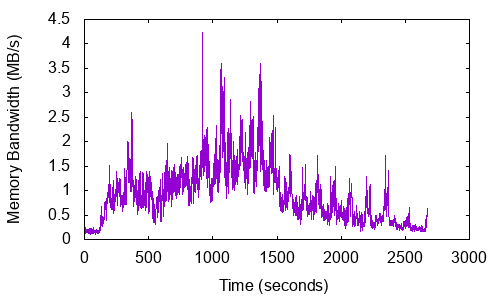
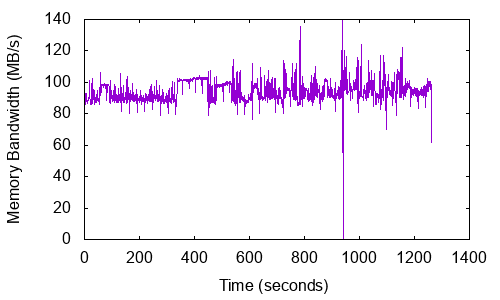
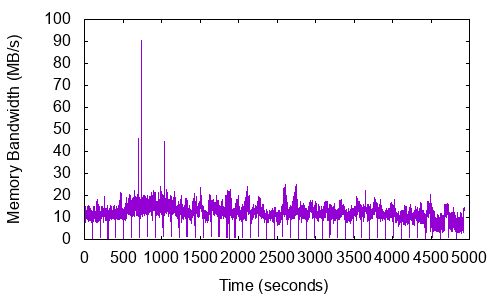
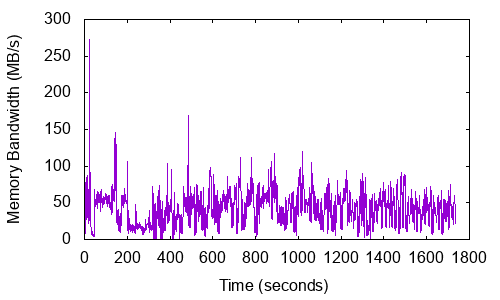
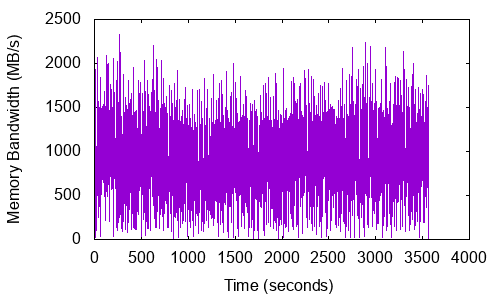
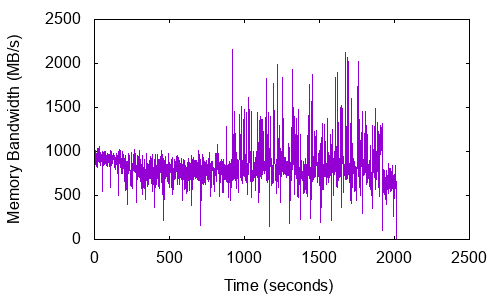
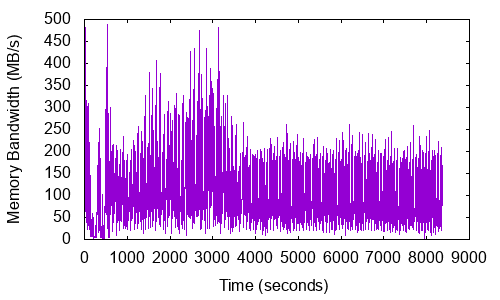
Next, we measure the off-chip bandwidth across the SPEC CPU2017 workloads. We collect the hardware events LLC-load-misses and LLC-store-misses using perf at regular intervals of 1 second, on test system described in Table 2. Memory bandwidth is calculated as the product of the total LLC misses per second with the cache line size. Figures 8-10 plots the time-varying memory bandwidth results in Megabytes per second, for each workload.
Our experimental results indicate a large variety in memory bandwidth usage patterns from various benchmarks. CPU2017 consists of workloads with average bandwidth as low as 0.2 MB/s to workloads with peak bandwidth of 2.3 GB/s. leela, exchange2, namd, povray, and nab_r have modest bandwidth usage, with consumption within 10 MB/s during the entire execution period. Workloads parest, wrf_r, nab_s and perlbench.diffmail exhibit low bandwidth usage with short sudden irregular bursts of high data transfer rates. While applications like xalancbmk and imagick have input sets which fit within on-chip memory, and hence these applications do not refer the off-chip memory after initiation. All the above discussed benchmarks have very little off-chip bandwidth usage. This is in line with the conclusions drawn from Sections 5.2 and 5.3, as these workloads have low working set sizes and hence low memory footprint.
CPU2017 also comprises of many benchmarks with large memory bandwidth utilizations. For example, cactuBSSN_s, and lbm_s have peak bandwidth utilization of 2.3 GB/s (0.9 GB/s on average). Similarly, mcf, xz_s, cactuBSSN_r, and fotonik3d_s have also large off-chip traffic, and can be used to test bandwidth optimization techniques.


6. New Additions to the SPEC CPU suite
In the current iteration of SPEC CPU, many new benchmarks have been added to cover emerging application domains. In the INT category, artificial intelligence (AI) has been extensively represented by a total of three benchmarks, with exchange2 being the new addition to the group. CPU2006 (Henning, 2006) integer benchmarks h264ref, sjeng and gobmk have been renamed to x264, deepsjeng and leela respectively due to changes in their functionality or inputs, while still maintaining the application domain. Additionally, bzip2 has been replaced by xz to represent the general compression domain. exchange2 (recursive solution generator), the new addition to INT suite, has the lowest percentage of memory instructions and hence, justifiably the lowest memory footprint and lowest bandwidth consumption in the CPU2017 suite. Interestingly, all the three AI benchmarks in the suite have extremely small working set sizes and consequently, low off-chip accesses.
In the FP category, eight new benchmarks have been added: parest, blender, cam4, pop2, imagick, nab, fotonik3d, and roms. Climatology domain has been extensively represented here with three new additions of benchmarks, simulating different components of the NCAR Earth System. cactusADM has been changed to cactuBSSN. parest’s implementation relies on dealII libraries from CPU2006, which also underlines the dealII benchmark. In general, Speed versions of these benchmarks are scaled up in order to highly exercise both memory and computation. For example, xz achieves this by differing in its data compression levels, roms vary its grid size and simulation time steps, while fotonik3d alters its problem size, frequencies, time steps, and boundary conditions. At the same time, benchmarks x264, leela and exchange2 use almost similar workloads for both Rate and Speed and hence, we discern very similar instruction and memory behavior from them, as depicted throughout the Sections 4 and 5.
7. Related Work
A number of studies have been carried out recently regarding characterization of SPEC CPU2017 workloads, however, to the best of our knowledge, this paper presents the first systematic study of the memory behavior of the SPEC CPU2017 suite.
SPEC CPU2017 Characterization: Bucek et al. (2018) present an overview of CPU2017 suite and discuss its reportable execution. Limaye and Adegbija (2018) use hardware performance counter statistics to characterize SPEC CPU2017 applications with respect to several metrics such as instruction distribution, execution performance, branch and cache behaviors. They also utilize Principal Components Analysis (Dunteman, 1989) and hierarchical clustering to identify subsets of the suite. Similarly, Panda et al. (2018) characterize the CPU2017 benchmarks using perf, and leverage statistical techniques to identify cross application redundancies and propose subsets of the entire suite, by classifying multiple benchmarks with similar behaviors into a single subset. Further, they also provide a detailed evaluation of the representativeness of the subsets. Amaral et al. (2018) propose the Alberta Workloads for the SPEC CPU2017 benchmark suite hoping to improve the performance evaluation of techniques that rely on any type of learning, for example the formal Feedback-Directed Optimization (FDO). Additionally, in order to ameliorate large simulation times, Wu et al. ([n. d.]) analyze the program behavior and consequently propose simulation points (Hamerly et al., 2004) for the suite.
Memory Characterization of Workloads: Jaleel (2010) determined the memory system requirements of workloads from SPEC CPU2000 and CPU2006 using binary instrumentation. Henning (2007) discussed the memory footprints of CPU2006 workloads, while Gove (2007) analysed their working set sizes. Bienia et al. (2008) present memory behavior of PARSEC benchmark suite. John et al. (1999) discusses a taxonomy of workload characterization techniques.
8. Conclusion
In this paper, we provide the first, comprehensive characterization of the memory behavior of the SPEC CPU2017 benchmark suite. Our working set analysis shows that many workloads have a working set much higher than 32 MB (maximum cache size assumed in our experiments), implying the continued importance of cache hierarchies for benchmark performance. We also show that Rate benchmarks, both INT and FP, still have main memory consumption well below 900 MB, which was target memory footprint for CPU2006. Almost 90% of the workloads have main memory consumption below 5 GB, with the average across the suite being 1.82 GB. However, workloads have extremely varying peak memory bandwidth usage, with some benchmarks requiring as little as 0.2 MB/s, to others utilizing upto 2.3 GB/s.
In addition, our experiments have revealed some interesting results with respect to dynamic instruction counts and distributions. The average instruction count for SPEC CPU2017 workloads is 22.19 trillion, which is an order of magnitude higher than the SPEC CPU2006. In addition, we find that FP benchmarks typically have much higher compute requirements: on average, FP workloads carry out three times the number of arithmetic operations as compared to INT workloads.
Acknowledgements.
The authors thank the anonymous reviewers and shepherd for their useful comments and feedback. This work was supported in part by SERB grant (ECR/2017/000887), as well as Indian Institute of Technology Gandhinagar and Ashoka University, Sonipat.References
- (1)
- CPU ([n. d.]a) [n. d.]a. PS man-page. http://man7.org/linux/man-pages/man1/ps.1.html. ([n. d.]).
- CPU ([n. d.]b) [n. d.]b. SPEC CPU2017 Base Compilation Flags. https://www.spec.org/cpu2017/Docs/runrules.html#rule_2.3. ([n. d.]).
- ps ([n. d.]) [n. d.]. SPEC CPU2017 Documentation. https://www.spec.org/cpu2017/Docs. ([n. d.]).
- Ahn et al. (2015) Junwhan Ahn, Sungjoo Yoo, Onur Mutlu, and Kiyoung Choi. 2015. PIM-enabled instructions: a low-overhead, locality-aware processing-in-memory architecture. In Computer Architecture (ISCA), 2015 ACM/IEEE 42nd Annual International Symposium on. IEEE, 336–348.
- Amaral et al. (2018) J. N. Amaral, E. Borin, D. R. Ashley, C. Benedicto, E. Colp, J. H. S. Hoffmam, M. Karpoff, E. Ochoa, M. Redshaw, and R. E. Rodrigues. 2018. The Alberta Workloads for the SPEC CPU 2017 Benchmark Suite. In 2018 IEEE International Symposium on Performance Analysis of Systems and Software (ISPASS). 159–168. https://doi.org/10.1109/ISPASS.2018.00029
- Awasthi et al. (2012) Manu Awasthi, D Nellans, Kshitij Sudan, Rajeev Balasubramonian, and Al Davis. 2012. Managing data placement in memory systems with multiple memory controllers. International Journal of Parallel Programming 40, 1 (2012), 57–83.
- Bienia et al. (2008) Christian Bienia, Sanjeev Kumar, Jaswinder Pal Singh, and Kai Li. 2008. The PARSEC benchmark suite: Characterization and architectural implications. In Proceedings of the 17th international conference on Parallel architectures and compilation techniques. ACM, 72–81.
- Bucek et al. (2018) James Bucek, Klaus-Dieter Lange, et al. 2018. SPEC CPU2017: Next-Generation Compute Benchmark. In Companion of the 2018 ACM/SPEC International Conference on Performance Engineering. ACM, 41–42.
- De Melo (2010) Arnaldo Carvalho De Melo. 2010. The new linux perf tools. In Slides from Linux Kongress, Vol. 18.
- Dunteman (1989) George H Dunteman. 1989. Principal components analysis. Number 69. Sage.
- Gove (2007) Darryl Gove. 2007. CPU2006 working set size. ACM SIGARCH Computer Architecture News 35, 1 (2007), 90–96.
- Hamerly et al. (2004) Greg Hamerly, Erez Perelman, and Brad Calder. 2004. How to use simpoint to pick simulation points. ACM SIGMETRICS Performance Evaluation Review 31, 4 (2004), 25–30.
- Hassan et al. (2016) Hasan Hassan, Gennady Pekhimenko, Nandita Vijaykumar, Vivek Seshadri, Donghyuk Lee, Oguz Ergin, and Onur Mutlu. 2016. ChargeCache: Reducing DRAM latency by exploiting row access locality. In High Performance Computer Architecture (HPCA), 2016 IEEE International Symposium on. IEEE, 581–593.
- Henning (2006) John L. Henning. 2006. SPEC CPU2006 Benchmark Descriptions. SIGARCH Comput. Archit. News 34, 4 (Sept. 2006), 1–17. https://doi.org/10.1145/1186736.1186737
- Henning (2007) John L. Henning. 2007. SPEC CPU2006 Memory Footprint. SIGARCH Comput. Archit. News 35, 1 (March 2007), 84–89. https://doi.org/10.1145/1241601.1241618
- Jaleel (2010) Aamer Jaleel. 2010. Memory characterization of workloads using instrumentation-driven simulation. Web Copy: http://www. glue. umd. edu/ajaleel/workload (2010).
- Jin et al. (2014) Youngbin Jin, Mustafa Shihab, and Myoungsoo Jung. 2014. Area, power, and latency considerations of STT-MRAM to substitute for main memory. In Proc. ISCA.
- John et al. (1999) Lizy Kurian John, Purnima Vasudevan, and Jyotsna Sabarinathan. 1999. Workload characterization: Motivation, goals and methodology. In Workload Characterization: Methodology and Case Studies. Based on the First Workshop on Workload Characterization. IEEE, 3–14.
- Kültürsay et al. (2013) Emre Kültürsay, Mahmut Kandemir, Anand Sivasubramaniam, and Onur Mutlu. 2013. Evaluating STT-RAM as an energy-efficient main memory alternative. In Performance Analysis of Systems and Software (ISPASS), 2013 IEEE International Symposium on. IEEE, 256–267.
- Lee et al. (2009) Benjamin C Lee, Engin Ipek, Onur Mutlu, and Doug Burger. 2009. Architecting phase change memory as a scalable dram alternative. In ACM SIGARCH Computer Architecture News, Vol. 37. ACM, 2–13.
- Limaye and Adegbija (2018) A. Limaye and T. Adegbija. 2018. A Workload Characterization of the SPEC CPU2017 Benchmark Suite. In 2018 IEEE International Symposium on Performance Analysis of Systems and Software (ISPASS). 149–158. https://doi.org/10.1109/ISPASS.2018.00028
- Liu et al. (2012) Jamie Liu, Ben Jaiyen, Richard Veras, and Onur Mutlu. 2012. RAIDR: Retention-aware intelligent DRAM refresh. In ACM SIGARCH Computer Architecture News, Vol. 40. IEEE Computer Society, 1–12.
- Luk et al. (2005) Chi-Keung Luk, Robert Cohn, Robert Muth, Harish Patil, Artur Klauser, Geoff Lowney, Steven Wallace, Vijay Janapa Reddi, and Kim Hazelwood. 2005. Pin: Building Customized Program Analysis Tools with Dynamic Instrumentation. SIGPLAN Not. 40, 6 (June 2005), 190–200. https://doi.org/10.1145/1064978.1065034
- Panda et al. (2018) R. Panda, S. Song, J. Dean, and L. K. John. 2018. Wait of a Decade: Did SPEC CPU 2017 Broaden the Performance Horizon?. In 2018 IEEE International Symposium on High Performance Computer Architecture (HPCA). 271–282. https://doi.org/10.1109/HPCA.2018.00032
- Singh and Awasthi (2019) Sarabjeet Singh and Manu Awasthi. 2019. Memory Centric Characterization and Analysis of SPEC CPU2017 Suite. In Proceedings of the 2019 ACM/SPEC International Conference on Performance Engineering. ACM, 285–292.
- Udipi et al. (2010) Aniruddha N. Udipi, Naveen Muralimanohar, Niladrish Chatterjee, Rajeev Balasubramonian, Al Davis, and Norman P. Jouppi. 2010. Rethinking DRAM Design and Organization for Energy-constrained Multi-cores. In Proceedings of the 37th Annual International Symposium on Computer Architecture (ISCA ’10). ACM, New York, NY, USA, 175–186. https://doi.org/10.1145/1815961.1815983
- Wu et al. ([n. d.]) Qinzhe Wu, Steven Flolid, Shuang Song, Junyong Deng, and Lizy K John. [n. d.]. Hot Regions in SPEC CPU2017. ([n. d.]).
- Wu et al. (2009) Xiaoxia Wu, Jian Li, Lixin Zhang, Evan Speight, Ram Rajamony, and Yuan Xie. 2009. Hybrid cache architecture with disparate memory technologies. In ACM SIGARCH computer architecture news, Vol. 37. ACM, 34–45.
- Xu et al. (2011) Wei Xu, Hongbin Sun, Xiaobin Wang, Yiran Chen, and Tong Zhang. 2011. Design of last-level on-chip cache using spin-torque transfer RAM (STT RAM). IEEE Transactions on Very Large Scale Integration (VLSI) Systems 19, 3 (2011), 483–493.
- Zhang and Li (2009) Wangyuan Zhang and Tao Li. 2009. Exploring phase change memory and 3D die-stacking for power/thermal friendly, fast and durable memory architectures. In Parallel Architectures and Compilation Techniques, 2009. PACT’09. 18th International Conference on. IEEE, 101–112.