In-situ detection of nucleation in high temperature solutions
Abstract
The state of a sample during crystal growth from high temperature solutions is not accessible in conventional furnace systems. An optimization of the growth parameters often requires arduous trial and error procedures in particular in case of novel multicomponent systems with unknown phase diagrams. Here we present a measurement technique based on lock-in amplification that allows for in-situ detection of the liquidus and solidus temperatures as well as structural phase transitions. A thin, metallic measurement wire is mounted in close vicinity to the melt. Characteristic anomalies in the time-dependent electrical resistivity of this wire allow for the detection of latent heat release without using a reference crucible. The method is implemented in a ’feedback furnace’ and enables an adjustment of the temperature profile based on the occurrence or absence of phase transitions. The absolute temperature serves as an additional source of information. Obtained phase transition temperatures are in good agreement with differential thermal analysis (DTA).
I Introduction
High-temperature solutions, also referred to as flux, provide a powerful tool for the single crystals growth of binary or higher multicomponent compounds Elwell and Scheel (1975); Canfield and Fisher (2001); Kanatzidis et al. (2005); Jesche and Canfield (2014). A melt composed of several elements is deliberately cooled such that crystallization of certain fractions of the melt and growth of monocrystalline grains of the desired phase occur. Problematic and inaccurate is the prediction of the temperature at which the sought-after phase nucleates, as the phase transition temperatures are rarely known in the case of novel multicomponent systems. Thus, after melting and homogenization of the sample material, the mixture is cooled as slowly as achievable over the critical temperature (liquidus temperature) determined from the phase diagram (if available) or from previous investigations. This procedure has the consequence that the exact beginning of the crystallization cannot be determined and the slow cooling of a melt solution usually has to be started 50∘C to 100∘C above the nominal liquidus temperature. With cooling rates of 2, the process can last several days before the actual onset of nucleation and crystal growth take place. This means an enormous expenditure of time and energy, which can be even further increased by supercooling of the melt. In the temperature range close to nucleation and the early phase of crystal growth, however, even smaller cooling rates of less than 2 would be desirable in order to allow undisturbed formation of separated crystals without intergrowth.
Here, we present a novel method for controlling the heating power of a furnace. The key idea is that the state of a sample is no longer determined only by the nominal temperature in the process chamber, but by the onset or absence of characteristic signatures in the time-dependent temperature measured directly at the sample position. Those signatures are caused by the latent heat associated with first order phase transitions. Latent heat anomalies in the time-dependent sample temperature are detectable by high-precision measurements of the electrical resistivity using a lock-in-technique. We succeeded in detecting temperature anomalies smaller than of the absolute value by phase-sensitive measurements in dilute alloys. The in-situ detection of nucleation makes it possible to cool below or oscillate around the liquidus temperature at significantly slower rates than previously practical.
The paper is organized as follows: we specify our furnace and measurement setup followed by further experimental details on materials and equipment. In the second part, we present results on binary alloys: We show precise liquidus and solidus temperature detection of Bi-rich and In-rich solutions, investigate the development of the characteristic signatures upon successive dilution for Ni-Bi and describe detailed measurements of several phase transitions in Pd-Bi solutions.
II Furnace setup

We implemented the feedback method in in custom-build furnace produced by ScIDre https://scidre.de . The tubular furnace consists of a quartz process chamber (wall thickness 2.5 mm, diameter 50 mm, length 350-360 mm), which is centrally wrapped with a FeCrAl heating wire (diameter 1 mm, length 180 mm). Each end of the quarz tube is plunged in a flange made of stainless steel and sealed by an O-ring (FKM 80A). The lower flange is connected to a vacuum pump and a protection gas supply while the upper flange gets closed by a cover plate with several gas-tight feedthroughs. The setup features two thermocouples, one lead into the furnace by the upper side (Fig. 1 T1) and one by the bottom side (Fig. 1 T2). T1 is fed through the cover plate reaching into the center of the heating zone, where the crucible is located. To this extend, the thermocouple is bent upwards by 180∘ and the crucible is placed on top. The crucible is placed slightly below the center of the heating zone for providing a temperature gradient of 20, measured by successively shifting the position of the thermocouple. Note that this value presents an upper limit since thermal conductivity and convection in the melt reduce the temperature gradient. Whereas T1 is used to measure the absolute temperature as close as possible to the sample material, T2 serves primarily as safety measure for avoiding uncontrolled heating in case of faulty T1 readings. All processes are performed under Argon atmosphere at a pressure of roughly 500 mbar.
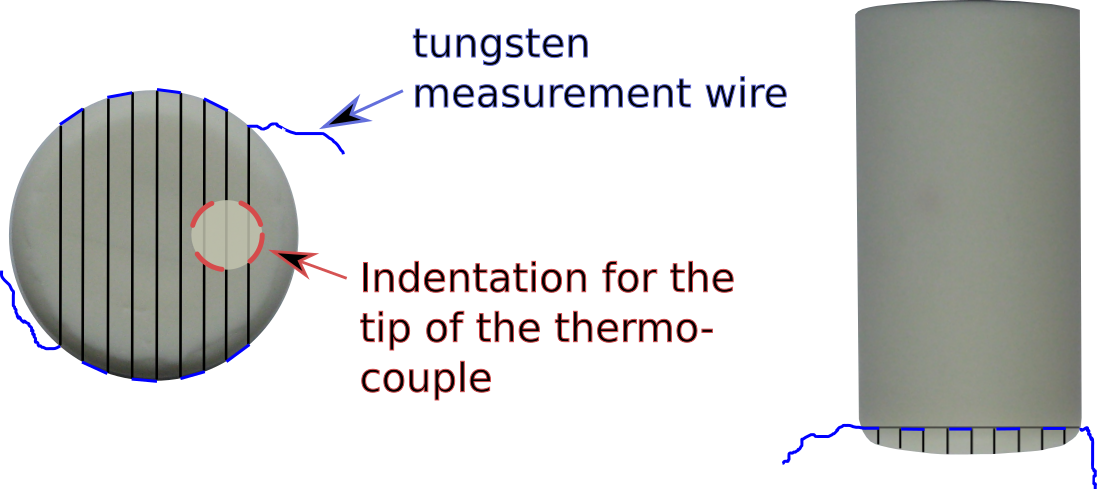
The crucible preparation deserves special attention as it is a major component of our phase transition detection method. In our setup, the actual resistivity measurement and thus the detection of latent heat anomalies takes place within the bottom of the crucible. In order to detect temperature changes of the sample material as precise as possible, a thin measurement wire has to be placed as close as possible to the melt without direct contact, covering as big part of the melt surface as possible. Therefor, we use a tungsten wire of typically m diameter which is placed in a meandering way inside the crucible bottom (Fig. 2). Several grooves are sawn into the bottom of the crucible and the measurement wire is covered by a ceramic glue. A shallow indentation is drilled afterwards into the bottom of the crucible were there thermocouple T1 is placed upon crucible installation within the process chamber.
The filled crucible is loosely covered with an alumina cap and placed in the furnace under Argon atmosphere at a pressure of 500 mbar. A piece of Zr-foil was placed on top as oxygen getter. Note that materials with elevated vapor pressure could transport and deposit outside the crucible. Growth attempts with Bi-rich flux indicate that vapor pressures of mbar at C Fischer (1966) do not lead to measurable mass loss (neglecting transport active species).
The thin tungsten measurement wire has two loose ends at each side of the crucible. These ends are connected to two tungsten rods (3 mm diameter) that are lead through the cover plate similar to T1 reaching into the heating zone. The wire ends are connected to the rods by clamping them between the planar rod tip and a screw head fixed by a hex nut from the other parallel side. The electrical contact is stable up to at least C.
Outside the furnace the rods are connected via coaxial cabels to a lock-in amplifier. The resistivity at room temperature is given by measurement wire (R 7 ), tungsten rods (R 5 m) and coaxial cabel (R 70 m). Accordingly the total resitivity is dominated by the voltage drop at the measurement wire (which is referred to as ’lock-in voltage’ or in the following).
III Experimental
Investigated alloys were Sb-In (Sb: MaTeck, 99.9999%; In: Chempur, 99.999%), Au-In (Au: Edelmet. Recycling, 99.99%), Pd-In (Pd: 99.95%, Agosi), Ni-Bi (Ni: 99.98%, GoodFellow; Bi: 99.9999%, ChemPur), Mn-Bi (Mn: 99.99%, MaTeck) and Pd-Bi (Pd: 99.95%, Agosi; Bi: 99.999%, 5NPlus).
The used crucibles were made of aluminuma (LSP Industrial Ceramics Inc., diameter 12 mm, height 25 mm).
The grooves for the W wire were prepared at the Fraunhofer-Institut für Solare Energiesysteme ISE, Wavering group in Freiberg (Germany) using a high precision multi wire diamond saw.
The tungsten rods were obtained from ChemPur (99.95%), the tungsten measurement wires from GoodFellow (99.95%).
The wires were fixed at the crucible by an aluminuma-based glue (Polytec GmbH, 903 HP, = 5.7 ).
For measuring the voltage drop at the contact wire, the lock-in models 7280 DSP (Perkin & Elmer; data shown in Figs. 7a-c, 9a-b) and MFLI 500kHz 60 MSa/s (Zurich Instruments; data shown in Figs. 4, 6, 7d-f, 8, 9c, 11) were used.
DTA measurements of binary SbIn and PdBi (37:63) alloys were performed using a Netzsch STA 449 C/3/F Jupiter DTA.
An empty crucible was used as reference for SbIn, whereas the reference crucible of the PdBi sample was filled with bismuth of the same mass.
Phase formation was verified by X-Ray powder diffraction using a Miniflex 600 diffractometer (Rigaku).
IV Detecting Liquidus and solidus temperature of ’simple’ binary alloys
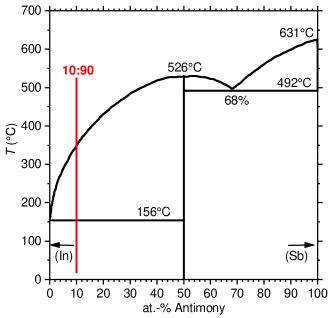
Growth process, data collection and analysis are presented in detail for Sb-In. Lumps of antimony and indium were mixed in a molar ratio of Sb:In = 1:9. According to the binary alloy phase diagram Sharma et al. (1989), two well separated phase transitions (at liquidus and solidus temperature) are expected for this composition (Fig. 3). The sample was heated up to 400∘C and kept there for 1 h in order to homogenize the melt. Afterwards the heating was turned off and the solution allowed to cool down without further external influence.
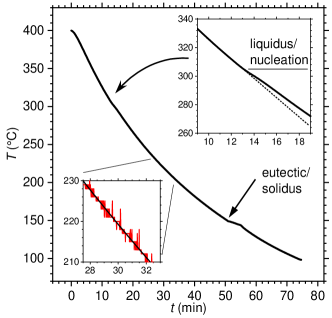
The sample temperature as a function of time, , is continuously measured by thermocouple T1. Changes in temperature cause a change of the electrical resistivity of the tungsten measurement wire. This change in resistivity is directly proportional to the voltage-drop, , measured by the lock-in amplifier. With time as an implicit parameter, can be directly related to . A plot of as a function of reveals a basically linear dependence as expected for a metal. Fitting a 2nd order polynomial to account for small deviations from linearity, yields an analytic expression for the temperature of the measurement wire . The time-dependent temperature obtained for the Sb-In alloy is shown in Fig. 4: the solidus is apparent and also the liquidus is observable with the naked eye (see upper inset). The thermocouple readings T1 offer a much lower resolution and do not allow for a reliable detection of the phase transitions (lower inset in Fig. 4).
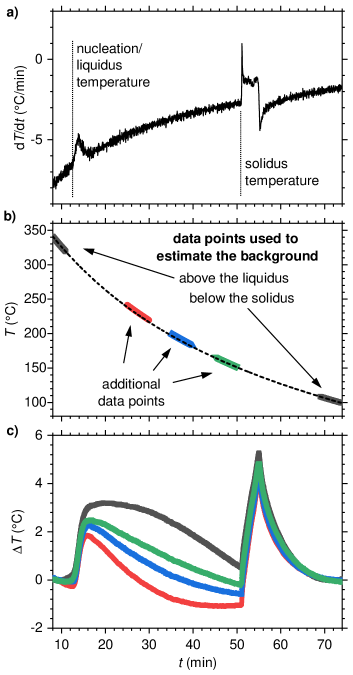
The anomalies emerging at phase transitions are better observable in the difference curves where describes the time-dependence of temperature that is not related to phase transitions. Additional measurements on empty crucibles confirmed the monotonic and featureless behavior of the background contribution. The following steps present one possibility to determine (see Fig 5a-c):
a) the derivative d/d allows to estimate liquidus and solidus temperature (as well as possible other phase transitions).
b) part of the data set above liquidus and below solidus temperature are selected that show a time-dependence that is not affected by phase transitions (here min and min, see data points in dark grey). Those data points were fitted to the following (empirical) function:
with five free parameters and . The obtained curve is shown by the black, dashed line. Additional data points can be considered that are not affected by nucleation and solidification (see colored data points in regions min, min, and min for example).
c) The phase transition temperatures appear as sharp anomalies in and do not depend on whether or how additional data points were used to fit . Since the details of in the region between liquidus and solidus depend on the amount of latent heat released during the growth of SbIn, additional data points are required for higher precision. Given that is supposed to be positive, the most reliable estimate is obtained by incorporating the region closest to the solidus (green data points, in accordance with the increasing slope of the liquidus line, see Fig. 3).
We want to emphasize that the presented determination and subtraction of was primarily performed in order to allow for a direct comparison of feedback furnace results and DTA measurements (see below). It is not necessary for an optimization of the growth procedure, which can be done by directly using the lock-in voltage for the detection of nucleation as well as for controlling the heating power of the furnace.
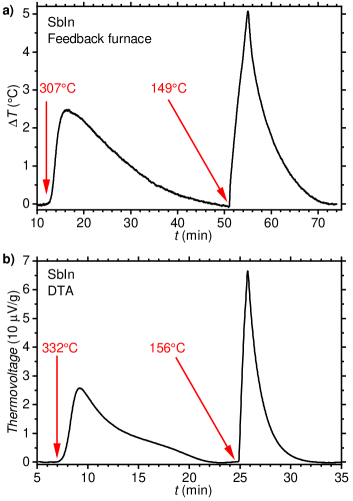
Fig. 6a shows obtained for the Sb-In alloy ( determined from above liquidus, below solidus and min). In order to compare the signatures observed in , a DTA measurement was performed in a similar fashion (Fig. 6b). There is good agreement in the shape of characteristic signatures and the resolution of the different measurement techniques are comparable. In the feedback furnace, liquidus and solidus temperatures are determined to 307∘C and 149∘C, respectively. The respective temperatures measured in the DTA-system are 332∘C and 156∘C. The liquidus temperatures differ due to different degrees of supercooling and are in reasonable agreement with previously reported values of 315∘C Liu and Perreti (1952) and C (Sharma et al., 1989).
X-Ray powder diffraction was performed on ground SbIn single crystals.
Those were separated from the flux by heating the solution above the eutectic and centrifuging afterwards Canfield et al. (2016).
The formation of the binary SbIn and small residuals of In-rich flux is confirmed.
Comparable results were achieved with the six other binary systems Ni-Bi NiBi3 Voss (1908),
Pd-Bi PdBi2 Brasier and Hume-Rothery (1959),
Mn-Bi MnBi Siebe (1919),
Au-In AuIn2 Hiscocks and Hume-Rothery (1964),
Pd-In PdIn3 Knight and Rhys (1959), and
Gd-Al AlGd2 Massalski (1986)
(the compound denoted after crystallizes upon cooling below the liquidus temperature).
The starting materials were mixed in the ratio transition metal/Gd:Bi/In/Al = 10:90.
The solutions of Ni-Bi, Mn-Bi, Au-In and Pd-Bi were homogenized for 60 minutes at 600∘C, the solution of Pd-In at 800∘C, and the solution of Gd-Al at 1000∘C.
Fig. 7 shows the obtained signatures at liquidus and solidus temperatures after background subtraction.
Significant variations are observed in the shape of the anomaly that is associated with nucleation: increases step-like for Ni-Bi and Pd-Bi at and , respectively (Fig.7a,b) and even the overall slope of (not shown) is positive indicating strong supercooling.
This behavior was reproduced in four additional cooling procedures performed for both compounds.
Mn-Bi and Sb-In (Fig.7c,d), on the other hand, show a comparatively smooth increase in at the liquidus temperature in all five measurements performed.
The absence or at least a significantly lower tendency for supercooling is inferred.
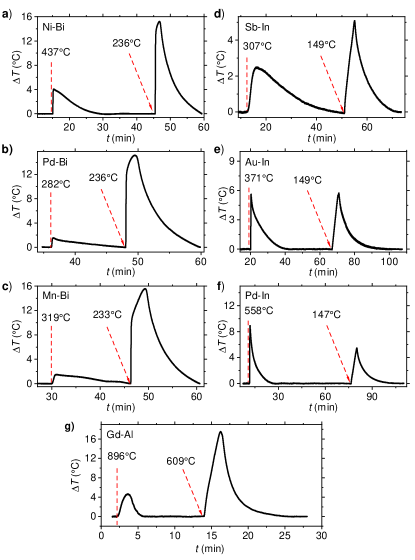
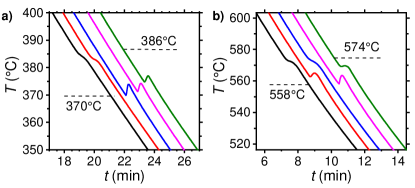
Rather unexpected observations were made for the Au-In and Pd-In alloys, with strong supercooling shown in Fig.7e,f: successive cooling procedures indicate strong supercooling in some cases whereas no such signatures are observed in other runs. This is best seen in the raw data prior to background subtraction (Fig. 8, the temperature is obtained by converting the lock-in voltage). Note that those runs were performed consecutively without adjusting the measurement technique or opening the growth chamber. In the Au-In cooling curves 1 and 2 (Fig.8a), a change of slope emerges at C and marks the liquidus temperature. In runs 3, 4, and 5, on the other hand, the temperature increases in a step-like fashion at significantly lower temperature of C. Both, shape of the anomaly and reduced temperature, indicate supercooling (by roughly C). Even alternating behavior is observed for Pd-In (Fig.8b). A relation between characteristic temperature and shape of the anomaly is recognizable: strong supercooling in runs 2 and 4 as evidenced by the lowest characteristic temperature and a strong increase in at the nucleation. Runs 1 and 3 show the anomaly at significantly higher temperature (C) and no increase in . Intermediate behavior is observed in run 5 with a moderate increase in temperature at intermediate characteristic temperature.
So far, the presented phase transitions took place at rather low temperature, with events all below C. As shown in Fig. 7g for an Al-rich solution, successful detection is possible at significantly higher temperature of C.
V Resolution limit
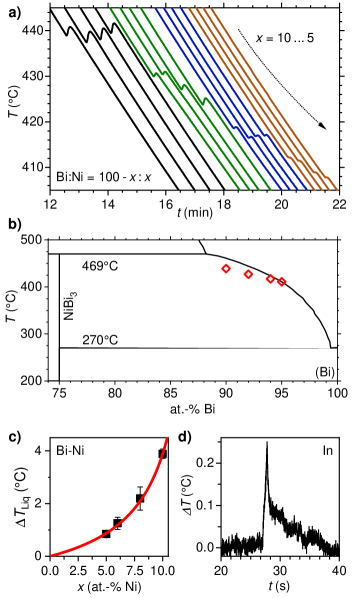
Dilution experiments were performed on a Bi-rich flux with the starting elements mixed in a ratio of Bi:Ni = 9:1. After detecting the nucleation of NiBi3 in several runs, the Bi content was increased by adding Bi pieces to the crucible, such that the Ni concentration decreased to Bi:Ni = 92:8, 94:6 and 95:5. The obtained time-dependent temperatures at the crucible (obtained by converting the lock-in voltage) are shown in Fig. 9a. As expected from the binary alloy phase diagram Voss (1908), the liquidus temperature decreases with increasing Bi concentration. Furthermore, the anomaly appears weaker due to the smaller amount of precipitating material. With the data at hand, we cannot unambiguously tell whether the tendency to supercooling is also reduced or an increase in at the nucleation is unobservable due to the smaller amount of latent heat. A comparison of obtained liquidus temperatures with the binary alloy phase diagram Voss (1908) indicates weaker supercooling for lower Ni content (Fig. 9b).
In order to estimate the lowest Ni concentration that still allows for the detection of NiBi3 nucleation, we analyzed the dependence of the anomaly in as a function of the Ni concentration (after background subtraction).
The obtained step height at the anomaly, , is shown in Fig. 9c.
The error bar represents the variation over the four runs (standard deviation).
The solid line is a fit to to a hyperbolic function [] that describes the expected decrease of the anomaly with decreasing Ni concentration.
Given that relative changes in temperature (obtained from the lock-in voltage) are detectable on a level of , the resolution limit is reached for an estimated Ni concentration of roughly 0.25 at.-%.
In addition, the resolution limit was investigated by measuring a small piece of In ( mg).
A clear signature in is observed at the solidification at C (Fig. 9d) in good agreement with the melting temperature of C Lide (2005).
The step in amounts to 0.26∘C and is roughly 10 times larger than the noise level.
With the enthalpy of fusion of In, J/g Archer and Rudtsch (2003), we estimate that phase transitions with latent heat release of mJ are detectable with the naked eye.
VI Results on Pd37Bi63
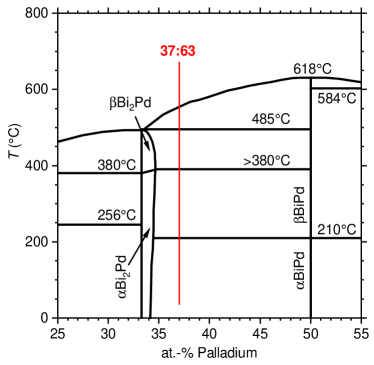
A more complex series of phase transitions is expected for PdBi mixed in a ratio of Pd:Bi = 37:63 as inferred from the binary alloy phase diagram shown in Fig. 10 (Brasier and Hume-Rothery, 1959). Even though the target compound PdBi melts congruently and can be grown by the Bridgman technique Okawa et al. (2013); Peets (2014); Sun et al. (2015), flux growth Thirupathaiah et al. (2016) offers several advantages: free growth of faceted crystals in the natural habit, ’in-situ purification’ of the starting materials, (potentially) higher diffusion rates and the use of comparatively small amounts of material. We have chosen PdBi primarily because it offers a phase diagram of intermediate complexity and structural phase transitions in addition to liquidus and solidus.
In contrast to the previous processes, regular heat pulses of 1200 ms every 10 seconds were used for heating instead of controlling the temperature by a setpoint. This resulted in a temperature profile that is not bound to a predetermined slope and, more importantly, that does not mask the anomalies caused by phase transitions. Large heating rates are employed and the maximum temperature of 700∘C is reached in roughly 27 minutes. Accordingly, the absorption of latent heat takes place over comparatively small periods in time and the associated anomalies in are better observable. Note that furnace cooling requires roughly 1 h for reducing temperature from C to C.

Fig. 11a,b shows the temperature profiles obtained in the feedback furnace. All phase transitions have been assigned according to the PdBi binary phase diagram Brasier and Hume-Rothery (1959). The extracted transition temperatures are shown in table 1 together with the results obtained by conventional DTA (see below) and literature data Brasier and Hume-Rothery (1959). Phase formation was confirmed by XRD measurements on ground single crystals. Flux removal was performed by decanting above the melting point of Bi2Pd using a frit-disc crucible Canfield et al. (2016). Residual flux was removed by polishing the crystals before the grinding. The diffraction pattern showed the presence of -PdBi as main phase with traces of PdBi2.
| Transition | Lit.Brasier and Hume-Rothery (1959) | Furnace | DTA | Furnace | DTA |
|---|---|---|---|---|---|
| -PdBi2 | >380∘C | 376∘C | 378∘C | 333∘C | 328∘C |
| -PdBi2 L | 485∘C | 476∘C | 485∘C | 458∘C | 474∘C |
| -PdBi L | 520∘C | 510∘C | 522∘C | 473∘C | 478∘C |

The values of the detected phase transitions get fortified by DTA measurements presented in Fig. 12. The reference crucible was filled with elemental bismuth that caused additional anomalies during melting and solidification. The cooling rate of C/min was similar to the one present in the feedback furnace prior to the liquidus temperature. The reported structural phase transition from -PdBi to -PdBi at Bhatt and Schubert (1979) remains elusive in DTA and feedback furnace.
VII Discussion
In the following, we discuss the advantages and development potential of the feedback furnace by elaborating on the difficulties associated with the standard procedure of collecting and using information on phase transitions prior to the growth process in standard laboratory furnaces. DTA and the related DSC (Differential scanning calorimetry) are well established techniques for detecting phase transitions in various kinds of condensed matter. Starting from the 1940s Speil (1944), methods and implementations were constantly improved Chiu and Prenner (2011). The application of DTA and DSC results to solution growth is, however, not straightforward and connected with various challenges. First of all, the actual spread of determined phase transition temperatures given in phase diagrams can be larger than anticipated from the (normally) smooth lines plotted; see, for example, a detailed study on the Li-N system published by Sangster and Pelton Sangster and Pelton (1992) and compare with the standard presentation shown in the renowned phase diagram collections Okamoto . Various further problems are encountered in the application of DTA to crystallization from high-temperature solutions in particular for reactive materials Elwell et al. (1969); Neate et al. (1971).
Furthermore, it is well known that the actual temperature of the melt can significantly deviate from the nominal temperature displayed by standard laboratory furnaces. Accordingly, even highly accurate DTA/DSC results are not always applicable with nominal precision in particular when aging of thermocouples and temperature-dependence of gradients are taken into account. We avoid these problems by utilizing the feedback method: The hitherto crucial measurement of the absolute temperature merely serves as an additional source of information. The state of a sample is determined not by the nominal temperature in the process chamber, but by the onset or absence of characteristic signatures directly originating in the crystallization processes of the sample material.
Supercooling presents another difficulty that hampers the application of knowledge on liquidus temperatures determined by DTA/DSC. The degree of supercooling can depend on purity of starting materials, crucible material and crucible shape. The feedback furnace allows estimating the tendency for supercooling by the shape of nucleation anomalies and comparing heating and cooling curves directly in the crystal growth setup. This enables extremely slow cooling rates or extended hold times in a barely supercooled state. Detecting the nucleation and estimating the degree of supercooling opens the possibility to perform ’seed selection’ by oscillating the temperature around the liquidus.
VIII Summary
We present a novel phase transition detection method and its implementation in a crystal growth setup for solution growth in controlled atmospheres at temperatures up to C. A thin measurement wire is mounted in close vicinity to the melt and acts as highly precise, resistive thermometer. Anomalies in the time-dependent temperature are associated with phase transitions in the sample material. In contrast to established DTA and DSC measurements, there is no reference crucible employed allowing for an efficient and symmetric design of the growth chamber. The feedback furnace combines crystal growth with a thermal analysis of the sample material. Both heretofore locally and temporally separated processes take place in the same crucible at the same time, as the furnace detection method gets applied at the actual solution growth sample, showing the same anomalies without a necessary transfer from detection to growth apparatus. The furnace detection and growth system provides a method has that offers a considerable increase in efficiency and accuracy for many solution growth processes.
Liquidus and solidus temperature were successfully detected in seven different binary alloys in good agreement with DTA results. An additional structural transition was detected in Bi2Pd. Shape of the characteristic anomalies and comparison of heating and cooling curves allow to estimate the degree of supercooling. Given that there is no direct contact of measurement wire and melt, there are no restrictions on the choice of the (ceramic) crucible material beyond standard requirements. An optimized version of the feedback furnace is going to be available https://scidre.de/product/feedbackfurnace . With the in-situ detection in the feedback furnace, a method has been established that offers a considerable increase in efficiency and accuracy for various solution growth processes. Further improvements of sensitivity and precision by higher sampling rates and advanced, real-time data analysis are anticipated.
IX Acknowledgement
We thank Alexander Herrnberger, Klaus Wiedenmann, Patrick Schütze, and Maik Jurischka for technical support. This work was supported by the Deutsche Forschungsgemeinschaft (DFG, German Research Foundation) - Grant No. JE748/1 and the ZIM program of the German Ministry for Economic Affairs and Energy (BMWi).
References
- Elwell and Scheel (1975) D. Elwell and H. J. Scheel, Crystal Growth from High-Temperature Solutions (Academic Press Inc., London, 1975).
- Canfield and Fisher (2001) P. C. Canfield and I. R. Fisher, J. Cryst. Growth 225, 155 (2001).
- Kanatzidis et al. (2005) M. M. Kanatzidis, R. Pöttgen, and W. Jeitschko, Angew. Chem. Int. Ed., 44, 6996 - 7023 (2005).
- Jesche and Canfield (2014) A. Jesche and P. C. Canfield, Philos. Mag. 94, 2372 (2014).
- (5) https://scidre.de, .
- Fischer (1966) A. K. Fischer, J. Chem. Phys. 45, 375 (1966), https://doi.org/10.1063/1.1727337 .
- Sharma et al. (1989) R. Sharma, T. Ngai, and Y. Chang, Bull Alloy Phase Diagr. (1989).
- Liu and Perreti (1952) T. Liu and E. Perreti, Trans. ASM, 44, 539-548 (1952).
- Canfield et al. (2016) P. Canfield, T. Kong, U. Kaluarachchi, and N. H. Jo, Philos. Mag., 96, 84-92 (2016).
- Voss (1908) G. Voss, Z. Anorg. Allg. Chem. 57, 52-58 (1908).
- Brasier and Hume-Rothery (1959) J. Brasier and W. Hume-Rothery, J. Less-Common Met. (157-164), Vol. 1 (1959).
- Siebe (1919) P. Siebe, Z. Anorg. Allg. Chem. 108, 161-171 (1919).
- Hiscocks and Hume-Rothery (1964) S. Hiscocks and W. Hume-Rothery, Proc. R. Soc. London, Ser. A, A282, 318-330 (1964).
- Knight and Rhys (1959) J. Knight and D. Rhys, J. Less-Common Met. 1 292-303 (1959).
- Massalski (1986) T. B. Massalski, ed., Binary Alloy Phase Diagrams, Vol. 1 (William W. Scott, 1986).
- Lide (2005) D. R. Lide, ed., Handbook of Chemistry and Physics, 85th ed. (CRC Press, 2004-2005).
- Archer and Rudtsch (2003) D. G. Archer and S. Rudtsch, J. Chem. Eng. Data 48, 1157 (2003).
- Bhatt and Schubert (1979) Y. C. Bhatt and K. Schubert, J. Less-Common Met. 64, P17 (1979).
- Okawa et al. (2013) K. Okawa, M. Kanou, T. Katagiri, H. Kashiwaya, S. Kashiwaya, and T. Sasagawa, Physics Procedia Proceedings of the 25th International Symposium on Superconductivity (ISS2012), 45, 101 (2013).
- Peets (2014) D. C. Peets, J. Phys. Conf. Ser. 568, 022037 (2014).
- Sun et al. (2015) Z. Sun, M. Enayat, A. Maldonado, C. Lithgow, E. Yelland, D. C. Peets, A. Yaresko, A. P. Schnyder, and P. Wahl, Nat. Commun. 6, 6633 (2015).
- Thirupathaiah et al. (2016) S. Thirupathaiah, S. Ghosh, R. Jha, E. Rienks, K. Dolui, V. Ravi Kishore, B. Büchner, T. Das, V. Awana, D. Sarma, and J. Fink, Phys. Rev. Lett. 117, 177001 (2016).
- Speil (1944) S. Speil, Applications of thermal analysis to clays and aluminous minerals, Tech. Rep. (Bur. Mines Rep. Invest., 1944).
- Chiu and Prenner (2011) M. H. Chiu and E. J. Prenner, J Pharm Bioallied Sci. 3, 39 (2011).
- Sangster and Pelton (1992) J. Sangster and A. D. Pelton, J. Phase Equilib. 13, 291 (1992).
- (26) H. Okamoto, Li-N Phase Diagram, ASM Alloy Phase Diagrams Center, P. Villars, editor-in-chief; H. Okamoto and K. Cenzual, section editors; http://www1.asminternational.org/AsmEnterprise/APD, ASM International, Materials Park, OH, 1998.
- Elwell et al. (1969) D. Elwell, B. W. Neate, and S. H. Smith, Journal of thermal analysis 1, 319 (1969).
- Neate et al. (1971) B. W. Neate, D. Elwell, S. H. Smith, and M. D. Agostino, J. Phys. E: Sci. Instrum. 4, 775 (1971).
- (29) https://scidre.de/product/feedbackfurnace, .