A carbon-rich hot bubble in the planetary nebula NGC 5189
Abstract
We present the discovery of extended X-ray emission from the planetary nebula (PN) NGC 5189 around the [WO1]-type WD 1330-657 with XMM-Newton. The X-ray-emitting gas fills the cavities detected in the Hubble Space Telescope [O iii] narrow-band image and presents a limb-brightened morphology towards the outer edges of the east and west lobes. The bulk of the X-ray emission is detected in the soft (0.3–0.7 keV) band with the XMM-Newton EPIC spectra dominated by the C vi Ly line at 0.37 keV (=33.7 Å). Spectral analysis resulted in carbon and neon abundances 38 and 6 times their solar values, with a plasma temperature of keV ( K) and X-ray luminosity of erg s-1. NGC 5189 is an evolved and extended PN (0.70 pc in radius), thus, we suggest that the origin of its X-ray emission is consistent with the born-again scenario in which the central star becomes carbon-rich through an eruptive very late thermal pulse, subsequently developing a fast, carbon-rich wind powering the X-ray emission as suggested for A 30 and A 78.
1 Introduction
Hot bubbles in planetary nebulae (PNe) are one of the direct confirmations of the interacting stellar wind model (Kreysing et al., 1992; Apparao, & Tarafdar, 1989; Guerrero et al., 2000). The formation of hot bubbles has been described as the direct interaction of the fast wind from the central star (CSPN) with the previously ejected dense and slow asymptotic giant branch (AGB) material. The fast wind (=500–4000 km s-1; Guerrero & De Marco, 2013) slams into the AGB material producing an adiabatically-shocked region around the CSPN with temperatures in excess to 107 K (see Dyson & Williams, 1997; Volk, & Kwok, 1985).
High-quality X-ray observations, such as those obtained with XMM-Newton and Chandra, have unveiled in unprecedented detail the distribution and physical properties of hot bubbles in PNe (see Kastner et al., 2000; Guerrero et al., 2005; Gruendl et al., 2006; Kastner et al., 2008; Ruiz et al., 2013, and references therein). Hot bubbles appear to fill the inner cavities in PNe, and when the bubble is resolved or the photon count rate is high, the X-ray-emitting gas appears to be limb-brightened (e.g., Chu et al., 2001; Montez et al., 2005). The estimated plasma temperatures derived from spectral fitting are a few times 106 K, which is at least an order of magnitude below theoretical expectations.
This temperature discrepancy has been known and widely discussed in the past decades (e.g., Soker & Kastner, 2003; Steffen et al., 2008; Toalá & Arthur, 2018). Two possible physical mechanisms that might reduce the temperature of the hot bubble have been proposed in the literature: i) thermal conductivity and ii) hydrodynamical mixing. In the first case, hot electrons transfer energy to the outer nebular material; the inclusion of cold (104 K) material raises the density and lowers the temperature at its outer edge (Weaver et al., 1977; Steffen et al., 2008). Secondly, multi-dimensional numerical simulations predict that the wind-wind interaction region will produce clumps and filaments due to Rayleigh-Taylor and thin shell instabilities naturally mixing the outer nebular material (Toalá & Arthur, 2018, and references therein).
The Chandra planetary nebula Survey (ChanPlaNS) has been designed to study the origins and properties of X-ray emission from PNe in the solar neighborhood ( kpc; Kastner et al., 2012). Among the main results of the ChanPlaNS is that mostly young (age 5000 yr) and compact (radius 0.2 pc) PNe will be detected in X-rays. Furthermore, most of the targets that exhibit extended X-ray emission are those PNe that drive powerful winds, namely those that harbor [Wolf-Rayet]([WR])-type central stars (Kastner et al., 2012; Freeman et al., 2014). ChanPlaNS has also peered into the properties of CSPNe showing that there are two classes of CSPN with hard X-ray emission (see Montez et al., 2015). The first ones, CSPN with high-temperature plasmas and high X-ray luminosities, are correlated to active binary companions (Montez et al., 2010). The second class exhibit lower-plasma temperature with their X-ray and bolometric luminosities following the relation, similar to massive hot stars (Pallavicini et al., 1981; Nebot Gómez-Morán & Oskinova, 2018), for which it has been suggested that the X-ray emission is due to self-shocking winds.
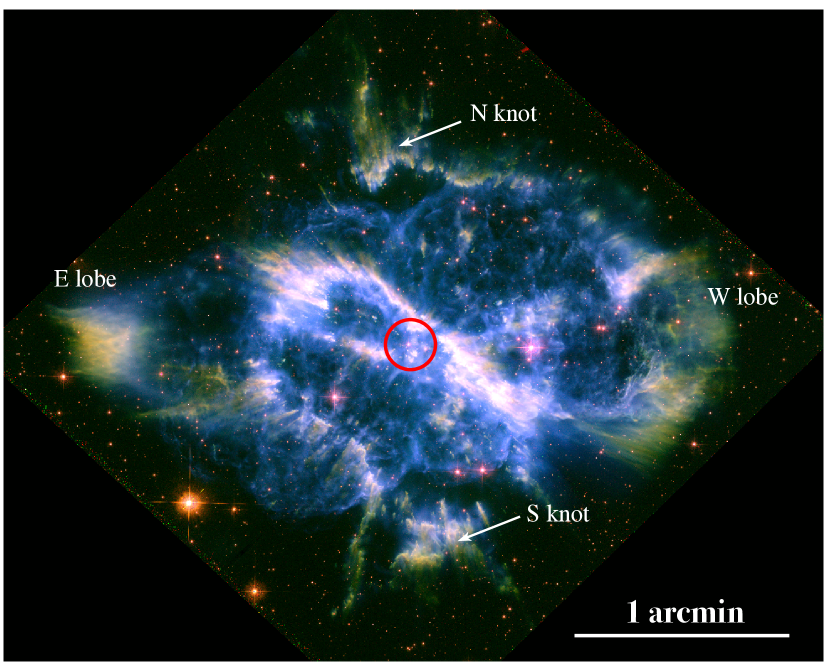
In this paper we present the discovery of a hot bubble within the PN NGC 5189 (a.k.a. PN G307.203.4) which harbors the [WO1]-type star WD 1330-657 (Acker & Neiner, 2003). This PNe has an intricate morphology (see Fig. 1) with at least three pairs of bipolar lobes protruding from the central region that is mainly traced by the [O iii] emission plus a pair of low-ionization structures located at the northern and southern regions (hereafter knot N and S). Sabin et al. (2012) reported the presence of an apparent toroidal structure around the CSPN through near- and mid-IR images and suggested that this was a dust-rich structure that could have interacted with the CSPN fast wind to produce the expansion of the lobes in NGC 5189 along the E-W direction. Recently, Danehkar et al. (2018) showed the ionization structure of NGC 5189 based on the analysis of Hubble Space Telescope (HST) WFC3 observations, exposing the presence of low-ionization structures within this PN in great detail.
This paper is organized as follows. In Section 2 we present our XMM-Newton observations and data preparation. In Section 3 we present our results. A discussion is presented in Section 4 and, finally, the conclusions are presented in Section 5.
2 XMM-Newton Observations
NGC 5189 was observed with XMM-Newton during 2018-02-05 with the three European Photon Imaging Cameras (EPIC) pn, MOS1, and MOS2 (PI: R. Montez; Obs. ID.: 0801960101). The three EPIC cameras were operated in the full frame mode with the thin optical blocking filter. The total observing times for the EPIC pn, MOS1, and MOS2 were 84.95 ks, 86.56 ks, and 86.53 ks, respectively.
The observations were processed with the XMM-Newton Science
Analysis System (SAS) version 17.0
(Gabriel et al., 2004)111The Users Guide to the XMM-Newton SAS can be found
in:
https://xmm-tools.cosmos.esa.int/external/xmm_user_support/documentation/sas_usg/USG/.
First, we used the Extended Source Analysis Software package (ESAS)
tasks to unveil the distribution of the extended emission from
NGC 5189. The ESAS tasks apply restrictive selection criteria of
events, reducing the possible contamination from the astrophysical
background, the soft proton background, and solar wind charge-exchange
reactions, all with important contributions at energies
1.5 keV. The final net exposure times after processing the EPIC
data with the ESAS tasks are 32.2 ks, 41.07 ks, and 44.6 ks for the
pn, MOS1, and MOS2 cameras.
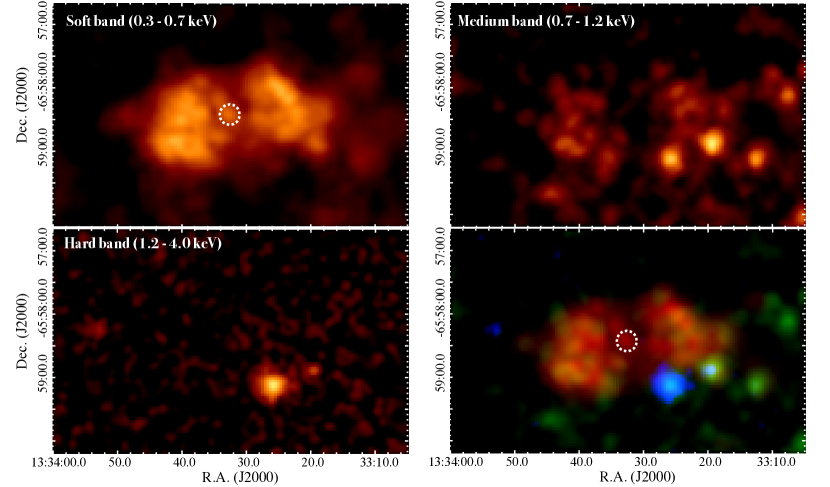
Individual background-subtracted, exposure-corrected EPIC pn, MOS1, and MOS2 images were created and merged together. We created EPIC images in the soft (0.3–0.7 keV), medium (0.7–1.2 keV), and hard (1.2–4.0 keV) bands. The resultant X-ray images of each band as well as a color-composite image are presented in Figure 2.
To study the physical properties of the hot gas in NGC 5189, we have extracted background-subtracted EPIC spectra. The data were reprocessed using the SAS tasks epproc and emproc to produce the EPIC pn and MOS event files. Lightcurves were created in the 10–12 keV energy range for each camera and were examined to search for periods of high background levels. We rejected time intervals where the background count rate was higher than 0.2 counts s-1 for both MOS cameras and 0.5 counts s-1 for the pn camera. The resulting exposure times after this process were 36.64 ks, 53.27 ks, and 55.39 ks for the pn, MOS 1 and MOS 2, respectively, thus reducing the useful observing time by 40-60%.
3 Results
3.1 Distribution of the hot gas in NGC 5189
The XMM-Newton EPIC images reveal the presence hot gas within NGC 5189. Figure 2 shows that the X-ray-emitting gas is mainly distributed toward the E and W lobes with lower surface brightness in the central region. The extended emission is dominated by the soft (0.3–0.7 keV) X-ray band with some contribution from the medium (0.7–1.2 keV) band. There is no contribution to the extended emission from the hard (1.2–4.0 keV) band. We note that the CSPN is marginally detected in the soft X-ray band. Background or field sources can be seen in the immediate vicinity of NGC 5189, in particular, two bright and hard sources lie just south of the W lobe.
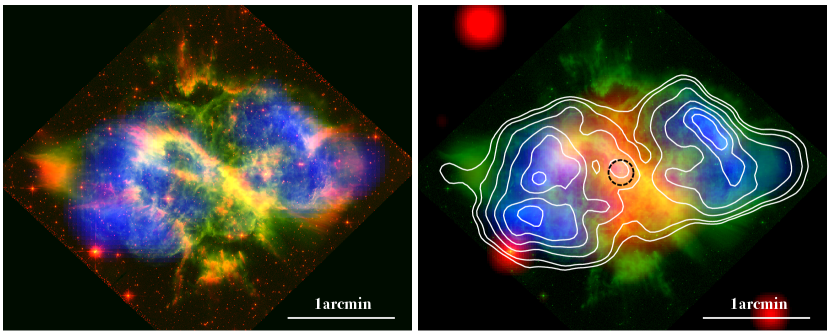
To produce a clear distribution of the X-ray-emitting gas we excised all point sources from the soft X-ray image using the CIAO (Version 4.9; Fruscione et al., 2006) task dmfilth. The resulting image is used in the color composite image shown in Figure 3, along with the H and [O iii] HST images and the WISE 12 m image. Figure 3 left panel shows that the hot gas in NGC 5189 fills the lobes detected by the [O iii] emission. Thus, the extent of the hot bubble (shocked, fast wind) does not reach the N and S knots. The right panel in Figure 3 shows that the X-ray emission might be anti-correlated with the emission from the near-IR as detected by WISE, suggesting some absorption due to the presence of dust-rich torus around the CSPN, but the detection of very soft X-ray emission from the CSPN suggests otherwise (see discussion section).
Finally, we have overplotted the contours of the extended emission on the right panel of Figure 3. Faint emission is marginally detected toward the tips of the E and W lobes.
3.2 Physical properties of the hot bubble in NGC 5189
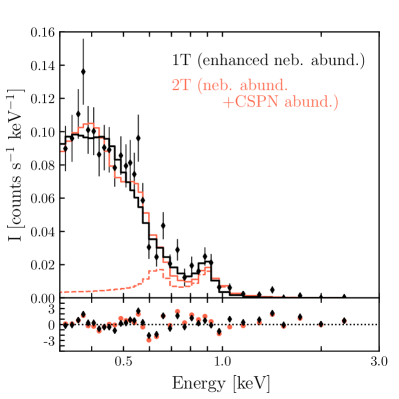
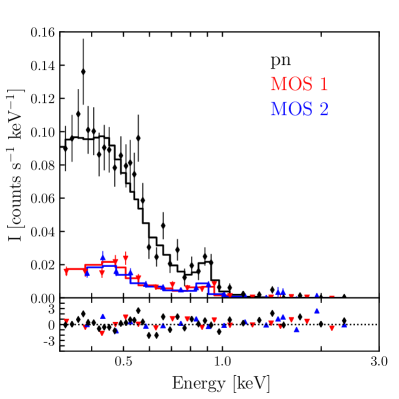
The background-subtracted EPIC spectra of the diffuse X-ray emission are presented in Figure 4. The spectra of NGC 5189 are very soft with most of the diffuse X-ray emission detected in the 0.3–1.5 keV energy range and dominated by emission below 0.6 keV. The peak of emission is present at 0.36–0.38 keV which may be due to the C vi emission line at 0.37 keV (=33.7 Å). A secondary peak between 0.5–0.6 keV may be due to the O vii triplet at 0.58 keV (22 Å). Some emission in the spectrum around 0.8–1.0 keV may be related to the Fe complex and/or Ne xi lines. The corresponding count rates are 35.41 counts ks-1 for the pn camera and 7.70.60 counts ks-1 for the MOS cameras. These correspond to total counts of 130050 photons, 41033 photons, and 43030 photons for the pn, MOS1, and MOS2 cameras, respectively.
We modeled the XMM-Newton EPIC spectra with XSPEC (Version 12.10.1; Arnaud, 1996) using an absorbed, optically-thin thermal plasma model (vapec). We initially adopted nebular abundances from García-Rojas et al. (2013) but these abundances did not produce a good fit, so some elements were allowed to vary to improve the fits. For comparison and discussion, in Table 1 we list the nebular and CSPN abundances of NGC 5189 reported by García-Rojas et al. (2013) and Keller et al. (2014), respectively.
| Element | NGC 5189b | CSPNc | This workd |
|---|---|---|---|
| He | 1.26 | 8.40 | 1.26 |
| C | 2.90 | 325 | 38 |
| N | 3.55 | 35 | 3.55 |
| O | 0.70 | 50 | 0.70 |
| Ne | 1.50 | 90 | 6.0 |
| S | 0.80 | 0.80 | |
| Ar | 1.40 | 1.40 | |
| Fe | 0.001 | 0.001 |
The absorption was included with the tbabs absorption model (Wilms et al., 2000). A preliminary estimate of the hydrogen column density of cm-2 is obtained from the =0.324 mag (see Danehkar et al., 2018; García-Rojas et al., 2012), but this parameter was allowed to vary. Finally, we note that we binned the spectrum to a minimum of 50 counts per bin.
The first attempt to fit the the EPIC-pn spectrum with nebular abundances did not yield a good fit (). The fit was improved by leaving the carbon and neon abundances as free parameters. Other elements were allowed to vary, but they did not result in any significant improvements to the fit. For example, the nitrogen abundance converged to values close to its nebular value, so it was fixed to the nebular values.
The best-fit model (=1.36) to the EPIC-pn spectrum resulted in a plasma temperature of =(0.14 keV (=1.6106 K) with an hydrogen column density of =(2.10.6)1021 cm-2, the latter is consistent with the measurements. The carbon and neon abundances resulted in 33 and 6.8 times their solar values (Anders & Grevesse, 1989). The absorbed and intrinsic fluxes in the 0.3–3.0 keV are erg s-1 cm-2 and erg s-1 cm-2. At a distance of 1.68 kpc (Kimeswenger & Barría, 2018) this corresponds to an X-ray luminosity of erg s-1. This model is shown in the left panel of Figure 4 as a solid black line.
We also fitted the three EPIC cameras simultaneously and the best-fit model (=1.08) resulted in a plasma temperature of =0.14 keV with carbon and neon abundances 38 and 6 times their solar values, respectively. The absorbed and intrinsic fluxes of this model are =(5.81.7)10-14 erg s-1 cm-2 and 10-13 erg s-1 cm-2, with a corresponding luminosity of erg s-1. This model is shown in the right panel of Figure 4.
In order to assess possible differences between the west and east lobes of NGC 5189, we extracted a spectrum from each region and modeled each separately. Their best-fit models are consistent with that obtained for the entire X-ray emission. Thus, within error bars, no spectral variations are detected from the different lobes.
The high C abundance and plasma temperature suggest a carbon-enriched hot bubble in NGC 5189. As an additional test, we tried a two-temperature plasma emission model for the EPIC-pn spectrum. We set plasma to nebular abundances and another one to CSPN abundances from Table 1. This model (=1.57) resulted in plasma temperatures of =0.09 keV and =0.34 keV. This model is shown in the left panel of Figure 4. The contribution from the plasma with abundances as those from the CSPN is also shown as a dashed line. We note that this spectral model predicts that the CSPN should emit primarily from 0.5–1.0 keV, however, there appears to be little to no emission from the CSPN in this energy range according to Figure 2.
3.3 X-ray properties of the CSPN (WD 1330657)
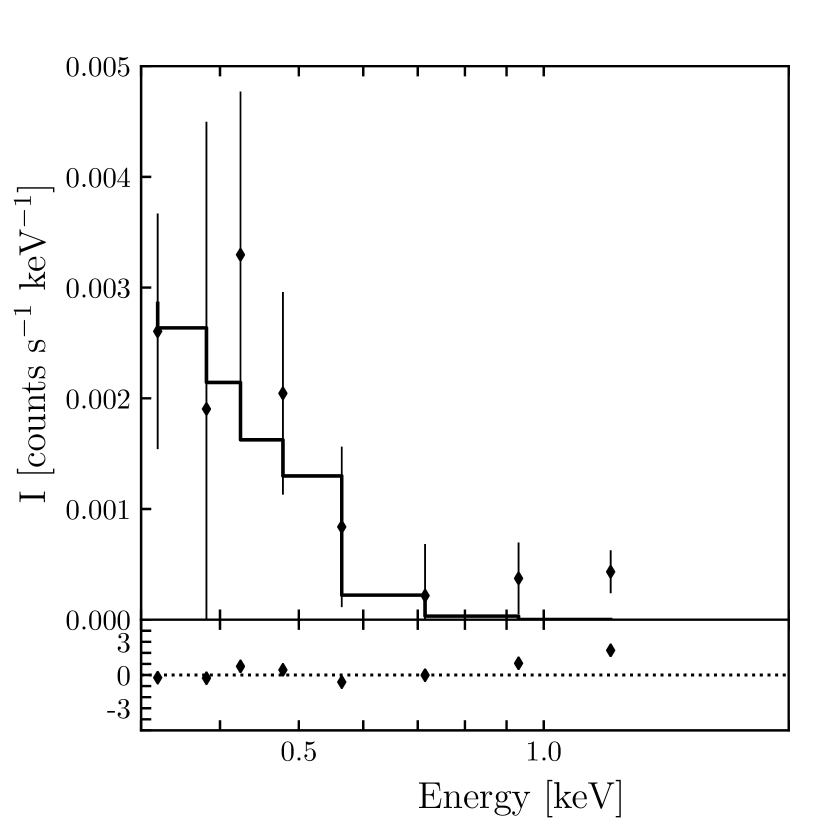
The CSPN of NGC 5189, WD 1330-657, is marginally detected in the soft X-ray band (see Fig. 2). We have extracted an EPIC-pn spectrum of this source. The background has been extracted from a region around the central source to eliminate any possible contribution from the hot bubble. The resulting background-subtracted EPIC-pn spectrum is presented in Figure 5. The spectrum is soft and, similar to the X-ray spectra of the extended emission, it peaks at energies below 0.5 keV. The net count rate in the 0.3–2.0 keV band is 0.860.21 counts ks-1. This is a total count of 327 photons.
We fit the EPIC-pn spectrum with a one-temperature thermal plasma model (vapec) with abundances set to those reported for WD 1330657 (Table 1) and with the set to that estimated from the measurements. The best-fit model (=1.20) resulted in a plasma temperature of keV (=106 K). The observed and intrinsic fluxes in the 0.3–2.0 keV energy range are erg s-1 cm-2 and erg s-1 cm-2, respectively. This corresponds to a luminosity of erg s-1.
According to the best-fit model to the stellar spectrum of WD 1330-657 presented by Keller et al. (2014), the central star of NGC 5189 has a bolometric luminosity of L⊙222Were we have rescaled the bolometric luminosity obtained by Keller et al. (2014) to the distance of 1.68 kpc.. Thus, WD 1330-657 has a of . The X-ray temperature and luminosity suggest that the X-ray emission from the vicinity of the CSPN is mainly due to shocks in the stellar winds from WD 1330-657 and not a spun-up binary companion.
4 Discussion
The discovery of extended, soft X-ray emission in NGC 5189 reveals true extension of the effects of the fast wind from the [WR]-type star WD 1330-657. The X-ray-emitting material is primarily detected inside the lobes of NGC 5189 as defined by the [O iii] emission. The N and S knots, which reside beyond the [O iii] shell, are not interacting with the hot bubble emission powered by the fast CSPN stellar wind as suggested by (Sabin et al., 2012). Some soft (0.3–0.7 keV) X-ray emission is detected from the edges of the E and W lobes and might suggest a possible leakage of the hot bubble beyond the [O iii] boundary, but we note that Sabin et al. (2012) find no clear evidence of kinematic signature of fast components such as jets.
The X-ray-emitting material appears limb-brightened towards the outer edges of the E and W lobes. In other words, the regions close to the star have a lower emissivity. The lower emissivity could be intrinsic to the source or caused by overlying absorption. Indeed, Sabin et al. (2012) have suggested that the IR emission detected around the CSPN of NGC 5189 might be due to the presence of a dust-rich structure. However, an inspection of the ISO spectrum of NGC 5189 reveals only a modest contribution from dust amid bright emission lines at 10.5 m and 15.5 m, likely corresponding to [S iv] and [Ne iii] lines, and which dominate the WISE 12 m band. A strong emission line at m, possibly due to the [O iv] or [Fe ii], dominates the WISE 22 m band suggesting that the IR emission detected around the CSPN is likely dominated by highly-ionized emission lines which might be evidence of evaporation of material around the CSPN (see following subsection). This notion is further supported by the fact that the CSPN is hot ( kK; Keller et al., 2014) and is detected in the absorption-sensitive soft X-ray band with little evidence for enhanced absorption from the X-ray spectral fitting.
We suggest that the limb-brightened morphology of the diffuse X-ray emission in NGC 5189 might arise from the scenario proposed by Akashi et al. (2008). These authors presented numerical simulations in which a PN is shaped by a bipolar fast wind (a jet) creating a hot bubble capable of producing soft X-ray emission. Their models predict that the X-ray emissivity will peak at the outer edges of the lobes (see figure 1 in Akashi et al., 2008).
4.1 The origin of the X-ray emission in NGC 5189
One of the main results of the ChanPlaNS project is that diffuse X-ray emission from a hot bubble is mainly detected in compact PNe with radii 0.2 pc. The X-ray emitting E and W lobes of NGC 5189 extend to up to 1.42′ which, at a distance of 1.68 kpc, correspond to a hot bubble cavity with a radius of 0.7 pc. Other large and highly-evolved PNe in the ChanPlaNS survey of similar size to NGC 5189 (A 33, LoTr5, HFG 1, DS 1), do not indicate any diffuse X-ray emission. Hence, NGC 5189 is the largest PN with diffuse X-ray emission and its detection is unexpected.
Although the X-ray emission from evolved PNe are expected to be enriched with nebular material due to hydrodynamical mixing or the thermal conduction effect (see Section 1), our spectral analysis has unveiled that the X-ray-emitting gas in NGC 5189 is strongly carbon-enriched. This carbon abundance (38 times its solar value) is larger than the carbon abundance reported for the nebula (see Table 1). There are three other cases in which this same scenario is presented. The young and compact PN BD30∘3639 (Yu et al., 2009; Kastner et al., 2000) and the so-called born-again PNe A 30 and A 78 (Guerrero et al., 2012; Toalá et al., 2015), which also harbor [WR]-type carbon-rich CSPN. Since BD30∘3639 is young, it has been suggested that its X-ray emission is mainly due to the shocked, unmixed stellar wind (e.g., Yu et al., 2009; Toalá & Arthur, 2016).
In the born-again PNe A 30 and A 78 (and possibly also in NGC 40; see Toalá et al., 2019), it has been suggested that the X-ray emission originated as a result of a relatively recent (1000 yr; Fang et al., 2014) very late thermal pulse, in which hydrogen-deficient, carbon-rich material was ejected into their evolved PN (11,000 yr; see Herwig et al., 1999; Miller Bertolami et al., 2006). In A 30, A 78 and NGC 5189, the X-ray emission is dominated by the C vi Ly emission line at 0.37 keV (33.7 Å) and their CSPNe share similar luminosities and effective temperatueres (log10(/L⊙)=3.7–3.8, =120–170 kK; e.g., Guerrero et al., 2012; Toalá et al., 2015; Keller et al., 2014), which are too luminous for their old and evolved PNe. These properties suggest that NGC 5189 could have experienced the born-again evolutionary path like that of A 30 and A 78.
Although the carbon and neon abundances determined from the extended X-ray emission from NGC 5189 are high compared to the nebular abundances, they are not as high as those of the CSPN (Table 1). This may be an indicative of the mixing process between the carbon-rich hot bubble and the nebular material, which causes the dilution of the highly carbon enriched stellar material abundance of the shocked X-ray-emitting material.
Alternatively, a binary interaction (similar to that of a nova eruption on an O-Ne-Mg WD) has also been invoked in order to explain the specific C/O abundance ratio from born-again PNe (Wesson et al., 2003, 2008). Lau et al. (2011) summarized the abundance determination from born-again PNe and from different models in their Table 1. We note that the mass fractions of helium, carbon, oxygen and neon from the CSPN of NGC 5189 are not consistent with those reported for nova predictions, but are more consistent with the late thermal pulse scenario.
WD 1330-657 hosts a companion with an orbital period of 4.04 d (Manick et al., 2015), although this companion might have been involved in the early shaping of NGC 5189 (e.g., Manick et al., 2015; Frank et al., 2018; Chamandy et al., 2018), it may not be involved in powering the extended X-ray emission nor the emission from the vicinity of the CSPN. The relatively soft nature of the tentative X-ray detection of the CSPN (WD 1330-657) and its estimated log ratio, suggest that self-shocking winds might be the dominant factor in the production of X-rays from the CSPN as opposed to a spun-up companion (Montez et al., 2010, 2015). The spectrum and physical properties (, , ) of the CSPN are similar to those of the CSPN of PN K 1-16, which was detected serendipitously by both Chandra and XMM-Newton (Montez & Kastner, 2013). For PN K 1-16, where only the CSPN is detected, the X-ray emission is consistent with a self-shocking wind in a carbon-rich environment.
5 Conclusions
We presented the discovery of extended X-ray emission from the PN NGC 5189 around the [WR]-type star WD 1330-657. NGC 5189 harbors a carbon-enriched X-ray-emitting plasma with the largest hot bubble radius of all PNe detected thus far in X-rays. Our findings can be summarized as follows:
-
•
The distribution of the X-ray-emitting gas delimited by the [O iii] emission (Figure 3). The extent of the hot bubble does not reach the N and S knots suggesting that there is no dynamical interaction between the knots and the shell with the N and S knots. Hence, the cometary shape of these knots are likely due to the photoevaporation by UV flux.
-
•
Analysis of the spatial distribution of the X-ray-emitting gas in NGC 5189 suggests the presence of possible hot bubble blowouts at the farthest regions of the W and E lobes.
-
•
The spectrum of the diffuse X-ray-emitting hot bubble gas in NGC 5189 is soft with the bulk of the X-ray emission detected at energies below 0.6 keV. This is dominated by the C vi emission line at 0.37 keV (33.7 Å).
-
•
The EPIC spectra could not be modelled with nebular nor CSPN abundances. We found that the X-ray-emitting material has carbon and neon abundances 38 and 6 times solar values, respectively.
-
•
The presence of the carbon-rich hot bubble in this extended and old PNe suggests an extreme physical process such as that of the born-again PNe A 30 and A 78. In this scenario, these PNe are thought to undergo a very late thermal pulse that further ejects carbon-rich material found in the hot bubble. This scenario is supported in NGC 5189 by the fact that the estimated abundances of the hot bubble reside between those of the PN and the CSPN.
-
•
Although the binary companion of the CSPN might have been involved in the shaping of NGC 5189, it does not seen to be involved in the marginally detected X-ray emission from WD 1330-657. The origin of its X-ray emission is similar to that of K 1-16 and other soft X-ray emitting CSPN, and likely caused by self-shocking winds such as those observed from hot massive stars.
To summarize, we suggest that NGC 5189 was initially shaped by a common-envelope process, but soon after the CSPN might have experienced a very late thermal pulse that resulted in the WR characteristics of WD 1330-657 and which subsequently powered the formation of the large hot bubble. Hence, the extended X-ray emission is the result of the mixing between the carbon-rich hot bubble and the nebular material from NGC 5189.
Follow-up XMM-Newton observations, with a longer exposure and higher signal-to-noise, are needed to better determine the detailed spatial distribution and physical characteristics of the extended X-ray emission. Future observations with higher spectral and spatial resolution, such as those that will be provided by , will help accurately determine the abundance of the X-ray-emitting gas in NGC 5189 and its CSPN. Improved C and Ne abundances will further probe the carbon enrichment origins of NGC 5189 proposed here. Furthermore, spectroscopic and high-resolution IR observations of the central region of NGC 5189 would help assess the presence of a dusty toroidal structure around WD 1330657 and its potential role in shaping the nebular structure and absorbing the X-ray emission.
References
- Acker & Neiner (2003) Acker, A., & Neiner, C. 2003, A&A, 403, 659
- Akashi et al. (2008) Akashi, M., Meiron, Y., & Soker, N. 2008, New A, 13, 563
- Anders & Grevesse (1989) Anders, E., & Grevesse, N. 1989, Geochim. Cosmochim. Acta, 53, 197
- Apparao, & Tarafdar (1989) Apparao, K. M. V., & Tarafdar, S. P. 1989, ApJ, 344, 826
- Arnaud (1996) Arnaud, K. A. 1996, Astronomical Data Analysis Software and Systems V, 17
- Chamandy et al. (2018) Chamandy, L., Frank, A., Blackman, E. G., et al. 2018, MNRAS, 480, 1898
- Chu et al. (2001) Chu, Y.-H., Guerrero, M. A., Gruendl, R. A., et al. 2001, ApJ, 553, L69
- Danehkar et al. (2018) Danehkar, A., Karovska, M., Maksym, W. P., et al. 2018, ApJ, 852, 87
- Dyson & Williams (1997) Dyson, J. E., & Williams, D. A. 1997, The physics of the interstellar medium. Edition: 2nd ed. Publisher: Bristol: Institute of Physics Publishing
- Fang et al. (2014) Fang, X., Guerrero, M. A., Marquez-Lugo, R. A., et al. 2014, ApJ, 797, 100
- Frank et al. (2018) Frank, A., Chen, Z., Reichardt, T., et al. 2018, Galaxies, 6, 113
- Freeman et al. (2014) Freeman, M., Montez, R., Kastner, J. H., et al. 2014, ApJ, 794, 99
- Fruscione et al. (2006) Fruscione, A., McDowell, J. C., Allen, G. E., et al. 2006, Proc. SPIE, 62701V
- Gabriel et al. (2004) Gabriel, C., Denby, M., Fyfe, D. J., et al. 2004, Astronomical Data Analysis Software and Systems (ADASS) XIII, 759
- García-Rojas et al. (2013) García-Rojas, J., Peña, M., Morisset, C., et al. 2013, A&A, 558, A122
- García-Rojas et al. (2012) García-Rojas, J., Peña, M., Morisset, C., et al. 2012, A&A, 538, A54
- Gruendl et al. (2006) Gruendl, R. A., Guerrero, M. A., Chu, Y.-H., et al. 2006, ApJ, 653, 339
- Guerrero & De Marco (2013) Guerrero, M. A., & De Marco, O. 2013, A&A, 553, A126
- Guerrero et al. (2012) Guerrero, M. A., Ruiz, N., Hamann, W.-R., et al. 2012, ApJ, 755, 129
- Guerrero et al. (2005) Guerrero, M. A., Chu, Y.-H., Gruendl, R. A., et al. 2005, A&A, 430, L69
- Guerrero et al. (2000) Guerrero, M. A., Chu, Y.-H., & Gruendl, R. A. 2000, ApJS, 129, 295
- Herwig et al. (1999) Herwig, F., Blöcker, T., Langer, N., et al. 1999, A&A, 349, L5
- Kastner et al. (2012) Kastner, J. H., Montez, R., Balick, B., et al. 2012, AJ, 144, 58
- Kastner et al. (2008) Kastner, J. H., Montez, R., Balick, B., et al. 2008, ApJ, 672, 957
- Kastner et al. (2000) Kastner, J. H., Soker, N., Vrtilek, S. D., et al. 2000, ApJ, 545, L57
- Keller et al. (2014) Keller, G. R., Bianchi, L., & Maciel, W. J. 2014, MNRAS, 442, 1379
- Kimeswenger & Barría (2018) Kimeswenger, S., & Barría, D. 2018, A&A, 616, L2
- Kreysing et al. (1992) Kreysing, H. C., Diesch, C., Zweigle, J., et al. 1992, A&A, 264, 623
- Lau et al. (2011) Lau, H. H. B., De Marco, O., & Liu, X.-W. 2011, MNRAS, 410, 1870
- Manick et al. (2015) Manick, R., Miszalski, B., & McBride, V. 2015, MNRAS, 448, 1789
- Miller Bertolami et al. (2006) Miller Bertolami, M. M., Althaus, L. G., Serenelli, A. M., et al. 2006, A&A, 449, 313
- Montez et al. (2015) Montez, R., Kastner, J. H., Balick, B., et al. 2015, ApJ, 800, 8
- Montez & Kastner (2013) Montez, R., & Kastner, J. H. 2013, ApJ, 766, 26
- Montez et al. (2010) Montez, R., De Marco, O., Kastner, J. H., et al. 2010, ApJ, 721, 1820
- Montez et al. (2005) Montez, R., Kastner, J. H., De Marco, O., et al. 2005, ApJ, 635, 381
- Nebot Gómez-Morán & Oskinova (2018) Nebot Gómez-Morán, A., & Oskinova, L. M. 2018, A&A, 620, A89
- Pallavicini et al. (1981) Pallavicini, R., Golub, L., Rosner, R., et al. 1981, ApJ, 248, 279
- Sabin et al. (2012) Sabin, L., Vázquez, R., López, J. A., et al. 2012, Rev. Mexicana Astron. Astrofis., 48, 165
- Soker & Kastner (2003) Soker, N., & Kastner, J. H. 2003, ApJ, 583, 368
- Steffen et al. (2008) Steffen, M., Schönberner, D., & Warmuth, A. 2008, A&A, 489, 173
- Ruiz et al. (2013) Ruiz, N., Chu, Y.-H., Gruendl, R. A., et al. 2013, ApJ, 767, 35
- Toalá et al. (2019) Toalá, J. A., Ramos-Larios, G., Guerrero, M. A., et al. 2019, MNRAS, 485, 3360
- Toalá & Arthur (2018) Toalá, J. A., & Arthur, S. J. 2018, MNRAS, 478, 1218
- Toalá & Arthur (2016) Toalá, J. A., & Arthur, S. J. 2016, MNRAS, 463, 4438
- Toalá et al. (2015) Toalá, J. A., Guerrero, M. A., Todt, H., et al. 2015, ApJ, 799, 67
- Volk, & Kwok (1985) Volk, K., & Kwok, S. 1985, A&A, 153, 79
- Weaver et al. (1977) Weaver, R., McCray, R., Castor, J., et al. 1977, ApJ, 218, 377
- Wesson et al. (2008) Wesson, R., Barlow, M. J., Liu, X.-W., et al. 2008, MNRAS, 383, 1639
- Wesson et al. (2003) Wesson, R., Liu, X.-W., & Barlow, M. J. 2003, MNRAS, 340, 253
- Wilms et al. (2000) Wilms, J., Allen, A., & McCray, R. 2000, ApJ, 542, 914
- Yu et al. (2009) Yu, Y. S., Nordon, R., Kastner, J. H., et al. 2009, ApJ, 690, 440