11email: cdebreuc@eso.org 22institutetext: Max-Planck-Institut für Radioastronomie, Auf dem Hügel 69, D-53121 Bonn, Germany 33institutetext: Aix Marseille University, CNRS, LAM, Laboratoire d’Astrophysique de Marseille, Marseille, France 44institutetext: Department of Astronomy and Physics, Saint Mary’s University, Halifax, NS, B3H 3C3, Canada 55institutetext: Department of Physics and Atmospheric Science, Dalhousie University, Halifax, NS, B3H 4R2, Canada 66institutetext: Departamento de Ciencias Fisicas, Universidad Andres Bello, Fernandez Concha 700, Las Condes, Santiago, Chile 77institutetext: Millennium Institute of Astrophysics (MAS), Nuncio Monseñor Sotero Sanz 100, Providencia, Santiago, Chile 88institutetext: Núcleo de Astronomía, Facultad de Ingeniería, Universidad Diego Portales, Av. Ejército 441, Santiago, Chile 99institutetext: Department of Astronomy, University of Illinois at Urbana-Champaign, 1002 West Green St., Urbana, IL 61801, USA 1010institutetext: National Research Council, Herzberg Astronomy and Astrophysics, Victoria, British Columbia, Canada 1111institutetext: Department of Physics and Astronomy, University of British Columbia, Vancouver, BC, V6T 1Z1, Canada 1212institutetext: Department of Physics and Astronomy, University of California, Los Angeles, CA 90095-1547, USA 1313institutetext: Department of Astronomy, Cornell University, Ithaca, NY 14853, USA
A dense, solar metallicity ISM in the =4.2 dusty star-forming galaxy SPT 0418-47
We present a study of six far-infrared fine structure lines in the =4.225 lensed dusty star-forming galaxy SPT 0418-47 to probe the physical conditions of its inter stellar medium (ISM). In particular, we report Atacama Pathfinder EXperiment (APEX) detections of the [OI] 145m and [OIII] 88m lines and Atacama Compact Array (ACA) detections of the [NII] 122 and 205m lines. The [OI] 145m / [CII] 158m line ratio is 5 higher compared to the average of local galaxies. We interpret this as evidence that the ISM is dominated by photo-dissociation regions with high gas densities. The line ratios, and in particular those of [OIII] 88m and [NII] 122m imply that the ISM in SPT 0418-47 is already chemically enriched close to solar metallicity. While the strong gravitational amplification was required to detect these lines with APEX, larger samples can be observed with the Atacama Large Millimeter/submillimeter Array (ALMA), and should allow observers to determine if the dense, solar metallicity ISM is common among these highly star-forming galaxies.
Key Words.:
Galaxies: high-redshift – Galaxies: ISM – Submillimeter: galaxies – Submillimeter: ISM1 Introduction
The interaction between the interstellar medium (ISM) and stars is key to understanding galaxy formation and evolution. Stars form from dense, cool gas, and have a profound influence on their surrounding ISM by heating and ionizing the surrounding gas, which, in turn, inhibits further star formation. Stellar winds and supernovae enrich the ISM with newly formed metals, influencing the gas cooling rates, and hence the star-formation efficiency. A detailed knowledge of the physical parameters of the ISM, such as the metallicity, ionization state, density, and temperature is therefore essential to study galaxy evolution. The main diagnostics available over a wide range of redshifts are dust and stellar continuum emission as well as spectral emission and absorption lines.
The most frequently used methods to determine the star-formation rate (SFR) include direct far-ultraviolet (far-UV) emission from young stars, far-infrared (far-IR) dust continuum emission from dust heated by young stars, and recombination lines (e.g. H) ionized by the emission field of the young stellar population (see Kennicutt, & Evans, 2012, for a review). To determine the gas metallicity, rest-frame optical emission lines are traditionally the most frequently used tracers (e.g. Maiolino et al., 2008). The density, ionization parameter, and temperature of the gas can be derived from line ratios of fine structure lines (FSL) (e.g. Villar-Martin et al., 1997; De Breuck et al., 2000). One common disadvantage of these mostly optical tracers is that they can be severely affected by dust obscuration. Such problems can be avoided, or at least minimized by observing rest-frame far-IR FSL. While some galaxies such as Arp 220 are optically thick out to =240 m (Rangwala et al., 2011), the extinction corrections to far-IR FSL are at most 50% for the shortest wavelength lines (Uzgil et al., 2016). Moreover, these far-IR FSL are often brighter than their optical counterparts (e.g. Palay et al., 2012; Moriwaki et al., 2018); the brightest FSL of carbon, oxygen, and nitrogen are the major coolants of major phases in the ISM, and can each carry up to 1% of the total far-IR luminosity.
The far-IR FSL originate both from photo-dissociation regions (PDR) and from HII regions, depending if their ionization potentials are lower or higher than that of hydrogen (13.6 eV), respectively. All atomic FSL ([OI] 63,145 m and [CI] 370,609 m) mainly originate from the neutral PDR. But also the ionic [CII] 158 m line has an ionization potential of 11.26 eV, and therefore originates from both the PDR and HII regions. Any diagnostic line ratios including such multiple-origin lines should therefore invoke a self-consistent model that treats both PDR and HII regions in pressure equilibrium (e.g. Abel et al., 2005; Nagao et al., 2012; Cormier et al., 2019). The relative contributions to composite lines such as [CII] can also be determined observationally by comparing the line flux with that from another FSL with a similar critical density that originates fully in the HII region. One such line is [NII] 205 m, which has =48 cm-3, compared to =50 cm-3 for [CII]111This assumes the [CII] 158 m is optically thin; in the SPT sample, the line appears to have moderate optical depth (Gullberg et al., 2015). For optically thick [CII] 158 m, the critical densities are lower by an order of magnitude, see Fig. 3 of Lagache et al. (2018). at the same temperature (assuming electrons are the main collision partners, see Fernández-Ontiveros et al., 2016). This technique has been used on individual galaxies at high redshift (e.g. Decarli et al., 2014), as well as on samples of nearby galaxies (Kamenetzky et al., 2014; Díaz-Santos et al., 2017; Croxall et al., 2017), yielding [CII] PDR fractions of 75%. The latter authors did find a clear dependence on metallicity in this PDR/HII fraction. If the fraction can be found by other means, this dependence can also be turned around to determine the gas metallicity independently of classical optical diagnostics (e.g. Nagao et al., 2011, 2012; De Breuck et al., 2014; Béthermin et al., 2016; Pereira-Santaella et al., 2017). An easier solution is to consider only HII-dominated FSL to determine the physical parameters. For example the [NII] 122 m/[NII] 205 m and [OIII] 52 m/[OIII] 88 m ratios are powerful density tracers in the range 1–103 and 10–104.5 cm-3, respectively (Fernández-Ontiveros et al., 2016). The most promising metallicity tracers are the [OIII] 88 m/[NII] 122 m or [OIII] 88 m/[NII] 205 m ratios (Pereira-Santaella et al., 2017). Using Herschel Spectral and Photometric Imaging Receiver (SPIRE) spectroscopy of three gravitationally lensed dusty star-forming galaxies (DSFG), Rigopoulou et al. (2018) use the [OIII] 88 m/[NII] 122 m ratio to argue that these DSFGs must already have close to solar metallicities. Tadaki et al. (2019) confirm a similar result on an unlensed DSFG observed with the Atacama Large Millimeter/submillimeter Array (ALMA).
The applicability of mid-IR and far-IR FSL as diagnostic tools of the ISM has received a boost thanks to the publication of samples of nearby galaxies observed with the infrared space observatory (ISO) and Herschel (e.g. Brauher et al., 2008; Farrah et al., 2013; Sargsyan et al., 2014; Kamenetzky et al., 2014; Cormier et al., 2015; Cigan et al., 2016; Herrera-Camus et al., 2016; Fernández-Ontiveros et al., 2016; Zhao et al., 2016; Díaz-Santos et al., 2017; Zhang et al., 2018). At high redshift (1), the far-IR FSL conveniently shift into the (sub)millimetre atmospheric windows. The most popular line is clearly [CII] 158 m, followed by the [CI] 370,609 m lines (e.g. Walter et al., 2011; Bothwell et al., 2017). Both single dish submillimetre telescopes and interferometers have also detected the [NII] 122 m and 205 m lines at high redshift (Ferkinhoff et al., 2011, 2015; Combes et al., 2012; Nagao et al., 2012; Decarli et al., 2012, 2014; Béthermin et al., 2016; Pavesi et al., 2016; Lu et al., 2017; Tadaki et al., 2019; Novak et al., 2019). After a slow start, the [OIII] 88 m line is quickly becoming a popular line to confirm redshifts of galaxies in the epoch of reionization (), where it shifts into the submillimetre atmospheric windows below 500 GHz (Ferkinhoff et al., 2010; Inoue et al., 2016; Carniani et al., 2017; Marrone et al., 2018; Vishwas, et al., 2018; Hashimoto, et al., 2018; Walter et al., 2018; Tamura et al., 2019; Tadaki et al., 2019; Hashimoto et al., 2019; Novak et al., 2019). Deep Herschel/SPIRE spectroscopy has also revealed a number of FSL detections, either in individual objects (Valtchanov et al., 2011; Coppin et al., 2012; George et al., 2013; Uzgil et al., 2016; Rigopoulou et al., 2018; Zhang et al., 2018), or in stacked spectra (Wardlow et al., 2017; Wilson et al., 2017; Zhang et al., 2018). These include the only detections of the [OI] 63 m line at high redshift reported thus far. This [OI] line is arguably the best tracer for the star-forming gas, as it traces the very dense (=5105 cm-3) neutral gas (one caveat being the frequeny presence of self-absorption observed in local ultra-luminous IR galaxies, Rosenberg et al. (2015)). Like the [CII] line, the [OI] 63 m line also shows a ’deficit’ in the most luminous FIR sources, though with a higher scatter (Graciá-Carpio et al., 2011; Cormier et al., 2015; Díaz-Santos et al., 2017). Surprisingly, this bright FSL has not been frequently observed with ALMA, probably because it is only observable in the highest frequency bands. At least as surprising is that the fainter, but more accessible [OI] transition at =145 m (=9.5104 cm-3) has thus far not been detected at high redshifts (only Novak et al. (2019) report a tentative detection in a =7.5 quasar). Also in nearby galaxies, this [OI] 145m line has not been observed very frequently as in most cases, it is fainter than the nearby [CII] 158m line. After initial detections with ISO (Malhotra et al., 2001; Brauher et al., 2008), Herschel has now detected [OI] 145m in significant samples of nearby galaxies (Spinoglio et al., 2015; Cormier et al., 2015; Fernández-Ontiveros et al., 2016; Herrera-Camus et al., 2018), and recently in a =6.5 lensed quasar (Yang et al., 2019).
In this paper, we report the second such [OI] 145 m detection in SPT-S J041839-4751.8 (hereinafter SPT 0418-47) at =4.2248 (Weiß et al., 2013). With a lensing magnification =32.72.7 (Spilker et al., 2016), SPT 0418-47 is one of the most strongly lensed DSFGs from our sample selected from the South Pole Telescope, making its FSL accessible to the Atacama Pathfinder EXperiment (APEX). We also report the detection of the [OIII] 88 m line, and use the five detected FSL in SPT 0418-47 to constrain the metallicity in this DSFG. Throughout this paper, we assume a CDM cosmology with =67.8 s-1Mpc-1, =0.308, and =0.692 (Planck Collaboration et al., 2016). At =4.2248, this corresponds to a luminosity distance =39.150 Gpc and a scale of 7 kpc/″.
 |
 |
 |
 |
 |
| Line | [OIII] 88 m | [NII] 122 m | [OI] 145 m | [CII] 158 m | [NII] 205 m | [CI] 609 m |
|---|---|---|---|---|---|---|
| Redshift | 4.22460.0004 | 4.22420.0003 | 4.2250.001 | 4.22480.0002 | 4.22480.0005 | 4.2250.004 |
| [km/s] | 40040 | 13050 | 530110 | 34231 | 40040 | 31050 |
| [Jy km/s] | 10811 | 7.12.0 | 337 | 12710 | 7.90.6 | 2.50.6 |
| [1010 L⊙] | 11.11.2 | 0.530.15 | 2.10.5 | 7.40.6 | 0.350.03 | 0.0370.009 |
| Referencea | [1] | [2] | [1] | [3] | [4] | [5] |
| 0.790.13 | 7.51.2 | 35.96.4 | 10810 | 1757 | 1666 | 1146 | 458 | 6.9 |
2 Observations
2.1 New data from APEX
We observed the [OI] 145 m (=2060.07 GHz) using the First-Light APEX Submillimeter Heterodyne instrument (FLASH; Klein et al., 2014) on the APEX telescope (Güsten et al., 2006). The observations were taken under the Max Planck project 093.F-9512, from 2014 May 14 to 20. The total on-source integration time was 7.3 hours, with precipitable water vapour (PWV) in the range 0.4–0.8 mm. The receiver was tuned to 394.286 GHz in the lower sideband, and used the wobbler with an amplitude of 30″ and frequency of 1.5 Hz. We reduced the data using the standard procedures in the Continuum and Line Analysis Single-dish Software (CLASS; Pety, 2005), and used an antenna gain of Jy/K=43. We estimate the overall calibration uncertainty at 15%.
To observe the [OIII] 88 m line (=3393.01 GHz), we used the Swedish-ESO PI Instrument for APEX (SEPIA; Belitsky et al., 2018). The observations were taken under the ESO project E-098.A-0513, on 2016 August 10 and 2017 April 26 with the first double sideband (DSB) incarnation of the receiver and the 4 GHz wide XFFTS backend, and under the Max Planck account M-0101.F-9522 on 2019 June 8 with the final sideband-separed (2SB) version of the receiver and the 8 GHz wide dFFTS4G backend. The total on-source integration time was 6.25 hours, with precipitable water vapour (PWV) in the range 0.25–0.5 mm. The receiver was tuned to 649.403 GHz in the lower sideband, and used the wobbler with an amplitude of 40″ and frequency of 0.5 Hz in 2016/2017 and 30″with 1.5 Hz in 2019. We reduced the data using the standard procedures in CLASS, using a first order fit for baseline removal. We used antenna gains of Jy/K=120 for the DSB receiver and Jy/K=70 for the 2SB receiver, based on carefully pointed and focused observations of Uranus close in time to the science target. We re-observed the 8.3 DSB line with the 2SB receiver because after the DSB observations, a construction problem with the SEPIA band 9 selection mirror (NMF3 in Fig. 1 and 3 of Belitsky et al., 2018) was identified (and soon thereafter corrected). As a result, there were time-variable optical losses, which are difficult to characterize for long integrations like ours. This effect cannot be separated from other changes between 2016 and 2019, including a move of SEPIA to the central position in the Nasmyth A cabin using a new set of mirrors, the change of receiver from DSB to 2SB, the change of the telescope subreflector, and the replacement of the main telescope mirror surface panels to improve the overall telescope efficiency. However, thanks to the frequent planet calibration observations, we were able to combine these changes into the 70% improvement in the antenna gain, leading to consistent [OIII] 88 m line detections of 10813 and 8216 Jy km s-1 for the DSB and 2SB receivers, respectively. For our analysis, we use the weigthed average flux of 10511 Jy km s-1.
2.2 Additional data
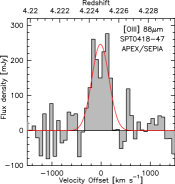
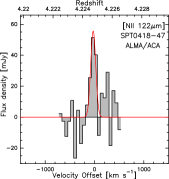
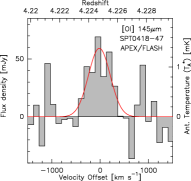
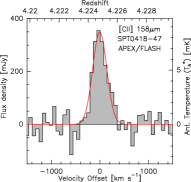
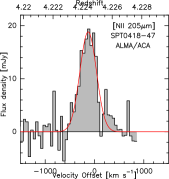
In addition to the two FSL reported above, we also include three other lines in our analysis. Gullberg et al. (2015) report a bright [CII] 158 m line detected with APEX/FLASH, reproduced next to the [OIII] and [OI] lines in Fig. 1. Bothwell et al. (2017) report the detection of the [CI] 609m line from ALMA Cycle 3 spectroscopy. The [NII] 205m line was detected as part of an Atacama Compact Array (ACA) survey of 41 SPT sources (Cunningham et al., 2019). The [NII] 122m line was detected in a similar continuation of this ACA project (Cunningham et al., in prep.). Table 1 lists the main parameters from these observations.
The dust continuum SED has been sampled by seven photometric points (Table 2), yielding a dust temperature =452 K (Strandet et al., 2016) and intrinsic FIR (8–1000m) luminosity =(2.80.3)L⊙ (Bothwell et al., 2017). The lensing amplification factor =32.72.7 was derived by Spilker et al. (2016) based on 05 resolution ALMA imaging. The lens model also shows that the lensed galaxy is very compact with an effective radius of 00920.008 (0.6 kpc).
3 Results
Fig. 1 shows our detections of both the [OIII] 88 m and [OI] 145 m lines at the 5 level. We fitted an unconstrained single Gaussian to the observed profiles and list the redshift, velocity width and integrated line luminosity in Table 1. For consistency, we have used the same fitting procedure for all lines shown in Fig. 1. We note that the [NII] 122 m line width is less than half that of the other lines, but this may be due to the low signal to noise ratio (S/N) of our detection. Integrating over 300 to +350km s-1, that is the full velocity width of the bright [CII] 158 m line yields an integrated [NII] 122 m line flux of 7.12.5 Jy km s-1. This is fully consistent with our unconstrained Gaussian fit. Deeper data are required to obtain a more reliable line flux, but the uncertainties are not to a level that they would change the conclusions in this paper.
The line luminosities are calculated following Solomon et al. (1997):
where is the velocity-integrated line flux in Jy km/s and is the rest frequency in GHz. The redshifts and velocity widths are consistent with each other within the uncertainties for all FSL, with the exception of the low S/N [NII] 122m line. The spectral profiles of the five well-detected FSL are also consistent with the CO(2-1) and CO(4-3) lines, suggesting that differential lensing is not important in this source (Gullberg et al., 2015; Aravena et al., 2016). Moreover there is no evidence for any companion galaxies in the lens model of SPT 0418-47 (Spilker et al., 2016), so we can safely assume that the integrated line fluxes are tracing a single galaxy.
We first compare our new FSL detections with other high- galaxies. The only FSL that have been studied in significant samples of high- galaxies are [CII] and [CI] (Stacey et al., 2010; Walter et al., 2011; Alaghband-Zadeh et al., 2013; Gullberg et al., 2015; Bothwell et al., 2017; Lagache et al., 2018). In both of these lines, the luminosity of SPT 0418-47 falls near the average of the SPT DSFGs. A first survey of the [NII] 205m lines has been observed in 41 galaxies from our SPT sample (Cunningham et al., 2019); SPT 0418-47 has been observed as part of this survey.
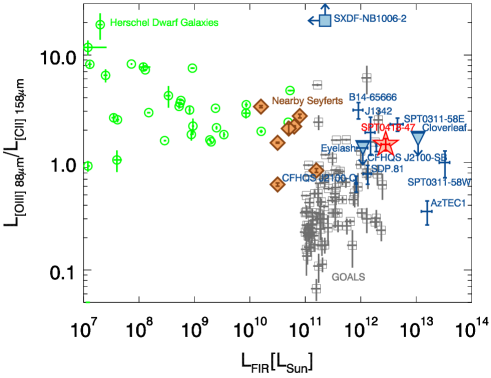
Detections of the [OIII] 88 m line have now been reported in a dozen other high- objects. Fig. 2 compares the ratio of those [OIII] 88 m lines with [CII] 158 m as a function of . Compared to eleven other high- DSFGs, SPT 0418-47 has one of the brightest relative [OIII] 88 m emission, emitting about twice as much power as the [CII] 158 m line. Only the =7.2 Lyman- emitter SXDF-NB1006-2 has a ratio that is at least an order of magnitude higher, which has been argued as evidence for a very low metallicity (Inoue et al., 2016). Interestingly, SPT 0418-47 falls close to the starburst galaxy rather than the quasar in the double system CFHQS J2100 (Walter et al., 2018). The only low- sample that reaches such similarly high is the Great Observatories All-sky LIRG Survey (GOALS; Sanders et al., 2003; Díaz-Santos et al., 2017). Compared to this sample, SPT 0418-47 has a high [OIII] 88 m/ [CII] 158 m ratio, but there appears to be an increasing trend (and scatter) towards the highest . SPT 0418-47 appears to be more consistent with both the nearby dwarf galaxies (Cormier et al., 2015) and Seyferts (Spinoglio et al., 2015). Increasing the number statistics is clearly required to perform a better comparison, but our bright [OIII] 88 m detection suggests that detecting this line may be easier than suggested by the previously reported upper limits.
Thus far, only one other [OI] 145m detections has been reported at 1 (Yang et al., 2019). Although there are a few detections of the 63 m line especially in stacked Herschel spectra (Uzgil et al., 2016; Wardlow et al., 2017; Wilson et al., 2017; Zhang et al., 2018), this is not the case in the fainter 145 m line. To check if our detection is expected, we scale from the [OIII] 88 m and [CII] 158 m detections in the stacked spectrum of DSFGs (Zhang et al., 2018), which predicts a 63 m luminosity of 1.6–5.5 1010L⊙. To convert this to an [OI] 145m luminosity, we use the observed 145 m to 63 m [OI] line luminosity ratio between 2% and 35% (Brauher et al., 2008; Vasta et al., 2010), which yields a predicted range of 0.02–1.91010L⊙. Our detection at the 2.11010L⊙ level (Table 1) is at the upper bound of this range. However, we warn that the ratio of the two [OI] lines is subject to extinction and self-absorption effects (e.g. Vasta et al., 2010), and is therefore quite uncertain. We therefore also directly compare our observed [OI] 145m detection with low- samples. Fig. 3 plots the [CII] 158m and [OIII] 88 m both normalized by the [OI] 145 m luminosity. While the [OIII] 88 m/[OI] 145 m ratio is consistent with most normal galaxies (except dwarfs), the [CII] 158m in SPT 0418-47 appears to be underluminous relative to the [OI] 145 m. In the next section, we combine all FSL results to determine the physical conditions of the ISM in SPT 0418-47.

4 Discussion
4.1 The nature of SPT0418-47
Before discussing the physical parameters of its ISM, we first compare SPT0418-47 with the main sequence galaxy population at 4. Unfortunately, a direct stellar mass determination is rather complex because the foreground lensing galaxy outshines the background DSFG (Vieira et al., 2013). Using the CIGALE SED modelling described in §4.4 and the deblending technique of Ma et al. (2015), we derive an intrinsic =(9.53.0)M⊙ (Phadke et al., in prep.). This value can be compared with the stellar masses 2–81010M⊙ in four other SPT DSFGs derived using HST and Spitzer imaging (Ma et al., 2015). Using the gas masses derived from low-J CO lines (Aravena et al., 2016) in these four DSFGs, this implies stellar to gas mass ratios in the range 0.3 to 1.0. The relatively low gas mass in SPT 0418-47 of 0.51010M⊙ then suggests the stellar mass in the range 0.5–1.71010M⊙, fully consistent with the SED-derived above. Detailed JWST imaging of SPT0418-47 scheduled as part of the Early Release Science observations will provide a much more reliable stellar mass determination.
This rather low stellar mass contrasts with the high SFR=28030 M⊙yr-1 derived as 10-10. This places SPT0418-47 well above the galaxy main sequence at 4, which predicts a SFR25 M⊙yr-1 for a 1010 M⊙ galaxy (Schreiber et al., 2017).
4.2 Contributions of PDR and HII regions
As mentioned in the introduction, the FSL we observed originate from both the PDR and HII regions. It is important to keep in mind that we are only looking at galaxy-integrated line luminosities rather than ratios within a single Giant Molecular Cloud (GMC). What we are comparing are thus the luminosity-weighted combinations of all GMCs within these galaxies.
The line that has the most uncertain relative contribution of PDR and HII regions is [CII] 158 m. To estimate the expected contribution of HII regions to the [CII] 158 m line flux, we can use the [NII] 205 m line, which has the same critical density and similar ionization range. Following Díaz-Santos et al. (2017), we assume 3.00.5, which covers the usual full range of HII region physical conditions. Comparing this to the observed ratio of 24.52.0 (Table 1), we derive an HII fraction of 122%. While there is some remaining model uncertainty on this number, it seems clear that the [CII] line is dominated by PDRs. Given that this contribution is rather small, we do not correct for it in the following; moreover such a correction cannot be calculated for all comparison samples due to the absence of systematic [NII] 205 m observations.
Another line ratio that can be used to determine the ratio of the filling factors of warm ionized and dense neutral gas is [OIII] 88 m / [OI] 63 m (Cormier et al., 2015, 2019; Díaz-Santos et al., 2017). This ratio provides a measure that is completely independent of abundance, and only very weakly on optical depth. The ratio could depend on temperature, though it would in this case measure the variation in the ratio of temperatures in the PDR and HII phases between galaxies. Díaz-Santos et al. (2017) (their Fig. 7) do not find such a trend in the local luminious infrared galaxies from GOALS. The only galaxies that show clearly higher [OIII] 88 m / [OI] 63 m ratios are dwarf galaxies, which has been interpreted as indicating the presence of low density channels allowing the hard UV photons to reach the outer parts of galaxies (Cormier et al., 2015, 2019). As a result, these low metallicity galaxies are likely to be filled with relatively low density (below m)500 cm-3) gas rather than PDRs. One uncertainty in this ratio remains the optical depth and self-absorption of the [OI] 63 m line. We here use instead the [OI] 145 m line, which is not subject to these uncertainties. Fig. 3 confirms that the dwarf galaxies (green points) are clearly offset from the other samples, with the normal galaxies and Seyferts of Brauher et al. (2008) (orange points) lying in between. SPT 0418-47 instead lies at the lower end of the [OIII] 88 m / [OI] 145 m distribution, which implies that the galaxy-integrated line emission is dominated by PDR. This confirms our conclusion above from the [CII] 158 m / [NII] 205 m ratio.
4.3 Gas density
To determine the gas density, one should ideally use the ratio of two FSL of the same ion or neutral atom such as [OIII] 88 m/52 m, [NII] 122 m/205 m, or [OI] 145 m/63 m (e.g. Spinoglio et al., 2015; Herrera-Camus et al., 2016). Of these, we only have both [NII] lines, which allow to probe the density range 1 cm-3 cm-3. Our observed [NII] 122 m/205 m luminosity ratio of 1.400.43 corresponds to an electron density cm-3 following the relation shown in for example Fig. 2 of Herrera-Camus et al. (2016). This places SPT 0418-47 slightly above the average density found in nearby spirals and ultra-luminous galaxies from the “Key Insights on Nearby Galaxies: A Far-Infrared Survey with Herschel” (KINGFISH), “Beyond the Peak” (BtP), and GOALS samples (Herrera-Camus et al., 2016; Díaz-Santos et al., 2017). We are currently performing a survey of this [NII] 122 m/205 m ratio in the SPT sample, which will be the first systematic survey in high-redshift galaxies, and refer to a forthcoming publication for a more in depth discussion (Cunningham et al., in prep.).
It is important to keep in mind that the [NII] lines only trace the diffuse HII regions, but not the denser PDR. Bothwell et al. (2017) modelled the observed ratio of four PDR-dominated lines (CO(2-1), CO(4-3), [CI] 609 m, and [CII] 158 m) with the 3D-PDR code (Bisbas et al., 2012), which also includes the effect of cosmic rays. They derive a consistent model with a PDR density of 2.5105 cm-3, and a far-UV field strength 3.2105. This places SPT0418-47 at the high end of the observed PDR gas densities, while the is the highest one in sample of 13 SPT DSFGs modelled by Bothwell et al. (2017), that is firmly in the region occupied by ULIRGs. As mentioned by Bothwell et al. (2017), the densities from the 3D-PDR model are almost an order of magnitude higher than the ones derived using the PDR toolbox222http://dustem.astro.umd.edu/pdrt/ (Kaufman et al., 2006; Pound & Wolfire, 2008). The [OI] 145 m line adds a powerful new diagnostic to the PDR modelling, as the [OI] 145 m to [CII] 158 m ratio is particularly sensitive to density, especially in the high range. This ratio has the advantage of being mostly immune to extinction effects, but one has to keep in mind that it is also subject to abundance variations and HII contributions to [CII] 158 m. From the PDR toolbox modelling of all five PDR-dominated lines, we derive a and 2104 cm-3. We defer a more detailed PDR modelling using 3D-PDR to a future publication.
4.4 AGN contributions
Optical line ratios are often used as an AGN diagnostic (the classical “BPT diagram”; Baldwin et al., 1981). In lensed DSFGs, this technique can unfortunately not be used as the optical spectra are dominated by the foreground lensing galaxy, while the background DSFG is almost completely dust obscured. At far-IR wavelengths, the situation is reversed: our sub-arcsecond 850m ALMA imaging (Vieira et al., 2013) shows that the lens is undetected while the background DSFG is strongly detected. We can thus use the hot dust continuum shape and/or the mid- and far-IR FSL to look for AGN contributions.
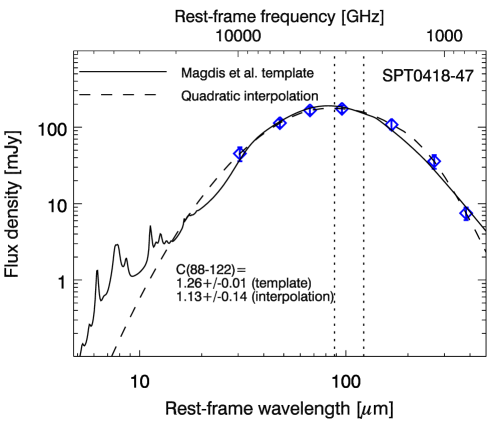
Turning first to the dust continuum SED (Fig. 4), we find that it is consistent with the starburst template of Magdis et al. (2012), suggesting that an AGN is not required. To obtain a quantitative measure of the AGN fraction, we use the method described by Spilker et al. (2018), using the CIGALE SED modelling code (Noll et al., 2009; Boquien et al., 2019) including the dust models of Fritz et al. (2006). We derive an AGN fraction 5%. This is consitent with results in other DSFGs from the same SPT sample, where no significant AGN fractions were found (Ma et al., 2016; Spilker et al., 2018; Apostolovski et al., 2019).
The alternative method we examine is to use the FSL. Several authors have used mid-IR and far-IR FSL to determine AGN contributions (e.g. Fernández-Ontiveros et al., 2016; Herrera-Camus et al., 2018). These tracers are mostly based on the ratio of very high and lower ionization lines of the same species. Unfortunately, most of these species are in the mid-IR (e.g. [OIV] 25.9 m, [NeIII] 15.6 m, [NeII] 12.8 m, [SIV] 10.5 m, [SIII] 18.7 m), and are inaccessible from the ground, even at high redshift. However, one ratio that does appear to separate AGN regions is the [OI] 63 m / [CII] 158 m line (Fig. 12 of Herrera-Camus et al., 2018). While we did not observe the [OI] 63 m line in SPT 0418-47, in Fig. 3, we compare the [CII] 158 m / [OI] 145 m ratio in a variety of galaxies. The advantage of the 145 m line is that it is not affected by extinction and self-absorption. Cormier et al. (2019) also showed that adding X-ray dominated regions to their cloudy models leads to a slight increase by a factor 1.2 in the [OI] 145 m/63 m luminosity ratio (their Fig. 8). A similar effect is seen when increasing the cosmic ray flux. As AGN would produce both stronger X-rays and cosmic ray fluxes, the 145 m line is therefore at least as good an AGN tracer, if not a better one. In addition, AGN are expected to exite the higher [OI] level, that is increase the [OI] 145 m/63 m ratio.
Figure 3 shows that the local AGN (blue symbols) and Seyferts (brown and a number of black symbols) cover the full range of [CII] 158 m / [OI] 145 m, but they are also the only ones with [CII] 158 m / [OI] 145 m 5. Interestingly, SPT 0418-47 falls among these lowest ratios, suggesting the possible presence of an AGN. However, we warn that this low [CII] 158 m / [OI] 145 m ratio may also be a direct consequence of the relatively high =452 K. Such higher dust and gas temperatures may be due to a higher Far-UV flux , which will also increase [OI] faster than [CII] (assuming the 145m line behaves like the 63m line, Malhotra et al., 2001). Surprisingly, the AGN galaxies do not show higher [OIII] 88 m / [OI] 145 m ratios. This may be because we are comparing only galaxy-integrated line luminosities, and AGN emission is known to be very anisotropic due to an obscuring torus; the ionized gas is thus only observed in ionization cones and not throughout the galaxy. As such, the fact that SPT 0418-47 has a ratio within the region occupied by both AGN and normal galaxies does not provide any information on the presence of an AGN. We conclude that while the SED seems to suggest a negligible AGN contribution in SPT 0418-47, the FSL ratio method is more inconclusive.
4.5 Metallicity
As argued by Nagao et al. (2011) and Pereira-Santaella et al. (2017), the ratio of [OIII] 52 m + [OIII] 88 m and [NIII] 57 m is the most promising tracer of the gas metallicity using FSL. While these lines have now been observed with Herschel in a significant number of nearby objects, they are beyond the reach of ALMA for all but the very highest redshift objects known to date. More accessible alternatives are the ratios of [OIII] 88 m with the [NII] 122 m and/or [NII] 205 m lines (Pereira-Santaella et al., 2017; Tadaki et al., 2019). The main disadvantage of using the [NII] lines is that they have a much lower ionization potential of 14.53 eV compared to 35.12 eV for [OIII] 88 m, creating a degeneracy between the ionization parameter and metallicity . An additional, though slightly less critical degeneracy exists with the gas electron density . To solve this degeneracy between and , Rigopoulou et al. (2018) use the ratio of the restframe 88/122 m continuum flux measurements. This assumes that the gas and dust are well mixed; the dust temperature will then increase with the ionizing flux, creating a correlation between the continuum flux ratio and (see also Díaz-Santos et al., 2017). For PDR-dominated lines, a similar correlation between the Far-UV flux and the 60/100 m continuum flux ratio has indeed been observed in ISO data (e.g. Malhotra et al., 2001; Brauher et al., 2008), suggesting the gas and dust temperatures are indeed correlated.
To allow a direct comparison with the method of Rigopoulou et al. (2018), we first derive the rest frame 88 and 122 m continuum flux ratio C(88-122) by fitting the continuum photometry of SPT 0418-47 (Table 2) with the template of Magdis et al. (2012) and a simple quadratic interpolation. Fig. 4 shows that the results do not depend strongly on the adopted function, with C(88-122)=1.260.01 for the template and C(88-122)=1.130.14 for the quadratic interpolation. We conservatively adopt the latter, which yields 3.2-2.0 using Fig. 4 of Rigopoulou et al. (2018).
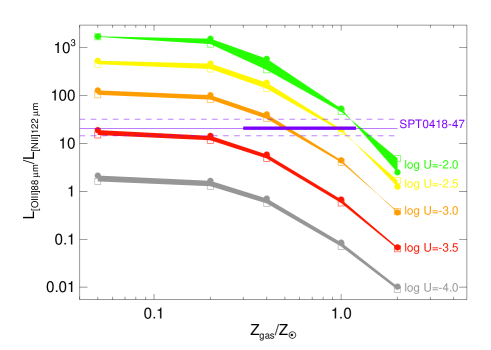
In Fig. 5, we reproduce the CLOUDY models of Pereira-Santaella et al. (2017), where the coloured bands indicate different ionization parameters, and their spread different gas electron densities. The constraint limits the range of models to the orange, yellow and green shaded areas in Fig. 5. We note that there is very little dependence on the density, as the [OIII] 88 m and [NII] 122 m lines have very similar =510 and 310 cm-3, respectively. The observed [OIII] 88 m to [NII] 122 m ratio thus suggests 0.31.3. This is consistent with the [CII] 158 m / [NII] 205 m ratio, which has also been used as a rough metallicity indicator (Nagao et al., 2012). The ratio in SPT 0418-47 is lower than the one in ALESS 73.1 (De Breuck et al., 2014), which also suggests a near solar metallicity.
Our new metallicity determination allows us to compare SPT 0418-47 to the mass-metallicity relationship studied at lower redshifts, and verify if this relation evolves over cosmic time. Although there is a rather large uncertainty, we derived a rather low stellar mass of 1010M⊙ (see §4.1). The almost solar metallicity in SPT 0418-47 (corresponding to 8.1812+log(O/H)8.81) places it a bit higher on the mass-metallicity relation compared to other DSFGs at slightly lower redshifts (Fig. 7 of Rigopoulou et al., 2018), near the track for =2.2 from Maiolino et al. (2008) and Mannucci et al. (2010).
5 Conclusions
We have detected five FSL in SPT 0418-47, including the second detection of [OI] 145 m at 1. Most of the analytic power of the FSL comes from line ratios. We draw the following conclusions from our study: Firstly, the ratio of [OIII] 88 m to [OI] 145 m suggests that the emission from the ISM in SPT 0418-47 is dominated by PDR rather than HII regions. The [CII] 158 m line is almost 90% dominated by PDR. Secondly, the ratios of [CII] 158 m to [OI] 145 m and of [NII] 205 m to [NII] 122 m suggest that both the PDR and HII regions have high gas densities. Thirdly, using a new diagram of [CII] 158 m to [OI] 145 m against [OIII] 88 m to [OI] 145 m, we find that SPT 0418-47 lies in a region occupied by nearby AGN in low redshift samples. While this suggests that SPT 0418-47 may also harbour an AGN, we warn that the observed line ratios may also be a direct consequence of the relatively warm =45.32.3 K created by an extremely powerful starburst. Fourthly, following the method of Rigopoulou et al. (2018), we derive an ionization parameter 3.2-2.0 from the dust continuum flux ratios. Combined with the observed [OIII] 88 m to [NII] 122 m line ratio, we derive a gas metallicity of 0.31.3 in SPT 0418-47.
Taken together, these results imply that SPT 0418-47 has a dense, roughly solar metallicty ISM that is dominated by PDR. The presence of an AGN cannot be excluded, but it is equally possible that the extreme strength of the starburst is heating both the dust and gas in the entire galaxy to higher than average values.
The high gravitational amplification (=32.72.7) of SPT 0418-47 has allowed us to detect even the weaker [OI] 145 m line with APEX. This line has been often neglected at high redshift, probably because it was also difficult to study in nearby samples before the advent of Herschel. It is a powerful alternative to its brighter counterpart at 63 m, being at a significantly easier frequency to observe from the ground at 1.17, rather than 4 for the 63 m line. Moreover, the 145 m line is not subject to extinction and self-absorption affects, which may reduce the observed flux of the 63 m line. We expect the [OI] 145 m line to become a powerful new tracer of PDR in high- galaxies.
Acknowledgements.
We thank the anonymous referee for useful suggestions, Myha Vuong for stimulating discussions on fine structure lines, and the APEX staff for their excellent support in obtaining the data. This publication is based on data acquired with the Atacama Pathfinder Experiment (APEX) under programme IDs 098.A-0513 (ESO), 0101.F-9522, and 093.F-9512 (both Max Planck). APEX is a collaboration between the Max-Planck-Institut fur Radioastronomie, the European Southern Observatory, and the Onsala Space Observatory. This paper makes use of the following ALMA data: ADS/JAO.ALMA#2016.1.00133.T and ADS/JAO.ALMA#2018.1.01670.S. ALMA is a partnership of ESO (representing its member states), NSF (USA) and NINS (Japan), together with NRC (Canada), MOST and ASIAA (Taiwan), and KASI (Republic of Korea), in cooperation with the Republic of Chile. The Joint ALMA Observatory is operated by ESO, AUI/NRAO and NAOJ. The SPT is supported by the NSF through grant PLR-1248097, with partial support through PHY-1125897, the Kavli Foundation and the Gordon and Betty Moore Foundation grant GBMF 947. The National Radio Astronomy Observatory is a facility of the National Science Foundation operated under cooperative agreement by Associated Universities, Inc.References
- Abel et al. (2005) Abel, N. P., Ferland, G. J., Shaw, G., & van Hoof, P. A. M. 2005, ApJS, 161, 65
- Alaghband-Zadeh et al. (2013) Alaghband-Zadeh, S., Chapman, S. C., Swinbank, A. M., et al. 2013, MNRAS, 435, 1493.
- Apostolovski et al. (2019) Apostolovski, Y., Aravena, M., Anguita, T., et al. 2019, A&A, 628, A23
- Aravena et al. (2016) Aravena, M., Spilker, J. S., Bethermin, M., et al. 2016, MNRAS, 457, 4406
- Baldwin et al. (1981) Baldwin, J. A., Phillips, M. M., & Terlevich, R. 1981, Publications of the Astronomical Society of the Pacific, 93, 5.
- Belitsky et al. (2018) Belitsky, V., Lapkin, I., Fredrixon, M., et al. 2018, A&A, 612, A23
- Béthermin et al. (2016) Béthermin, M., De Breuck, C., Gullberg, B., et al. 2016, A&A, 586, L7
- Bisbas et al. (2012) Bisbas, T. G., Bell, T. A., Viti, S., et al. 2012, MNRAS, 427, 2100
- Boquien et al. (2019) Boquien, M., Burgarella, D., Roehlly, Y., et al. 2019, A&A, 622, A103
- Bothwell et al. (2017) Bothwell, M. S., Aguirre, J. E., Aravena, M., et al. 2017, MNRAS, 466, 2825
- Brauher et al. (2008) Brauher, J. R., Dale, D. A., & Helou, G. 2008, ApJS, 178, 280-301
- Carniani et al. (2017) Carniani, S., Maiolino, R., Pallottini, A., et al. 2017, A&A, 605, A42
- Cigan et al. (2016) Cigan, P., Young, L., Cormier, D., et al. 2016, AJ, 151, 14
- Combes et al. (2012) Combes, F., Rex, M., Rawle, T. D., et al. 2012, A&A, 538, L4
- Coppin et al. (2012) Coppin, K. E. K., Danielson, A. L. R., Geach, J. E., et al. 2012, MNRAS, 427, 520
- Cormier et al. (2015) Cormier, D., Madden, S. C., Lebouteiller, V., et al. 2015, A&A, 578, A53
- Cormier et al. (2019) Cormier, D., Abel, N. P., Hony, S., et al. 2019, A&A, 626, A23
- Croxall et al. (2017) Croxall, K. V., Smith, J. D., Pellegrini, E., et al. 2017, ApJ, 845, 96
- Cunningham et al. (2019) Cunningham, D. J. M., Chapman, S. C., Aravena, M., et al. 2019, arXiv e-prints, arXiv:1906.02293
- De Breuck et al. (2000) De Breuck, C., Röttgering, H., Miley, G., van Breugel, W., & Best, P. 2000, A&A, 362, 519
- De Breuck et al. (2014) De Breuck, C., Williams, R. J., Swinbank, M., et al. 2014, A&A, 565, A59
- Decarli et al. (2012) Decarli, R., Walter, F., Neri, R., et al. 2012, ApJ, 752, 2
- Decarli et al. (2014) Decarli, R., Walter, F., Carilli, C., et al. 2014, ApJ, 782, L17
- Díaz-Santos et al. (2017) Díaz-Santos, T., Armus, L., Charmandaris, V., et al. 2017, ApJ, 846, 32
- Farrah et al. (2013) Farrah, D., Lebouteiller, V., Spoon, H. W. W., et al. 2013, ApJ, 776, 38
- Ferkinhoff et al. (2010) Ferkinhoff, C., Hailey-Dunsheath, S., Nikola, T., et al. 2010, ApJ, 714, L147
- Ferkinhoff et al. (2011) Ferkinhoff, C., Brisbin, D., Nikola, T., et al. 2011, ApJ, 740, L29
- Ferkinhoff et al. (2015) Ferkinhoff, C., Brisbin, D., Nikola, T., et al. 2015, ApJ, 806, 260
- Fernández-Ontiveros et al. (2016) Fernández-Ontiveros, J. A., Spinoglio, L., Pereira-Santaella, M., et al. 2016, ApJS, 226, 19
- Fritz et al. (2006) Fritz, J., Franceschini, A., & Hatziminaoglou, E. 2006, MNRAS, 366, 767
- George et al. (2013) George, R. D., Ivison, R. J., Hopwood, R., et al. 2013, MNRAS, 436, L99
- Graciá-Carpio et al. (2011) Graciá-Carpio, J., Sturm, E., Hailey-Dunsheath, S., et al. 2011, ApJ, 728, L7
- Gullberg et al. (2015) Gullberg, B., De Breuck, C., Vieira, J. D., et al. 2015, MNRAS, 449, 2883
- Güsten et al. (2006) Güsten, R., Nyman, L. Å., Schilke, P., et al. 2006, A&A, 454, L13
- Hashimoto, et al. (2018) Hashimoto, T., Laporte, N., Mawatari, K., et al. 2018, Nature, 557, 392.
- Hashimoto et al. (2019) Hashimoto, T., Inoue, A. K., Mawatari, K., et al. 2019, PASJ, 70
- Herrera-Camus et al. (2016) Herrera-Camus, R., Bolatto, A., Smith, J. D., et al. 2016, ApJ, 826, 175
- Herrera-Camus et al. (2018) Herrera-Camus, R., Sturm, E., Graciá-Carpio, J., et al. 2018, ApJ, 861, 94.
- Inoue et al. (2016) Inoue, A. K., Tamura, Y., Matsuo, H., et al. 2016, Science, 352, 1559
- Kamenetzky et al. (2014) Kamenetzky, J., Rangwala, N., Glenn, J., Maloney, P. R., & Conley, A. 2014, ApJ, 795, 174
- Kaufman et al. (2006) Kaufman, M. J., Wolfire, M. G., & Hollenbach, D. J. 2006, ApJ, 644, 283
- Kennicutt, & Evans (2012) Kennicutt, R. C., & Evans, N. J. 2012, ARA&A, 50, 531
- Klein et al. (2014) Klein, T., Ciechanowicz, M., Leinz, C., et al. 2014, IEEE Transactions on Terahertz Science and Technology, 4, 588
- Lagache et al. (2018) Lagache, G., Cousin, M., & Chatzikos, M. 2018, A&A, 609, A130.
- Lu et al. (2017) Lu, N., Zhao, Y., Díaz-Santos, T., et al. 2017, ApJ, 842, L16
- Ma et al. (2015) Ma, J., Gonzalez, A. H., Spilker, J. S., et al. 2015, ApJ, 812, 88.
- Ma et al. (2016) Ma, J., Gonzalez, A. H., Vieira, J. D., et al. 2016, ApJ, 832, 114.
- Magdis et al. (2012) Magdis, G. E., Daddi, E., Béthermin, M., et al. 2012, ApJ, 760, 6.
- Maiolino et al. (2008) Maiolino, R., Nagao, T., Grazian, A., et al. 2008, A&A, 488, 463
- Malhotra et al. (2001) Malhotra, S., Kaufman, M. J., Hollenbach, D., et al. 2001, ApJ, 561, 766.
- Mannucci et al. (2010) Mannucci, F., Cresci, G., Maiolino, R., et al. 2010, MNRAS, 408, 2115
- Marrone et al. (2018) Marrone, D. P., Spilker, J. S., Hayward, C. C., et al. 2018, Nature, 553, 51
- Moriwaki et al. (2018) Moriwaki, K., Yoshida, N., Shimizu, I., et al. 2018, MNRAS, 481, L84.
- Nagao et al. (2011) Nagao, T., Maiolino, R., Marconi, A., & Matsuhara, H. 2011, A&A, 526, A149
- Nagao et al. (2012) Nagao, T., Maiolino, R., De Breuck, C., et al. 2012, A&A, 542, L34
- Noll et al. (2009) Noll, S., Burgarella, D., Giovannoli, E., et al. 2009, A&A, 507, 1793
- Novak et al. (2019) Novak, M., Bañados, E., Decarli, R., et al. 2019, ApJ, 881, 63
- Palay et al. (2012) Palay, E., Nahar, S. N., Pradhan, A. K., et al. 2012, MNRAS, 423, L35.
- Pavesi et al. (2016) Pavesi, R., Riechers, D. A., Capak, P. L., et al. 2016, ApJ, 832, 151
- Pereira-Santaella et al. (2017) Pereira-Santaella, M., Rigopoulou, D., Farrah, D., Lebouteiller, V., & Li, J. 2017, MNRAS, 470, 1218
- Pety (2005) Pety, J. 2005, SF2A-2005: Semaine de l’Astrophysique Francaise, 721
- Planck Collaboration et al. (2016) Planck Collaboration, Ade, P. A. R., Aghanim, N., et al. 2016, A&A, 594, A13
- Pound & Wolfire (2008) Pound, M. W., & Wolfire, M. G. 2008, Astronomical Data Analysis Software and Systems XVII, 654
- Rangwala et al. (2011) Rangwala, N., Maloney, P. R., Glenn, J., et al. 2011, ApJ, 743, 94
- Rigopoulou et al. (2018) Rigopoulou, D., Pereira-Santaella, M., Magdis, G. E., et al. 2018, MNRAS, 473, 20
- Rosenberg et al. (2015) Rosenberg, M. J. F., van der Werf, P. P., Aalto, S., et al. 2015, ApJ, 801, 72
- Sanders et al. (2003) Sanders, D. B., Mazzarella, J. M., Kim, D.-C., et al. 2003, AJ, 126, 1607
- Sargsyan et al. (2014) Sargsyan, L., Samsonyan, A., Lebouteiller, V., et al. 2014, ApJ, 790, 15
- Schreiber et al. (2017) Schreiber, C., Pannella, M., Leiton, R., et al. 2017, A&A, 599, A134
- Solomon et al. (1997) Solomon, P. M., Downes, D., Radford, S. J. E., et al. 1997, ApJ, 478, 144.
- Spilker et al. (2016) Spilker, J. S., Marrone, D. P., Aravena, M., et al. 2016, ApJ, 826, 112
- Spilker et al. (2018) Spilker, J. S., Aravena, M., Béthermin, M., et al. 2018, Science, 361, 1016
- Spinoglio et al. (2015) Spinoglio, L., Pereira-Santaella, M., Dasyra, K. M., et al. 2015, ApJ, 799, 21
- Stacey et al. (2010) Stacey, G. J., Hailey-Dunsheath, S., Ferkinhoff, C., et al. 2010, ApJ, 724, 957.
- Strandet et al. (2016) Strandet, M.., Weiss, A., Vieira, J., et al. 2016, ApJ, 822, 80
- Strandet (2018) Strandet, M. 2018, PhD thesis Rheinischen Friedrich-Wilhelms-Universität Bonn
- Tadaki et al. (2019) Tadaki, K.-. ichi ., Iono, D., Hatsukade, B., et al. 2019, ApJ, 876, 1.
- Tamura et al. (2019) Tamura, Y., Mawatari, K., Hashimoto, T., et al. 2019, ApJ, 874, 27
- Uzgil et al. (2016) Uzgil, B. D., Bradford, C. M., Hailey-Dunsheath, S., Maloney, P. R., & Aguirre, J. E. 2016, ApJ, 832, 209
- Valtchanov et al. (2011) Valtchanov, I., Virdee, J., Ivison, R. J., et al. 2011, MNRAS, 415, 3473
- Vasta et al. (2010) Vasta, M., Barlow, M. J., Viti, S., et al. 2010, MNRAS, 404, 1910.
- Vieira et al. (2013) Vieira, J. D., Marrone, D. P., Chapman, S. C., et al. 2013, Nature, 495, 344.
- Villar-Martin et al. (1997) Villar-Martin, M., Tadhunter, C., & Clark, N. 1997, A&A, 323, 21
- Vishwas, et al. (2018) Vishwas, A., Ferkinhoff, C., Nikola, T., et al. 2018, ApJ, 856, 174.
- Walter et al. (2011) Walter, F., Weiß, A., Downes, D., Decarli, R., & Henkel, C. 2011, ApJ, 730, 18
- Walter et al. (2018) Walter, F., Riechers, D., Novak, M., et al. 2018, ApJ, 869, L22.
- Wardlow et al. (2017) Wardlow, J. L., Cooray, A., Osage, W., et al. 2017, ApJ, 837, 12
- Weiß et al. (2013) Weiß, A., De Breuck, C., Marrone, D. P., et al. 2013, ApJ, 767, 88
- Wilson et al. (2017) Wilson, D., Cooray, A., Nayyeri, H., et al. 2017, ApJ, 848, 30
- Yang et al. (2019) Yang, J., Venemans, B., Wang, F., et al. 2019, ApJ, 880, 153
- Zhang et al. (2018) Zhang, Z.-Y., Ivison, R. J., George, R. D., et al. 2018, MNRAS, 481, 59.
- Zhao et al. (2016) Zhao, Y., Lu, N., Xu, C. K., et al. 2016, ApJ, 819, 69