additions
Netboost: Boosting-supported network analysis improves high-dimensional omics prediction in acute myeloid leukemia and Huntington’s disease
Abstract
Background:
State-of-the art selection methods fail to identify weak but cumulative effects of features found in many high-dimensional omics datasets.
Nevertheless, these features play an important role in certain diseases.
Results:
We present Netboost, a three-step dimension reduction technique. First, a boosting-based filter
is combined with the topological overlap measure to identify the essential edges of the network.
Second, sparse hierarchical clustering is applied on the selected edges to identify modules and
finally module information is aggregated by the first principal components. The primary analysis
is than carried out on these summary measures instead of the original data.
We demonstrate the application of the newly developed Netboost in combination with CoxBoost for
survival prediction
of DNA methylation and gene expression data from 180 acute myeloid leukemia
(AML) patients and show, based on cross-validated prediction error
curve estimates, its prediction superiority over variable selection on the full dataset as well as over an
alternative clustering approach. The identified signature related to chromatin modifying enzymes was replicated in
an independent dataset of AML patients in the phase II AMLSG 12-09 study.
In a second application we combine Netboost with Random Forest
classification and improve the disease classification error in RNA-sequencing data of Huntington’s disease mice.
Conclusion:
Netboost improves definition of predictive variables for survival analysis and classification. It is a freely
available Bioconductor R package for dimension reduction and hypothesis generation in high-dimensional omics applications.
-
1.
Institute of Genetic Epidemiology, Faculty of Medicine and Medical Center - University of Freiburg, Freiburg im Breisgau, Germany
-
2.
Institute of Medical Biometry and Statistics, Faculty of Medicine and Medical Center - University of Freiburg, Freiburg im Breisgau, Germany
-
3.
Department of Hematology and Oncology, Augsburg University Medical Center, Augsburg, Germany
-
4.
Department of Internal Medicine III, University Hospital of Ulm, Ulm, Germany
-
5.
Division of Cancer Epigenomics, German Cancer Research Center, Heidelberg, Germany
-
6.
Hematology, Oncology and Tumor Immunology, Campus Virchow Hospital, Charite University Medicine, Berlin, Germany
-
7.
Department of Hematology-Oncology, Medical Center, Faculty of Medicine, University of Freiburg, Freiburg im Breisgau, Germany
-
8.
German Consortium for Translational Cancer Research (DKTK), Freiburg im Breisgau, Germany
-
∗
pascal.schlosser@uniklinik-freiburg.de
Background
Microarray, sequencing and other high-throughput functional genomics technologies are developing rapidly, incorporating more and more features. A major challenge in biomedical research is the contrast of these high-dimensional datasets and the related investigation of potentially hundreds of thousands of features with only a limited sample population in the range of tens to a few hundreds. This gives rise to dimension reduction techniques with the aim of identifying the subspace with minimal dimensions and the best characterization of the outcome variable simultaneously[1].
Many times, methods which were originally developed for the selection of tens of clinical variables are now faced with the challenge of selecting from hundreds of thousands or even from millions of variables. In cases where it is not expected that a singular feature dominates the effect but rather that a larger group of features works cumulatively, the challenge becomes even greater.
In acute myeloid leukemia (AML) part of the epigenotype of the disease is a global increase in DNA methylation in regulatory regions [2]. Furthermore, for elderly patients the only effective drugs that counteract this effect are hypomethylating agents [3, 4, 5]. From this it is known that the state of methylation fulfills an important role in this disease. Nevertheless it has been difficult to incorporate DNA methylation markers in patient relevant statistics like survival prediction [3, 6]. Predictive methylation sites in AML patients treated with chemotherapeutics [7] and predictive sites from chronic myelomonocytic leukemia patients treated with hypomethylating drugs [8] could not be replicated for AML patients treated with hypomethylating drugs.
Weighted Gene Co-expression Network Analysis (WGCNA) [9] is a versatile framework to extract networks from high-dimensional data. It is able to identify biologically functional subgroups, called modules, under many differing settings [10, 11, 12]. When relating this structured information to the outcome of interest, additional challenges are faced. We are interested in the subgroups of features which are most central to the function of the modules. The method has to be even more selective in differentiating background noise from true connections to be used to explain the interplay of differing molecular levels, like gene expression and DNA methylation.
With Netboost, we propose a procedure to reduce dimensions within high-dimensional datasets. We put a specific emphasis on large subgroups of features that show a shared effect. For this we aggregate subgroup information before applying the primary analysis strategy. In public domain examples we show that we are able to extract patient relevant information from multiple high-dimensional measurement types.
The paper is organized as follows. Section Methods outlines the newly developed Netboost and describes the implementation. In Section Results Netboost is applied in two public domain datasets and its performance is compared with two other approaches for each application. Section Discussion outlines the limitations and the potential future direction of the proposed method to conclude the paper.
Methods
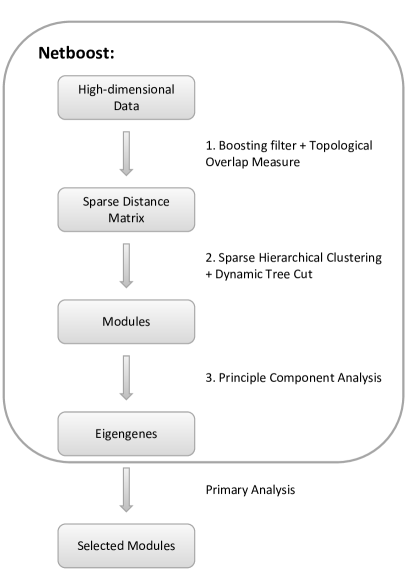
Netboost is a three-step procedure. As shown in Figure 1, in the first step we calculate the boosting-based filter and a sparse distance matrix between features (Section Boosting-based filter and Distance calculation). From this combination we can reduce the network to its essential edges and remove spurious connections, originating from noise. We still retain the interconnectedness and stability of complex network structures including indirect connections that occur in many omics datasets reflecting biological pathway structures.
The second step consists of sparse hierarchical clustering and the dynamic tree cut procedure to determine modules from the dendrogram (Section Hierarchical clustering and decomposition into modules) to transfer the network into a clustering.
Subsequently in step three, we aggregate the information in the modules by their first principal components (PCs) (Section Aggregation of module information) to achieve a low-dimensional representation of the original data.
In this network-based dimension reduction method we modify the WGCNA by the addition of a multivariate filter and by the application of sparse hierarchical clustering. Netboost is then followed by the primary analysis approach with the aggregated module information instead of with the original omics data. Here we present two applications, CoxBoost [13] to fit a Cox proportional hazards model integrated with a variable selection (Section TCGA AML: Methylation and gene expression predictive of overall survival) and a classification analysis by Random Forests [14] (Section Huntington’s disease: Gene expression and CAG repeats).
Module detection
Let be a -dimensional data-matrix, where with being the number of samples and the number of features. We assume to be continuous in each feature.
Boosting-based filter
To first identify a general structure of our network we aggregate a filter of important network edges by boosting. Let index samples, index variables and
| and |
We fit
with . Here, we perform component-wise likelihood-based boosting to fit a linear approximation of the outcome variable. In each iteration we fit the linear base learners using Fisher scoring with respect to the overall likelihood function one-by-one while keeping all other base learners fixed [15, 16]. Boosting is stopped after a given fixed number of steps. For all we then add the tuple to the filter. We estimate an undirected network, therefore the order of is irrelevant. We define the filter by
By pruning the network to we remove uninformative edges, reduce computational load and noise in subsequent steps.
Distance calculation
For tuples in we define the adjacency of two features analogous to [9] by the power adjacency function. For all other tuples the adjacency is set to 0. Hence, we have
where is chosen data-based by the scale free topology criterion [17] on a random subset of features. cor denotes the Pearson correlation.
We combine the topological overlap measure (TOM) [18] with and define
| (1) |
As it follows that . These similarities are inverted to distances by
| (2) |
Hierarchical clustering and decomposition into modules
We apply the unweighted pair group method with arithmetic mean (UPGMA) [19] to DistTOM. Parts of the network where no path exists in are clustered independently. A path between and exists exactly then when there is an such that there are with , and . The dendrograms resulting from these hierarchical clusterings are separated into modules by the Dynamic Tree Cut procedure [20]. Thus, features which are topologically close on the filtered edges are grouped into modules.
Aggregation of module information
By design the first PC explains the variation in one dimensional space as much as possible. Therefore, we aggregate the information in each module by its first PC, the so called eigengenes [9]. In a final step modules with highly correlated first principal components are merged to further reduce dimensionality. We define as the first principal component of the th module and
where is the number of detected modules. has the dimension where . Due to its definition a substantial part of variation in is conserved in . At the same time the dimensionality is considerably reduced.
Module selection and evaluation
Variable selection is performed analog to the primary analysis approach, but it is done on the set of eigengenes rather than on the set of features.
CoxBoost
We apply CoxBoost [13] to integrate the potentially still high-dimensional with clinical covariates and survival data as the primary outcome by likelihood-based boosting. Analysis is implemented with the CoxBoost R package [21]. The stopping criterion is chosen by cross-validation and a Cox proportional hazards model is fitted.
Prediction errors
To evaluate the performance of CoxBoost models we used the peperr R package [22] which implements .632+ prediction errors based on subsamples without replacement as recommended in [23]. In high-dimensional data constellations bootstrap samples with replacement often lead to overly complex models. Therefore, subsamples without replacement of 63.2% of the samples, which is equal to the expected number of unique observations in one bootstrap sample drawn with replacement, are implemented. Variability of prediction error curves is displayed by the distribution of integrated prediction error curves of the subsamples.
Random forests
We apply random forests as described in [14] to classify samples based on to their disease severity classes. To adequately explore the space of possible trees, also for the most high-dimensional of the analyses, we grow 10,000 trees in each analysis.
Implementation
Netboost is built as an R package. It has been tested under Linux and macOS. A Windows implementation is currently not planned due to compiler dependencies.
As depicted in algorithm 1 we first calculate . Under the assumption of continuous and after scaling and centering each we efficiently implement the likelihood based boosting. The subsequent calculation of the adjacencies and the TOM are performed exclusively on network edges in . Then the sparse distance matrix is exported to Sparse UPGMA by [24]. Here all empty edges where the nodes are connected indirectly are assumed to have the maximal distance in the network and completely unconnected nodes of the network are processed separately in independent clusterings. This agrees with the described method as all connected nodes not in have the distance of 1. By applying the filter we therefore reduce the memory load and computational burden massively as the filter is smaller than the whole network by orders of magnitudes as demonstrated in the examples in section Results.
The algorithm is freely available as a Bioconductor R package at http://bioconductor.org/packages/release/bioc/html/netboost.html. All functionality of Netboost is available from within R whereas substantial parts of the algorithm are implemented in C++. Sparse UPGMA is part of the standalone MC-UPGMA software (for details see [24]). It is distributed with the Netboost R package. For extraction of modules we applied the WGCNA [9] and dynamicTreeCut [20] R packages. As an example for the computational demand Netboost was run on a dataset with 180 samples and 413,169 features (for details see section TCGA AML: Methylation and gene expression predictive of overall survival). Applying two Xeon E5 2690v3 at 2.6GHz (2x12cores) and 40 GB of RAM it took Netboost 13.94 hours to compute.
Results
We apply Netboost to two datasets. In section TCGA AML: Methylation and gene expression predictive of overall survival it is applied to DNA methylation and gene expression data from The Cancer Genome Atlas (TCGA) AML cohort to predict survival (see CoxBoost). In section Huntington’s disease: Gene expression and CAG repeats it is applied to RNA sequencing data to classify (see Random forests) Huntington’s disease severity in mice.
TCGA AML: Methylation and gene expression predictive of overall survival
We selected the 180 AML patients in the public domain TCGA database for which overall survival data, methylome and gene expression measurements were available. TCGA data was already preprocessed and normalized. Methylation was quantified with Illumina Infinium HumanMethylation450 BeadChip arrays and gene expression by Affymetrix HG U133 Plus 2.0 arrays. Thereby 396,065 methylation and 17,104 gene expression measurements were incorporated. We compared the following three schemes each with and without a clinical score. The clinical score is a dichotomized version of the linear predictor of a Cox proportional hazards regression model [25] of age at diagnosis and cytogenetic risk group, assessed as low, intermediate or high. Baseline hazards were estimated in separate strata according to sex. The score was solely used to evaluate Netboosts performance.
In the models with the clinical score it was set as mandatory and thereby unpenalized in CoxBoost. Thereby, DNA methylation and gene expression information was only added in these models if they could improve the prediction on top of the clinical score.
-
1.
Direct application: Application of CoxBoost on the full dataset .
-
2.
Blockwise modules: The same approach as in Netboost but with the module detection done by blockwise WGCNA.
-
3.
Netboost: Module PCs are calculated as described in section Methods. CoxBoost is applied to these.
The blockwise modules approach was the initial inspiration for the Netboost method. They coincide with one another apart from Netboosts added boosting-based filter and that has to be separated into feature subsets for WGCNA so that the whole correlation matrix on the individual subsets can be computed. This is accomplished with k-means clustering and later aggregation via correlated eigengenes [9].
CoxBoost was implemented in all analyses in R with the peperr package [22]. We used 10-fold cross validation to estimate the optimal stopping criterion on the interval from 0 to 100. We applied 200 resampling steps to estimate the 632+ prediction errors.
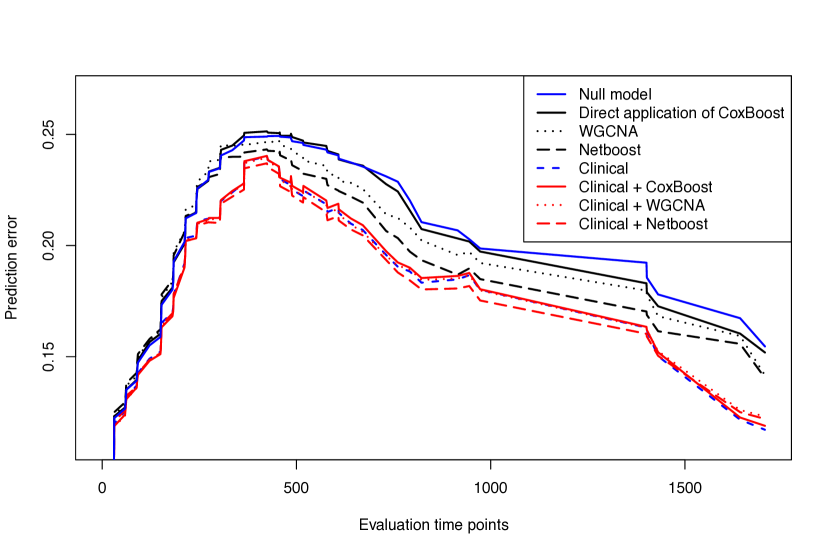
In models 1.-3. we integrated the analysis without the clinical score. The direct application on the full dataset, , selected two features and the 632+ prediction error curve, depicted in Figure 2, shows no improvement over the null model. The estimated .632+ prediction errors for days since diagnosis are given in blue for the null model and dashed blue for the clinical model. Prediction error curves based solely on DNA methylation and gene expression are presented in black: The solid line for the direct application of CoxBoost, the dotted line for the combination with weighted gene co-expression network analysis (WGCNA) and the dashed line for the combination with Netboost. The corresponding prediction error curves additionally based on unpenalized clinical data are presented in red.
Blockwise modules identified 568 modules with a mean module size of 671 in the range of 10 to 57,548. Ten was set as the minimum module size. Henceforth, 92% of the features were assigned to modules. The proportion of variance explained by eigengenes ranged from 23.9% to 94.6% (median = 50.5%). In the WGCNA aggregated two modules were selected by CoxBoost summarizing 26 features.
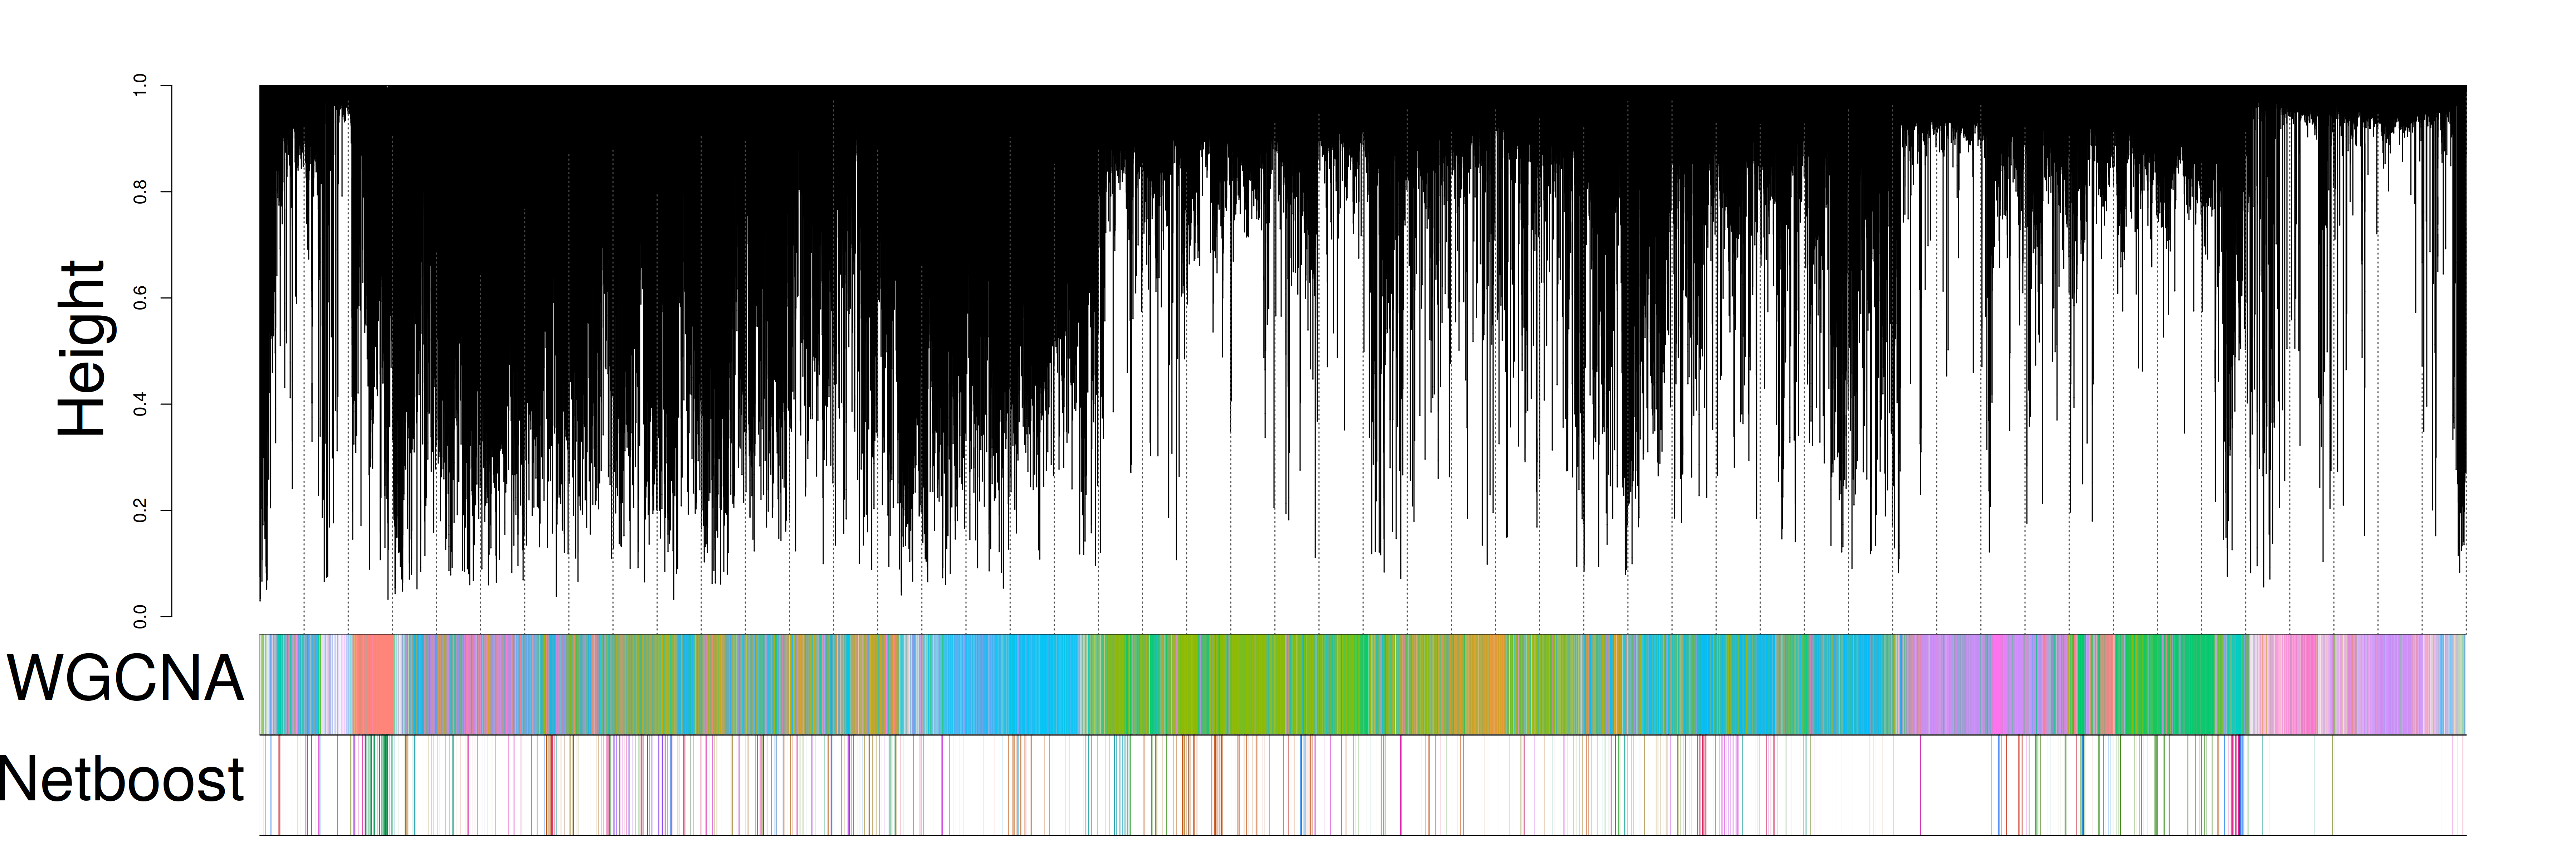
For Netboost the multivariate filter was stopped after 20 steps and resulted in a filter of 4,956,518 network edges. This represents approximately of the edges. Based on this Netboost identified 739 modules with an average module size of 52 in the range of 10 to 4,251. Accordingly 9% of the features were assigned to modules. The dendrogram based on the sparse network is depicted in Figure 3. Netboost eigengenes generally explained a higher proportion of variance (median = 66.5%, range = [45.7%, 97.3%]). CoxBoost selected six modules from the Netboost aggregated , summarizing 278 features. None of the features are shared by the selected Netboost modules and the selected WGCNA modules.
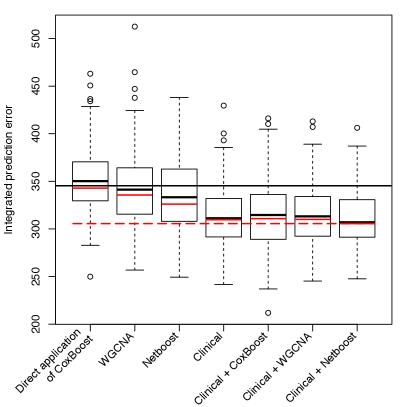
As shown in Figure 2 the higher complexity indeed corresponds to a better prediction performance in the 632+ prediction errors. The blockwise modules approach was able to extract some information but was outperformed by Netboost. This also holds true when incorporating the variability of the individual 632+ resampling steps in Figure 4.
As depicted in Figure 2 and Figure 4, once we added the clinical score as a mandatory covariate, none of the three approaches was able to extract substantial additional information from the molecular data. Overall, when comparing integrated prediction errors all analyses but the direct application of CoxBoost showed significant improvements over the null model (one-samples Student’s t-test, p-value). Netboost including the clinical score had the lowest p-value (p-value = 1.3e-27). When comparing analyses with each other the integration with WGCNA and the Netboost significantly improved CoxBoost (p-value = 0.0437 and p-value = 0.0002, respectively) and Netboost improved the accuracy of survival prediction on top of WGCNA (p-value = 0.0413). Furthermore, all analyses including the clinical score significantly improved prediction when compared with any analysis without the clinical score. In between analyses including the clinical score no significant differences were observed (two-samples Student’s t-test, p-value).
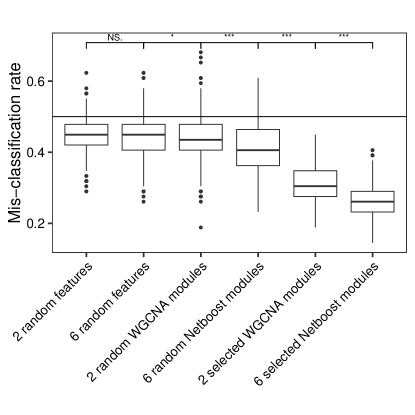
To investigate the possibility of the molecular information extracted by Netboost being a surrogate for the clinical score, we fitted logistic regression models for the module eigengenes to the clinical score. We compared random selections of features out of all DNA methylation and gene expression features and modules, WGCNA and Netboost respectively, of similar size to the modules selected by WGCNA and Netboost and the modules selected for survival prediction. We fitted 500 models on subsamples of size 100 and evaluated the misclassification-rate on the remaining samples. For the random selections, features were reselected with each fit. As shown in Figure 5, the selected Netboost modules approximated the clinical score best.
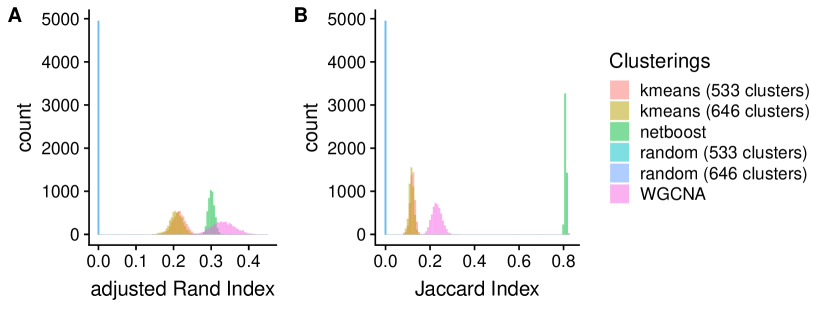
To further comprehend the differences in the clustering we took random subsets of size 100 and compared the resulting Netboost and WGCNA clusterings using pairwise adjusted Rand Indices and Jaccard Indices [26, 27]. Additionally, we calculated kmeans clusterings with the number of clusters fixed to the median number of clusters in Netboost clusterings (646) and WGCNA clusterings (533) and generated random clusterings with the respective number of clusters. The Rand Index is defined as the proportion of consistently clustered features between the two clusterings so tuples of features that are in both clusterings either in a common cluster or in both clusterings in differing clusters. The adjusted Rand Index corrects this for the expected number of consistent tuples given that the number of features and the number of clusters such that adjusted Rand Index. The Jaccard Index is similar to the Rand Index, however it disregards tuples for features that are in different clusters for both clusterings. Both indices are less than or equal 1 and exactly 1 for identical clusterings. As seen in Figure 6 both random clusterings had consistently pairwise indices of 0 and both kmeans clusterings were outperformed by WGCNA and Netboost with respect to both metrics. With respect to the adjusted Rand Index Netboosts median was below WGCNAs median while the order of minima was vice versa. When comparing the Jaccard Indices, Netboost outperforms WGCNA and shows a higher similarity for all pairwise comparisons with respect to this measure.
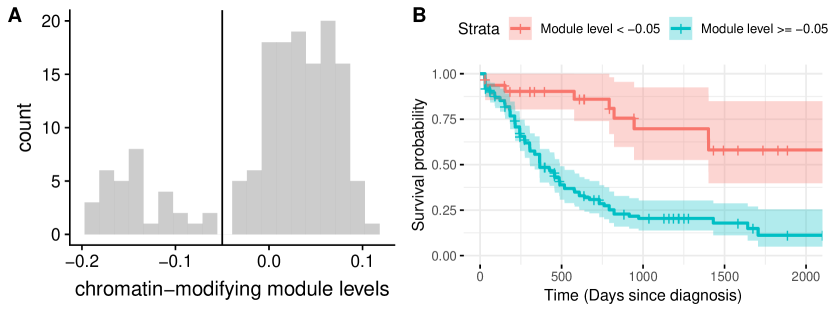
Netboost modules reflected known biology. 206 of the 739 Netboost modules consist of CpGs within 1,000 base pairs demonstrating the strength of local dependency in DNA methylation data. Netboost re-identified data-driven the association of CpGs in close proximity and cis association of gene methylation and expression. In total, six different modules were selected that were variable in size and composition: 4 of the 6 modules consisted only of CpGs, one predominantly of CpGs and, in addition, 2 RNAs, one module only of 14 RNAs. The total number of CpGs varied from 10 to 88. The largest module (88 CpGs) contained numerous genes associated with hematopoiesis, such as WT1 and CXCL2. The 2nd largest module (80 CpGs, 2 RNAs) represented several genes encoding chromatin-modifying enzymes such as the H3K9 histone methyltransferase EHMT1 and the DNA demethylase TET3. To illustrate the strong association of this chromatin associated module alone we plotted stratified Kaplan-Meier curves according to its bimodal distribution (Figure 7 A,B). The p-value of the likelihood ratio test of the dichotomised module levels (p-value = 7.0e-7) surpassed the one of the continues module levels (p-value = 4.0e-6); indicating that there might indeed be two states of these genes. Several of these have already been implicated in AML pathogenesis and appear very promising for future predictive scores. Specifically, 4 CpGs mapped to the gene encoding EHMT1, also represented in the 4-gene methylation signature described by [7].
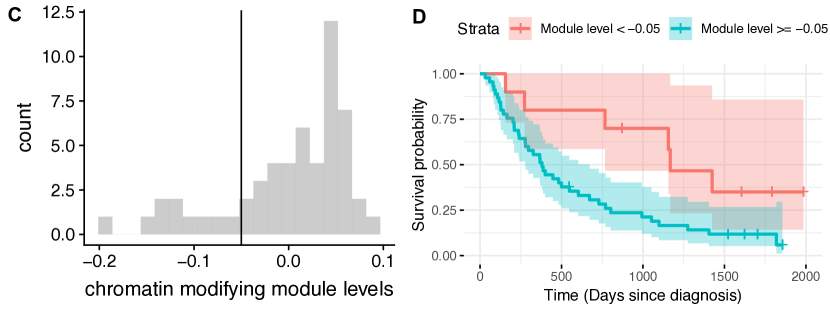
To validate the Netboost signature, we transferred it to DNA methylation data generated on pre-treatment patient samples from the phase II AMLSG 12-09 study [28]. In this study, DNA methylation based on the same Illumina Infinium 450k array and overall survival was available for 55 AML patients. For processing and quality control of the raw methylation data, a customized version of the CPACOR pipeline [29] was used for data normalization and calculation of beta values. The complete preprocessing pipeline is available on Github (https://github.com/genepi-freiburg/Infinium-preprocessing). As no data on gene expression was available one of the six modules could not be studied at all, while 2 were partially available (79 of 82 and 64 of 67 features) and 3 modules were available with all features. While the cox proportional hazards model of these five modules was not significant in this smaller dataset (p-value = 0.4) the above mentioned chromatin associated module alone did replicate (p-value = 0.04). Furthermore, this module exhibited a similar bimodal pattern as in TCGA and again, dichotomization led to a smaller p-value (p-value = 0.01, Figure 7 C,D).
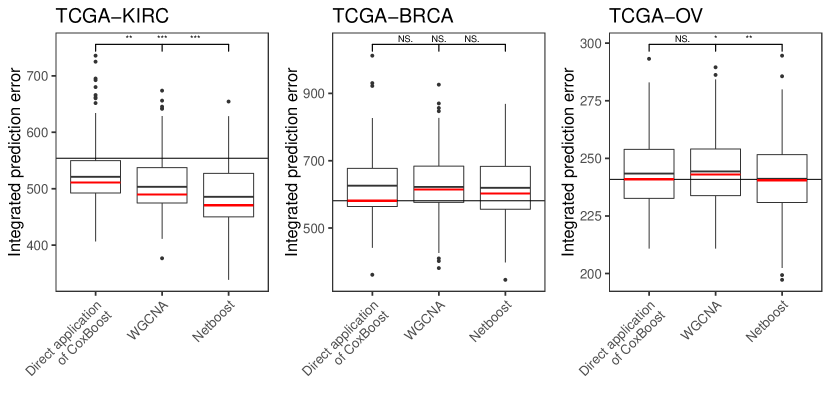
After the detailed analysis of the TCGA-AML DNA methylation and gene expression dataset we downloaded three more TCGA datasets; DNA methylation data of 774 breast invasive carcinoma (TCGA-BRCA) and 315 kidney renal clear cell carcinoma (TCGA-KIRC) patients and miRNA data of 464 ovarian serous cystadenocarcinoma (TCGA-OV) patients with available overall survival information. The 1,422 TCGA-OV miRNAs without missings and the 20,000 CpG sites with the largest variance for TCGA-BRCA and TCGA-KIRC respectively were selected for analysis. For each dataset we performed the same three analyses as for AML and calculated the 632+ prediction error estimates. Boxplots of the integrated prediction errors on the test set of the individual subsamplings are depicted in Figure 8. For clear cell carcinoma we observed similar performance as in AML. The integration with WGCNA significantly improved CoxBoost (p-value = 0.0013) and integration with Netboost improved the accuracy of survival prediction on top of WGCNA (p-value = 0.0006). For the other two datasets none of the three approaches was able to improve overall survival prediction.
Huntington’s disease: Gene expression and CAG repeats
Huntington’s Disease (HD) is driven by the number of CAG repeats in the huntingtin gene. In [12] WGCNA revealed 13 striatal gene expression modules that correlated with CAG length and age in a HD knock-in mouse model. Further it was shown that several of these effects translate to other HD models and patients. Recently, the analysis was extended to miRNA from the same mice in [30].
To evaluate the performance of Netboost we used the mRNA dataset in an inverse setup and determined the prediction errors in a classification task. We selected the 48 mRNA-sequencing samples from mouse striatum consisting of six genetically engineered disease severities (20, 80, 92, 111, 140 and 175 CAG repeats) with four female and four male mice all harvested at 6 months. We downloaded the preprocessed mRNA-sequences from the Gene Expression Omnibus. After removal of invariant transcripts, data consisted of 28,010 transcripts.
We compared three setups:
-
1.
Direct application: Random forest (RF) on the full dataset .
-
2.
Blockwise modules: Blockwise WGCNA + RF on module PCs
-
3.
Netboost: RF on module PCs determined by Netboost
RF was implemented in all analyses in R with the randomForest package [14]. We used 200 iterations of leave-one-out cross-validation.
The direct application on the full dataset, , resulted in a mean prediction error of .
Blockwise modules identified 61 modules with a mean module size of 423 in the range of 11 to 6221. Ten was set as the minimum module size. Henceforth, 92% of the features were assigned to modules. In the HD application the proportion of variance explained by eigengenes was lower than in the AML data (median = 42.1%, range = [29.3%, 63.4%]). On the WGCNA aggregated the mean prediction error was .
For Netboost the multivariate filter was stopped after 20 steps, resulting in a filter of 247,497 network edges. This represents approximately of the edges. Based on this Netboost identified 106 modules with an average module size of 46 in the range of 10 to 561. Accordingly of the features were assigned to modules. Eigengenes of the Netboost modules explained a higher proportion of variance (median = 66.2%, range = [52.3%, 84.9%]). On the Netboost aggregated the mean prediction error was . The dendrogram based on the sparse network is depicted in Figure 9. As shown for 25, 20 and 15 steps the clustering is stable under the choice of boosting steps.
Two-sample tests for equality of proportions with continuity correction showed significant differences in means of prediction errors with Netboost errors being smaller than direct application (p-value = 0.019) and WGCNA (p-value 2.2e-16) and direct application errors being smaller than WGCNA (p-value 2.2e-16).
Discussion
Netboost is designed in an unsupervised manner. While a supervised approach to module detection would possibly further improve accuracy, these approaches are complementary.
In [31] another approach for data with correlated features is proposed. The first step is to cluster the features, and then choose a cluster representative based on prediction performance. The second step is to apply either lasso or marginal significance testing on these representatives. Apart from differences in the applied clustering technique as with other supervised clustering techniques this might lead to improved predictive performance but hinder the interpretation of the selected clusters. Here, the primary aim is to maximize predictive power and thereby optimize the algorithm for biomarker detection. This is done at the cost of potentially introducing some form of bias. Dependent on size and connectivity of the module the supervised selection might pick up peripheral features - voiding their function as a representative.
Thereby, we are hindered if we are interested in the biological interpretation of identified biomarkers in context of the network. Keeping outcome and network detection separate allows for unbiased interpretation of any potential connections between subsequently in the primary analysis selected modules and the outcome.
In [32] two extension to sparse canonical correlation analysis (CCA) [33] are introduced. First they propose a supervised form of sparse CCA and secondly they generalize the framework from two to multiple datasets. With this they offer a framework for identification of sparse linear combinations of the multiple sets of variables that are highly correlated with each other and associated with the outcome. While Netboost can also identify cross-omics correlations associated with the outcome, [32] omit within datatype connections and optimize their algorithm solely for cross-dataset combinations.
Starting with the WGCNA methodology our original design is the introduction of the filtering step before constructing the correlation-based network. Here, we chose a boosting based edge detection to allow for efficient selection of essential edges. By introduction of this sparsity to the network we modified the TOM based distance and replaced UPGMA with the sparse UPGMA by Loewenstein et al [24]. As Netboost is still based on the Pearson correlation coefficient and PCA based dimension reduction Netboost and WGCNA share many of the same advantages and drawbacks due to their similarity in design.
Having a single representative for each cluster might be an advantage for biomarker identification. Another approach to consider for this purpose are hub genes replacing the eigengenes we applied, as discussed in [34] and [35]. A hub gene is the most central node with the highest connectivity of the module as opposed to a summary measure and therefore allows cost efficient replication and application as a biomarker [36]. Eigengenes might be superior in mechanistic studies, exploratory studies and the identification of previously unknown biological features.
In general for dimension reduction of modules, eigengenes optimize explained variance with respect to the predefined dimensionality. In our applications we fixed this to one to achieve comparability to WGCNA. However, our R package is more flexible than WGCNA and allows for the optional export of the first PCs with a fixed or for each module the first PCs which cumulatively explain at least of variance. Principal component based dimension reduction works particularly well if variables have linear relationships. If variables in modules would have non-linear relationships other more flexible dimension reduction techniques such as autoencoders [37, 38] might be more suited for calculation of aggregate measures. As the proposed module detection is ultimately based on the Pearson correlation coefficient which measures the strength of the linear relationship PCA based aggregation of modules is well defined as is observed by the high proportion of variance explained. If non-linear relationships between the features are of interest a complementary method would be required.
In Netboost feature-wise distances are defined based on Pearson correlation coefficients, e.g. [34] constructs networks based on partial correlations. In the form of Gaussian graphical models (GGM) partial correlations are frequently applied for network construction [39, 40]. In [41] GGMs are combined with a filtering step to exclude insignificant edges from the network much like Netboost. Partial correlations adjust for other variables in the network and identify the independent connections between features. In contrast, in Netboost we integrate indirect connections even further by the TOM. This is done to identify interacting subgroups irrespective of whether this interaction is direct or indirect. The focus lies on modules rather than on the individual edges, and the incorporation of indirect connections further stabilizes module detection.
As with GGMs a prime area of application beyond gene expression and DNA methylation is metabolome and proteome data. Due to their inherent co-regulation structures they offer themself to a network based analysis as was recently successfully demonstrated by combination of WGCNA on proteome data and a subsequent genome wide association study in [42].
Datatype specific features, like dependency of CpG sites in close proximity, are not incorporated as a-priori information in Netboost. While this could inform the network, we prefer a universal design for omics data in general. Therefore, a known biological nexus can be used for module evaluation as was done in Section TCGA AML: Methylation and gene expression predictive of overall survival.
In [43] the authors introduce Net-Cox which also introduces network theory to improve survival prediction in a high-dimensional context. In contrast to our combination of Netboost and Coxboost, they introduce the estimated gene co-expression structure directly to the penalty term of the Cox model. Net-Cox is thereby inherently designed for survival analysis, whereas Netboost is more flexible in its application.
In the section Huntington’s disease: Gene expression and CAG repeats WGCNA might be improved by the tuning of parameters as we only applied the standard settings and the achieved clustering superimposes the disease classifying signals. Netboost kept a more compartmentalized and detailed network with the standard setting due to the applied filtering step.
In the shown applications we prefer specificity over sensitivity with respect to the clusterings. While it might be okay to miss an additional feature being part of a module we want to be sure about the selected features. Consistent with this, we deem the Jaccard Index as more important to our applications as most features are unrelated. As shown in Figure 6 Netboost is more robust than any of the competing clustering algorithms, when compared to WGCNA by the adjusted Rand Index and the Jaccard Index. To an extent it trades some sensitivity for specificity as expected by the concept of integrating a filter on the network edges. With the adjusted Rand Index and Jaccard Index we chose basic measures of stability, which are especially reliable as they are used in a comparative fashion in identical resampling setting with different methodologies. When trying to assess stability of multi-level clustering structures [44] or specific modules [45] other measures might be more suitable.
The applied clustering technique on the dendrogram in WGCNA and Netboost was introduced and compared to other methods in [20]. We kept the same cutting method to improve comparability. Primary applications of WGCNA are related to identification of the network structure itself. With respect to this we regard Netboost as a complementary approach designed to improve analysis including feature selection.
Netboost introduces the number of boosting steps as a parameter. This number can be chosen high as overfitting in filter estimation would only result in a less stringent filter rather than bias. Possible extensions include a probing based stopping criterion in the boosting step. Boosting could be stopped by inserting uninformative features without the need to perform cross validation or a fixed number of boosting steps during generation of the filter. This would automate the choice of boosting steps, while circumventing the often extensive additional computational load of cross-validation. Another direction to extend Netboost is inclusion of unclustered features which are currently ignored in primary analysis. This implies that isolated singular features can not achieve a significant impact on the outcome. This is not true for all settings. In the primary analysis could be combined with a filtering method on the unclustered features.
Conclusion
With Netboost we present an efficient dimension reduction technique based on boosting and weighted gene co-expression networks distributed as a Bioconductor R package. By introducing the boosting-based filter combined with the TOM and sparse hierarchical clustering combined with the dynamic tree cut procedure we were able to extend efficiency and predictive performance simultaneously.
In the gene expression and DNA methylation examples this resulted in a 559- (TCGA AML) and 264-fold (HD) reduction of features for the primary analyses. Choosing eigengenes as summary measures we maximized the explained variance within each modules without an assumptions-based extension to keep Netboost applicable to a diverse set of biological experiments and primary analysis strategies. Here, we displayed applications to in vivo DNA methylation array, RNA array and RNA-seq measurements from patient and mouse samples. Paired with the clustering reflecting biological structures this leads to improvements in highdimensional survival analysis as well as in highdimensional classification.
In the Section TCGA AML: Methylation and gene expression predictive of overall survival the molecular prediction was improved by identification of a surrogate for clinical information within the molecular data and by the identification of hematopoietic genes and genes encoding chromatin-modifying enzymes. In this application we were able to first abstract new features from the highdimensional data (modules), demonstrate a higher robustness than state-of-the-art alternative methods (cross-validation prediction errors) and validate the discovered correlates in an independent dataset (phase II AMLSG 12-09 study). Numerous of these genes have been suspected to play a role in AML pathogenesis before [46, 7]. Overall, the identified signature is promising for future research regarding AML pathogenesis and as a prognostic/predictive marker. Furthermore, the association with chromatin-modifying enzymes could be replicated in an independent DNA methylation data set from the phase II AMLSG 12-09 clinical trial [28] despite no available gene expression measurements. In the AMLSG 12-09 study, the effect of substituting cytarabine by the DNA methyltransferase inhibitor 5-azacitidine in AML induction therapy was studied. This trial tested the hypothesis that 5-azacytidine might reduce failure rates of intensive induction therapy particularly in AML patients with unfavorable genetic features. It is of interest that validation of the chromatin associated module was successful in this independent AML patient DNA methylation data set although the distribution of genetic aberrations in patients treated within the AMLSG 12-09 trial differed considerably from AML patients of the TCGA data set. Particularly, patients with core-binding factor AML, AML with mutated NPM1, and AML with FLT3 internal tandem duplication were excluded in this trial.
In the section Huntington’s disease: Gene expression and CAG repeats Netboost outperformed the two other approaches and achieved the lowest prediction error. In direct comparison to WGCNA, Netboost kept more compartmentalized networks with eigengenes better reflecting their respective module and these eigengenes exhibiting stronger associations with variables of interest. Additionally, separation between, network detection and association with the trait of interest, allows for unbiased analysis and interpretation of the obtained structural information. Due to this, our biological understanding of these complex diseases and experiments might benefit from the increase in prediction accuracy and added information via the extracted network.
List of abbreviations
- AML:
-
Acute Myeloid Leukemia
- CAG repeat:
-
Repeat of the trinucleotide Cytosine, Adenine, Guanine
- CpG:
-
5’—Cytosine—phosphate—Guanine—3’
- DNA:
-
Deoxyribonucleic Acid
- GGM:
-
Gaussian Graphical Models
- HD:
-
Huntington’s Disease
- miRNA:
-
micro RNA
- mRNA:
-
messenger RNA
- PC:
-
Principal Component
- RF:
-
Random Forest
- RNA:
-
Ribonucleic Acid
- TCGA:
-
The Cancer Genome Atlas
- TOM:
-
Topological overlap measure
- UPGMA:
-
Unweighted Pair Group Method with Arithmetic Mean
- WGCNA:
-
Weighted Gene Co-expression Network Analysis
Declarations
Acknowledgements
The authors thank all members of the German-Austrian AML Study Group (AMLSG) for their participation in this study and for providing patient samples.
The results published here are in part based upon data generated by the TCGA Research Network: https://www.cancer.gov/tcga.
Competing interests
The authors declare that they have no competing interests.
Funding
This work has been supported by the Deutsche Forschungsgemeinschaft (German Research Foundation) [SPP1463: LU 429/7-1, LU 429/8-1 to ML; FOR 2674: LU 429/16-1 (A05)] and by the German Consortium for Translational Cancer Research (DKTK) [L637 to ML] and by the Deutsche Krebshilfe [DKH110530 to LB and RC].
Authors’ contributions
PS, RC, ML wrote the manuscript, PS, MaS, CP, RC, ML analyzed data, PS, HB, MS developed the method, PS, JK developed the R package, PS, RC, ML, MS interpreted results, KD, LB supervised the AMLSG 12-09 study, MS supervised the research project, and all authors read and approved the final manuscript.
Availability of data and materials
The datasets supporting the conclusions of this article are available in the GDC Data Portal repository, TCGA-LAML data [https://portal.gdc.cancer.gov/projects/TCGA-LAML] and the Gene Expression Omnibus [GSE65776, http://www.ncbi.nlm.nih.gov/geo/query/acc.cgi?acc=GSE65776].
References
- [1] Yvan Saeys, Inaki Inza, and Pedro Larranaga. A review of feature selection techniques in bioinformatics. Bioinformatics, 23(19):2507–2517, 2007.
- [2] Dominika Sobieszkoda, Joanna Czech, Natalia Gablo, Marta Kopanska, Jacek Tabarkiewicz, Agnieszka Kolacinska, Tadeusz Robak, and Izabela Zawlik. MGMT promoter methylation as a potential prognostic marker for acute leukemia. Archives of Medical Science : AMS, 13(6):1433–1441, 10 2017.
- [3] Claude Gardin and Hervé Dombret. Hypomethylating Agents as a Therapy for AML. Current Hematologic Malignancy Reports, 12(1):1–10, Feb 2017.
- [4] Xavier Thomas and Caroline Le Jeune. Treatment of Elderly Patients With Acute Myeloid Leukemia. Current Treatment Options in Oncology, 18(1):2, Jan 2017.
- [5] E. Papaemmanuil, M. Gerstung, L. Bullinger, V. I. Gaidzik, P. Paschka, N. D. Roberts, N. E. Potter, M. Heuser, F. Thol, N. Bolli, G. Gundem, P. Van Loo, I. Martincorena, P. Ganly, L. Mudie, S. McLaren, S. O’Meara, K. Raine, D. R. Jones, J. W. Teague, A. P. Butler, M. F. Greaves, A. Ganser, K. Dohner, R. F. Schlenk, H. Dohner, and P. J. Campbell. Genomic Classification and Prognosis in Acute Myeloid Leukemia. N. Engl. J. Med., 374(23):2209–2221, Jun 2016.
- [6] Jeanette Prada-Arismendy, Johanna C. Arroyave, and Sarah Röthlisberger. Molecular biomarkers in acute myeloid leukemia. Blood Reviews, 31(1):63 – 76, 2017.
- [7] J. Yamazaki, R. Taby, J. Jelinek, N. J. Raynal, M. Cesaroni, S. A. Pierce, S. M. Kornblau, C. E. Bueso-Ramos, F. Ravandi, H. M. Kantarjian, and J. P. Issa. Hypomethylation of TET2 Target Genes Identifies a Curable Subset of Acute Myeloid Leukemia. J. Natl. Cancer Inst., 108(2), Feb 2016.
- [8] K. Meldi, T. Qin, F. Buchi, N. Droin, J. Sotzen, J. B. Micol, D. Selimoglu-Buet, E. Masala, B. Allione, D. Gioia, A. Poloni, M. Lunghi, E. Solary, O. Abdel-Wahab, V. Santini, and M. E. Figueroa. Specific molecular signatures predict decitabine response in chronic myelomonocytic leukemia. J. Clin. Invest., 125(5):1857–1872, May 2015.
- [9] Peter Langfelder and Steve Horvath. WGCNA: an R package for weighted correlation network analysis. BMC Bioinformatics, page 559, 2008.
- [10] K. R. van Eijk, S. de Jong, M. P. Boks, T. Langeveld, F. Colas, J. H. Veldink, C. G. de Kovel, E. Janson, E. Strengman, P. Langfelder, R. S. Kahn, L. H. van den Berg, S. Horvath, and R. A. Ophoff. Genetic analysis of DNA methylation and gene expression levels in whole blood of healthy human subjects. BMC Genomics, 13:636, 2012.
- [11] S. Horvath, Y. Zhang, P. Langfelder, R. S. Kahn, M. P. Boks, K. van Eijk, L. H. van den Berg, and R. A. Ophoff. Aging effects on DNA methylation modules in human brain and blood tissue. Genome Biol., 13(10):R97, 2012.
- [12] P. Langfelder, J. P. Cantle, D. Chatzopoulou, N. Wang, F. Gao, I. Al-Ramahi, X. H. Lu, E. M. Ramos, K. El-Zein, Y. Zhao, S. Deverasetty, A. Tebbe, C. Schaab, D. J. Lavery, D. Howland, S. Kwak, J. Botas, J. S. Aaronson, J. Rosinski, G. Coppola, S. Horvath, and X. W. Yang. Integrated genomics and proteomics define huntingtin CAG length-dependent networks in mice. Nat. Neurosci., 19(4):623–633, Apr 2016.
- [13] H. Binder and M. Schumacher. Allowing for mandatory covariates in boosting estimation of sparse high-dimensional survival models. BMC Bioinformatics, 9:14, 2008.
- [14] Leo Breiman. Random Forests. Machine Learning, 45(1):5–32, Oct 2001.
- [15] G. Tutz and H. Binder. Generalized additive modeling with implicit variable selection by likelihood-based boosting. Biometrics, 62(4):961–971, Dec 2006.
- [16] T.J. Hastie and R.J. Tibshirani. Generalized Additive Models. Chapman & Hall/CRC Monographs on Statistics & Applied Probability. Taylor & Francis, , 1990.
- [17] Bin Zhang and Steve Horvath. A general framework for weighted gene co-expression network analysis. Statistical Applications in Genetics and Molecular Biology, 4, 2005.
- [18] E. Ravasz, A. L. Somera, D. A. Mongru, Z. N. Oltvai, and A. L. Barabasi. Hierarchical organization of modularity in metabolic networks. Science, 297(5586):1551–1555, Aug 2002.
- [19] R.R. Sokal, C.D. Michener, and University of Kansas. A Statistical Method for Evaluating Systematic Relationships. University of Kansas science bulletin. University of Kansas, , 1958.
- [20] Peter Langfelder, Bin Zhang, and Steve Horvath. Defining clusters from a hierarchical cluster tree: the Dynamic Tree Cut package for R. Bioinformatics, 24:719–720, 2008.
- [21] Harald Binder. CoxBoost: Cox models by likelihood based boosting for a single survival endpoint or competing risks, 2013. R package version 1.4.
- [22] C. Porzelius, H. Binder, and M. Schumacher. Parallelized prediction error estimation for evaluation of high-dimensional models. Bioinformatics, 25(6):827–829, Mar 2009.
- [23] Harald Binder and Martin Schumacher. Adapting Prediction Error Estimates for Biased Complexity Selection in High-Dimensional Bootstrap Samples. Statistical Applications in Genetics and Molecular Biology, 7(1), 01 2008.
- [24] Yaniv Loewenstein, Elon Portugaly, Menachem Fromer, and Michal Linial. Efficient algorithms for accurate hierarchical clustering of huge datasets: tackling the entire protein space. Bioinformatics, 24(13):41–49, 2008.
- [25] T.M. Therneau and P.M. Grambsch. Modeling Survival Data: Extending the Cox Model. Statistics for Biology and Health. Springer, , 2000.
- [26] Silke Wagner and Dorothea Wagner. Comparing clusterings - an overview. Technical Report 4, Karlsruhe, 2007.
- [27] Ulrike von Luxburg. Clustering stability: An overview. Foundations and Trends in Machine Learning, 2(3):235–274, 2010.
- [28] R. F. Schlenk, D. Weber, W. Herr, G. Wulf, H. R. Salih, H. G. Derigs, A. Kuendgen, M. Ringhoffer, B. Hertenstein, U. M. Martens, M. Griesshammer, H. Bernhard, J. Krauter, M. Girschikofsky, D. Wolf, E. Lange, J. Westermann, E. Koller, S. Kremers, M. Wattad, M. Heuser, F. Thol, G. Gohring, D. Haase, V. Teleanu, V. Gaidzik, A. Benner, K. Döhner, A. Ganser, P. Paschka, and H. Döhner. Randomized phase-II trial evaluating induction therapy with idarubicin and etoposide plus sequential or concurrent azacitidine and maintenance therapy with azacitidine. Leukemia, Feb 2019.
- [29] B. Lehne, A. W. Drong, M. Loh, W. Zhang, W. R. Scott, S. T. Tan, U. Afzal, J. Scott, M. R. Jarvelin, P. Elliott, M. I. McCarthy, J. S. Kooner, and J. C. Chambers. A coherent approach for analysis of the Illumina HumanMethylation450 BeadChip improves data quality and performance in epigenome-wide association studies. Genome Biol., 16:37, Feb 2015.
- [30] Peter Langfelder, Fuying Gao, Nan Wang, David Howland, Seung Kwak, Thomas F. Vogt, Jeffrey S. Aaronson, Jim Rosinski, Giovanni Coppola, Steve Horvath, and X. William Yang. Microrna signatures of endogenous huntingtin cag repeat expansion in mice. PLOS ONE, 13(1):1–20, 01 2018.
- [31] Stephen Reid and Robert Tibshirani. Sparse regression and marginal testing using cluster prototypes. Biostatistics, 17(2):364–376, 2016.
- [32] D. M. Witten and R. J. Tibshirani. Extensions of sparse canonical correlation analysis with applications to genomic data. Stat Appl Genet Mol Biol, 8:Article28, 2009.
- [33] D. M. Witten, R. Tibshirani, and T. Hastie. A penalized matrix decomposition, with applications to sparse principal components and canonical correlation analysis. Biostatistics, 10(3):515–534, Jul 2009.
- [34] Donghyeon Yu, Johan Lim, Xinlei Wang, Faming Liang, and Guanghua Xiao. Enhanced construction of gene regulatory networks using hub gene information. BMC Bioinformatics, 18(1):186, Mar 2017.
- [35] Samarendra Das, Prabina Kumar Meher, Anil Rai, Lal Mohan Bhar, and Baidya Nath Mandal. Statistical Approaches for Gene Selection, Hub Gene Identification and Module Interaction in Gene Co-Expression Network Analysis: An Application to Aluminum Stress in Soybean (Glycine max L.). PLOS ONE, 12(1):1–24, 01 2017.
- [36] Steve Horvath and Jun Dong. Geometric Interpretation of Gene Coexpression Network Analysis. PLOS Computational Biology, 4(8):1–27, 08 2008.
- [37] H. Bourlard and Y. Kamp. Auto-association by multilayer perceptrons and singular value decomposition. Biol Cybern, 59(4-5):291–294, 1988.
- [38] Diederik P Kingma and Max Welling. Auto-encoding variational bayes. arXiv preprint arXiv:1312.6114, 2013.
- [39] Jan Krumsiek, Karsten Suhre, Thomas Illig, Jerzy Adamski, and Fabian J. Theis. Gaussian graphical modeling reconstructs pathway reactions from high-throughput metabolomics data. BMC Systems Biology, 5(1):21, Jan 2011.
- [40] Yuying Xie, Yufeng Liu, and William Valdar. Joint estimation of multiple dependent Gaussian graphical models with applications to mouse genomics. Biometrika, 103(3):493–511, 2016.
- [41] Sangin Lee, Faming Liang, Ling Cai, and Guanghua Xiao. Integrative analysis of gene networks and their application to lung adenocarcinoma studies. Cancer Informatics, 16:1176935117690778, 2017.
- [42] V. Emilsson, M. Ilkov, J. R. Lamb, N. Finkel, E. F. Gudmundsson, R. Pitts, H. Hoover, V. Gudmundsdottir, S. R. Horman, T. Aspelund, L. Shu, V. Trifonov, S. Sigurdsson, A. Manolescu, J. Zhu, O. Olafsson, J. Jakobsdottir, S. A. Lesley, J. To, J. Zhang, T. B. Harris, L. J. Launer, B. Zhang, G. Eiriksdottir, X. Yang, A. P. Orth, L. L. Jennings, and V. Gudnason. Co-regulatory networks of human serum proteins link genetics to disease. Science, 361(6404):769–773, 08 2018.
- [43] Wei Zhang, Takayo Ota, Viji Shridhar, Jeremy Chien, Baolin Wu, and Rui Kuang. Network-based Survival Analysis Reveals Subnetwork Signatures for Predicting Outcomes of Ovarian Cancer Treatment. PLOS Computational Biology, 9(3):1–16, 03 2013.
- [44] A. Bertoni and G. Valentini. Discovering multi-level structures in bio-molecular data through the Bernstein inequality. BMC Bioinformatics, 9 Suppl 2:S4, Mar 2008.
- [45] P. Langfelder, R. Luo, M. C. Oldham, and S. Horvath. Is my network module preserved and reproducible? PLoS Comput. Biol., 7(1):e1001057, Jan 2011.
- [46] R. Rampal, A. Alkalin, J. Madzo, A. Vasanthakumar, E. Pronier, J. Patel, Y. Li, J. Ahn, O. Abdel-Wahab, A. Shih, C. Lu, P. S. Ward, J. J. Tsai, T. Hricik, V. Tosello, J. E. Tallman, X. Zhao, D. Daniels, Q. Dai, L. Ciminio, I. Aifantis, C. He, F. Fuks, M. S. Tallman, A. Ferrando, S. Nimer, E. Paietta, C. B. Thompson, J. D. Licht, C. E. Mason, L. A. Godley, A. Melnick, M. E. Figueroa, and R. L. Levine. DNA hydroxymethylation profiling reveals that WT1 mutations result in loss of TET2 function in acute myeloid leukemia. Cell Rep, 9(5):1841–1855, Dec 2014.
Figures