Investigating Particle Acceleration in the Wolf-Rayet Bubble G2.4+1.4
Abstract
The supersonic winds produced by massive stars carry a large amount of kinetic power. In numerous scenarios such winds have been proven to produce shocks in which relativistic particles are accelerated emitting non-thermal radiation. Here, we report the first detection of non-thermal emission from a single stellar bubble, G2.4+1.4, associated with a WO star. We observed this source with the uGMRT in Band 4 ( MHz) and Band 5 ( MHz). We present intensity and spectral index maps for this source that are consistent with synchrotron emission (average spectral index, ). The fraction of the available kinetic wind power that is converted into cosmic ray acceleration is estimated to be of the order of a few per cent. This finding constitutes an observational breakthrough and gives new insight on the non-thermal physical processes taking place in the environments of isolated massive stars. In particular, our results show that non-runaway isolated massive stars are capable of accelerating relativistic particles and are therefore confirmed as sources of Galactic cosmic rays.
[table]capposition=top
1 Introduction
Massive stars profoundly influence the surrounding interstellar medium (ISM) through their mechanical, radiative, and chemical feedback. In recent years, stellar systems involving massive OB and Wolf-Rayet (WR) stars have unraveled interesting laboratories to investigate particle acceleration in strong shocks related to the powerful stellar winds. The detection of non-thermal (NT) emission in such systems imply that relativistic particles can be accelerated in them, most likely via diffusive shock acceleration (DSA; Drury, 1983, and references therein). This acceleration mechanism is ubiquitous in sources with supersonic outflows, such as supernovae remnants (e.g. Dubner & Giacani, 2015), Herbig-Haro objects (Rodríguez-Kamenetzky et al., 2019), proto-stellar jets (Vig et al., 2018), compact young stellar clusters (Yang et al., 2018), and microquasars (Mirabel & Rodríguez, 1994). In OB and WR systems, the detection of synchrotron emission is strongly correlated with binarity (Dougherty & Williams, 2000; De Becker et al., 2006). In these massive binaries, standing shocks result from the collision of the stellar winds, which can lead to efficient particle acceleration (e.g. Eichler & Usov, 1993; De Becker, 2007). Numbered at 40 odd, these are christened as particle-accelerating colliding-wind binaries (De Becker & Raucq, 2013). In addition, stellar bow shocks produced by runaway massive stars could also be efficient at accelerating particles (e.g., del Valle & Romero, 2012, 2014; del Palacio et al., 2018), although the only evidence so far is the detection of NT emission in the system BD+43∘3654 (Benaglia et al., 2010). In consequence, massive stars are now suggested as major factories of Galactic cosmic rays (CRs; Seo et al., 2018), perhaps even the dominant accelerators of CRs up to PeV energies (Yang et al., 2018).
A missing link in the assessment of massive stars as progenitors of Galactic CRs is the role of isolated stars, in particular those that do not belong to the runaway class. The powerful stellar winds generate strong shocks in the surrounding material as they propagate, piling it up and sculpting the environment into a stellar bubble. Both termination shocks and shocks in co-rotating interaction regions at the base of the wind are conducive for relativistic particle acceleration. However, until date no study has reported the detection of NT emission in such isolated objects. Indirect evidence of the presence of strong shocks can be gathered in X-rays, given that such shocks heat the plasma to very high temperatures. However, in stellar bubbles the turbulent mixing and thermal conduction produce gas of intermediate temperature and density, which only emits soft and diffuse X-rays as has been observed in four WR nebulae (Toalá & Arthur, 2018).
In this paper we investigate the radio emission from the stellar bubble around WR 102. Located at a distance of 2.88 kpc (Sander et al., 2018), WR 102 is a single, oxygen-rich WR star of the rare spectral type WO2. These stars represent a very short evolutionary phase of very massive stars (40–60 M⊙) and are the likely progenitors of Type Ic supernova (Tramper et al., 2015). Remarkably, these very peculiar objects (there are only four detected WO stars in our Galaxy, including WR 102) have the fastest winds with km s-1 (Polcaro et al., 1992). This fact makes WO stars excellent candidates for the search of NT emission as the wind velocity has a double impact on the NT particle distribution. On the one hand, the energy budget for NT particle acceleration depends on the wind kinetic power, which for a star with mass-loss rate is . On the other hand, under the assumption of Bohm diffusion, the rate at which relativistic particles are accelerated scales with the square of the shock (and therefore the wind) velocity (e.g. Drury, 1983). Thus, the filamentary nebula G2.4+1.4 around WR 102, with km s-1 and yr-1 (Sander et al., 2018), is an ideal target to search for NT radio emission.
The hydrodynamics of stellar bubbles are complex as the wind properties vary throughout the stellar evolution from main-sequence to the WR phase. This is evident in the complex and striking morphology seen in G2.4+1.4 in the optical, infrared and radio (Treffers & Chu, 1982; Green & Downes, 1987; Dopita et al., 1990; Goss & Lozinskaya, 1995; Toalá et al., 2015b). The ‘looped’ or ‘multi-ringed’ filamentary morphology revealed in all wavelengths points to possible interaction/collision regions.
2 Radio Observations
Low-frequency radio continuum mapping of G2.4+1.4 was carried out with the upgraded Giant Meterwave Radio Telescope (uGMRT), India. GMRT offers a hybrid, Y-shaped configuration consisting of thirty antennas. The three arms contain six antennas each and twelve antennas are placed randomly within a central, compact region of one square kilometre. The largest baseline probed with GMRT is 25 km and the shortest spacing is 100 m, providing a configuration that allows to study structures at various spatial scales. An overview of GMRT systems can be found in Swarup et al. (1991) and the details of the upgradation are presented in Gupta et al. (2017). G2.4+1.4 was observed in Band 4 ( MHz) and Band 5 ( MHz) which have better sensitivity and uv coverage compared to the Legacy narrow-band set up. Primary calibrators 3C286 and 3C48 were observed for flux and bandpass calibration. To correct for the phase and amplitude variation over the duration of the observations, phase calibrators 1822-096 (Band 4) and 1751-253 (Band 5) were observed for 5 min after each 40 min scan of the target. Standard procedures of data reduction using Astronomical Image Processing System (AIPS) were implemented to generate the continuum maps. Calibrated data in each band were split into sub-bands of bandwidth 32 MHz and carefully scrutinized to identify and flag out bad spectral channels (due to RFI) and data points (due to non-functional antennas). We retain five clean sub-bands each in Band 4 and Band 5, with central frequencies of 605, 640, 675, 710, 745 MHz and 1297, 1327, 1361, 1395, 1429 MHz, respectively. Each sub-band was imaged separately employing channel averaging and wide-field imaging technique to account for bandwidth smearing and w-term effects, respectively. While imaging, the beam in all sub-bands was matched to yield a resolution of , which helps in smoothing the maps and removing small scale statistical fluctuations, if present. Several iterations of self-calibration were carried out to correct for the phases and improve the image quality. Primary beam correction was applied to generate the final images.
G2.4+1.4 is located near the Galactic plane, whereas the flux calibrators observed are at higher Galactic latitudes. Therefore, a correction to the system temperature was required to account for the contribution from Galactic diffuse emission, which may become significant at the low frequencies of our observations. Since measurements of the variations in the system temperatures of the antennas at the GMRT are not automatically implemented during observations, correction factors were determined using the 408 MHz all-sky continuum survey of (Haslam et al., 1982) and assuming that the Galactic diffuse emission follows a power-law spectrum with a slope of (Roger et al., 1999). The correction factors lie between 1.17 and 2.08 (highest value occurring for the lowest frequency) and are used to scale the final images.
3 Nature of the radio emission
The primary focus of this study is to ascertain the nature of the radio emission in G2.4+1.4. For this, we derive the spectral index which is a key parameter that enables to decipher the underlying physics of the source and the radiation mechanism(s).
3.1 Morphology of the source
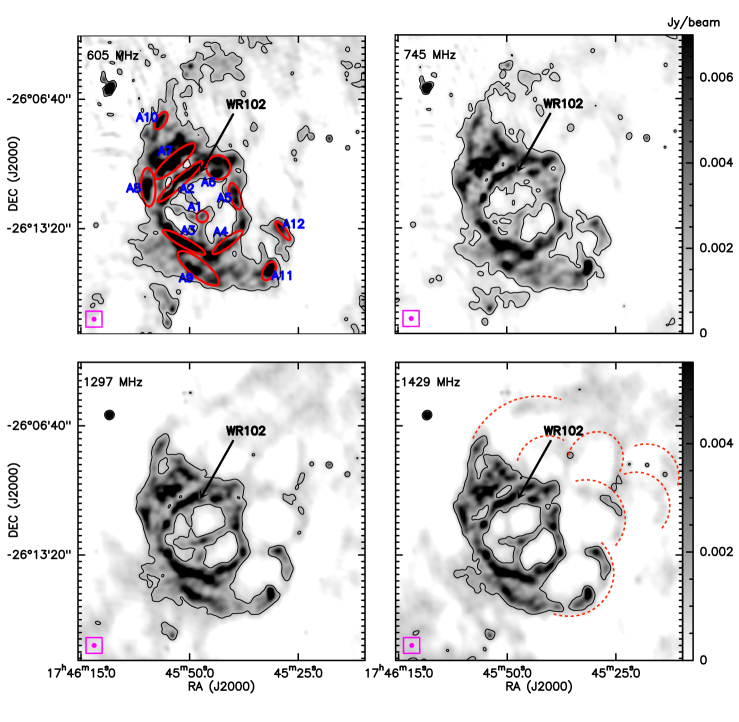
The uGMRT radio continuum maps generated in all ten sub-bands display the characteristic multi-ringed, filamentary morphology previously mentioned. Figure 1 shows two sub-bands from each Band 4 and Band 5. The maps display a central region that appears to be connected to a spherical shell via three spoke-like filaments. Beyond this, a network of loops forming an outer shell and external rims are visible. The nebula is extended in the north-west direction where faint loops are discernible in the maps and indicated in Figure 1 (1429 MHz map) with dotted red curves. Noticeable in the maps is the striking asymmetry seen in the bubble structure and the location of WR 102 that is offset from the centre.
The interesting morphology of G2.4+1.4 has been debated in previous studies. Dopita & Lozinskaia (1990) attributed the striking morphology to the presence of large scale Rayleigh-Taylor (RT) instabilities. Their hypothesis places WR 102 at the edge of a molecular cloud that stalls the expansion on one side (south-east) whereas the stellar wind inflates the bubble in the other (north-west) direction into the low-density ISM. RT instabilities arise as the expansion happens along a strong density gradient. This results in the characteristic ‘scalloping’ morphology. However, the presence of the proposed molecular cloud was not confirmed from CO observations carried out by Arnal (2008). An alternate scenario was presented by Brighenti & D’Ercole (1995a, b). These authors carried out detailed simulations and advocate for a moving central star that would adequately explain the observed morphology.
3.2 Spectral index
The spectral index is defined as , where is the flux density at frequency . Ionized gas emits thermal free-free emission with spectral index ranging from (optically thick) to (optically thin). Given that the opacity is frequency-dependent, a source can switch from being optically thick at low frequencies to optically thin at high frequencies. Moreover, the opacity is strongly dependent on the density of the medium, hence the turnover frequency can differ for different sources. In comparison, relativistic electrons emit synchrotron radiation in the radio domain with a typical intrinsic spectral index , although it could be less negative or even positive due to absorption/suppression effects (Melrose, 1980). In any case, a value of is conclusive evidence for NT emission, whereas positive values of the spectral index usually suggest a thermal source. In astrophysical sources it is most likely that a thermal plasma coexists with the relativistic population of electrons (if present), and therefore the observed spectra would have contributions from both the thermal and NT components. Nonetheless, it is possible to separate the two components by sampling the SED over a large range of frequencies. In particular, the NT emission is expected to dominate the spectra at low frequencies given that it has a negative spectral index, whereas at higher frequencies thermal radiation prevails (see e.g. De Becker, 2018). In this regard, the high-sensitivity new uGMRT data presented in this paper probes the ideal low-frequency domain appropriate to reveal unambiguous evidence of NT radiation.
3.3 Observed spectral index maps
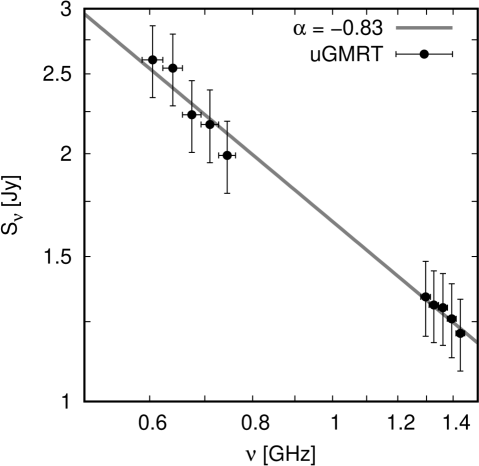
For a reliable estimate of the spectral index it is critical to ensure that same spatial scales are probed at the frequencies sampled. Given that GMRT is not a scaled array, we generate the maps in the uv range (0.164 – 49.5 k) common to all sub-bands. Flux density integrated within the contour along with the rms noise in each sub-band map are listed in Table 1. Uncertainties in the estimated flux densities are calculated using the expression from Sánchez-Monge et al. (2013), , where is the rms noise level of the map, is the error in flux scale calibration, represents the size of the beam, and is the source size. The uncertainty in the flux calibration of GMRT is taken to be (Lal & Rao, 2006). The measured flux density values yield a global spectral index of . A similar power law slope is also seen within the two bands.
| Frequency | Integrated flux density | rms noise |
|---|---|---|
| (MHz) | (Jy) | (mJy/beam) |
| 605 | 2.600.26 | 0.46 |
| 640 | 2.540.25 | 0.51 |
| 675 | 2.230.22 | 0.34 |
| 710 | 2.170.22 | 0.43 |
| 745 | 1.990.20 | 0.34 |
| 1297 | 1.340.14 | 0.44 |
| 1327 | 1.310.13 | 0.47 |
| 1361 | 1.300.13 | 0.36 |
| 1395 | 1.260.13 | 0.38 |
| 1429 | 1.210.12 | 0.49 |
To probe the variation of the spectral index across the bubble, we identify apertures and estimate the spectral index from the integrated flux density within these. Table 2 gives the estimated values which lie between and . We also construct a spectral index map of G2.4+1.4, shown in Figure 2, by retaining only those pixels with flux density values greater than ( being the rms noise of the map) in all the ten sub-band maps. The range of spectral index values seen in this map lie between and with errors typically within 0.2.
| Aperture | Spectral Index () |
|---|---|
| Central region: | |
| A1 | |
| Inner shell: | |
| A2 | |
| A3 | |
| A4 | |
| A5 | |
| A6 | |
| Outer shell: | |
| A7 | |
| A8 | |
| A9 | |
| External rims: | |
| A10 | |
| A11 | |
| A12 |
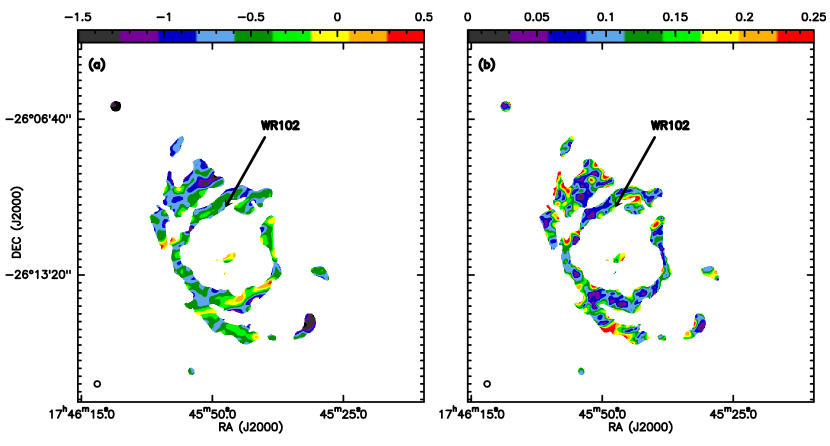
Thermal radio emission from a single stellar wind is produced by the free-free mechanism and it exhibits a spectral index (Wright & Barlow, 1975). In G2.4+1.4, the global and spatially resolved spectral index estimations are significantly lower than , which is a compelling evidence of NT emission. This enigmatic nebula has been a target of interest for over five decades. The nature of its radio emission has been debated by several authors. Goss & Shaver (1968) were the first to report the 20 cm (1.4 GHz) and 11 cm (2.7 GHz) radio observations of G2.4+1.4. These authors assumed a thermal source but did not rule out the possibility of NT emission. A more detailed study was presented by Johnson (1975), who investigated the nature of this source based on high-frequency (15.5 and 31.4 GHz) observations and flux density measurements compiled from literature. The spectrum was found to be clearly NT, and hence G2.4+1.4 was proposed to be a supernova remnant. A quantitative estimate based on the values listed in Table 1 of Johnson (1975) yields a spectral index . This conclusion was supported by Treffers & Chu (1982) based on their optical narrow-band imaging and Fabry-Perot spectroscopic observations. With additional observations at 4.86 GHz using the VLA, Green & Downes (1987) re-visited the debate and extensively discussed the possible uncertainties associated with the flux densities used by Johnson (1975). These authors did not rule out NT emission but favoured a thermal wind-blown bubble instead. G2.4+1.4 was observed as part of the Effelsberg radio continuum surveys at 1408 and 2695 MHz (Reich et al., 1984, 1990). The flux density measurements from these observations also yielded a NT spectral index of . However, in a subsequent study, Gray (1994) used MOST-843 MHz and the Effelsberg-2695 MHz and calculated , which they interpreted as optically thin free-free emission, thus negating a NT origin. Similar results were presented by Goss & Lozinskaya (1995), using MOST-843 MHz and VLA-1.49 GHz data, who propounded a thermal mass-loss bubble picture for G2.4+1.4. However, given that the claim of the thermal nature of the source was based on flux density measurements from Effelsberg, VLA, and MOST maps, different sensitivities and uv coverage would render the estimated spectral index values uncertain. The spectral index estimate from the Effelsberg data () is in close agreement with the uGMRT results () presented here, for which the flux density measurements are not affected by the above mentioned uncertainties and therefore provide high-confidence and conclusive evidence of NT emission.
From the spectral index values of the identified apertures listed in Table 2, we see a hint of softening of the spectra (i.e more negative spectral indices) as we move from the centre to the external rims of the bubble. A few scenarios could be invoked to explain this trend. One possibility could be the contamination from thermal emission in the central, denser region where the free-free emission is higher. The other picture could involve the diffusion of particles which makes the particle energy distribution softer and therefore the spectral index values more negative. Further studies involving detailed modelling are necessary before one can conclusively interpret the observed trend.
4 Non-thermal radiative model
The value of the magnetic field strength in the emitter and its energetics are encoded in the observed SED. Despite this, it is not possible to disentangle such unknowns if only radio data is available. However, we can infer (or at least constrain) them via rather simple and reliable modelling. We develop a one-zone model to estimate the magnetic field of the stellar bubble associated with G2.4+1.4. The model is based on the approach discussed in del Palacio et al. (2018) for stellar bow shocks and is globally consistent with the standard procedure for estimating magnetic fields in NT sources (e.g. Rybicki & Lightman, 1979; Longair, 1992; De Becker, 2018). Here, the detailed structure of the synchrotron emitter is neglected and it is considered to be homogeneous. Since G2.4+1.4 has a nearly spherical morphology, we assume a spherical synchrotron emitting volume of radius ( pc at a distance of 2.88 kpc). We note, nonetheless, that the exact shape and volume of the region do not have a strong impact in the results (e.g. De Becker, 2018).
Charged relativistic particles moving in the presence of a magnetic field emit synchrotron radiation. This process is much more efficient for electrons than for protons, so hereafter we refer only to electron synchrotron radiation. The same observed synchrotron luminosity can be achieved either by a less energetic electron population in a strong magnetic field or by more energetic electrons in a weak magnetic field. To account for this degeneracy between the amount of energy injected into NT particles and the intensity of the magnetic field, we introduce two parameters in the model related to how the energy is distributed between the magnetic field and the different species of relativistic particles111Alternatively, one can define , which is equivalent to (e.g. De Becker, 2018).:
| (1) | ||||
| (2) |
where , and are the energy densities in the magnetic field, NT electrons and NT protons, respectively, and . We adopt a value of , consistent with DSA (see Merten et al., 2017, and references therein for a discussion on electron-to-ion luminosity ratios). Considering that the relativistic electron energy distribution is given by , we have:
| (3) |
where is the emitter volume. In order to calculate the particle energy distribution, , in a self-consistent fashion, we solve the transport equation for a stationary and homogeneous emitter.
First, we have to characterize the injected particle distribution, . Different particle acceleration mechanisms, including DSA, inject relativistic particles with a power-law distribution, , where is a normalization constant, is the distribution spectral index, and is the cutoff energy. The value of can be derived from the radio spectral index () as . The value of is given by the balance between energy gain and loss processes, and it is obtained by equating the characteristic acceleration and synchrotron times, as the latter completely dominates the energy losses for high-energy particles in this scenario. The acceleration time is s, with the elementary charge and the acceleration efficiency, taken as in the Bohm diffusion regime (though different values of this parameter related to uncertainties in the actual diffusion coefficient are also possible, Drury, 1983).
The normalization constant is obtained from the condition , where and are set to 1 MeV and , respectively, and is the power injected in relativistic particles. The latter is taken as a fraction of the total kinetic power in the stellar wind,
| (4) |
such that . The value of gives an idea of how efficiently energy is converted to NT particles. For example, typical values of are found in the literature for supernova remnants (Dorfi & Drury, 1985; Reynolds, 2011).
In a stationary scenario, as it is the case with G2.4+1.4 (at least for timescales of years), the solution to the transport equation for an injected electron distribution under radiative cooling (dominated by synchrotron losses) and non-radiative cooling (mechanical work exerted to the surrounding medium, often referred to as adiabatic losses) can be calculated as
| (5) |
where represents the total (radiative plus non-radiative) energy losses. The synchrotron cooling time, , can be calculated precisely, whereas the characteristic adiabatic loss time is approximately , with pc the characteristic size of the bubble.
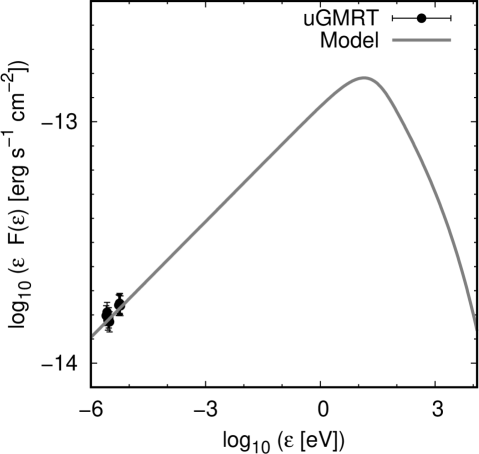
Given that we have only two free parameters in our model, we explore physically plausible values for in the range 0.01 (strong magnetic field) to 10 (weak magnetic field) and obtain the corresponding value for that matches the observed fluxes. We calculate the synchrotron spectrum using the standard (approximated) expressions for electron emission in random magnetic fields (e.g. Melrose, 1980). For the extreme case of we obtain G and erg s-1 (), whereas for we obtain G and erg s-1 (). A representative value of , which corresponds to a minimum energy condition in the emitter, yields G and erg s-1 (). In Figure 3 we show an example of the spectral fit for this case, which also allows to infer the possible X-ray flux due to the high end of the synchrotron spectrum. The expected X-ray flux in the 0.3–10 keV energy band is of the order of erg s-1 cm-2, though this value is very sensitive to uncertainties in the model such as spatial variations of the spectral index. Moreover, we note that thermal emission is also expected in the X-ray domain given the presence of shock-heated gas (Toalá et al., 2015a; Toalá & Arthur, 2018).
5 Conclusions
We report the first detection of non-thermal radiation from a single stellar bubble. This finding constitutes an observational breakthrough which gives new insight on the non-thermal physical processes taking place in the environments of isolated massive stars. In particular, this proves that non-runaway isolated massive stars are in fact capable of accelerating relativistic particles and are therefore confirmed as sources of Galactic cosmic rays. Nonetheless, their efficiency as cosmic ray accelerators is poorly constrained. We estimated the average magnetic field strength in the synchrotron emitting region using a model that relies in simple and general energy density partition considerations. Such a model suggests that the fraction of the available kinetic wind power that is converted into non-thermal particle acceleration is of the order of a few per cent. Future works devoted to a detailed modelling of the acceleration of cosmic rays in the termination shocks of stellar winds and their broadband emission will allow to place tighter constraints to this value.
6 Acknowledgments
We thank the referee for useful suggestions. We thank the staff of the GMRT, who made these observations possible. GMRT is run by the National Centre for Radio Astrophysics of the Tata Institute of Fundamental Research. S.d.P. acknowledges financial support from CONICET (PIP 2014-00338) and thanks V. Bosch-Ramon for fruitful discussions.
References
- Arnal (2008) Arnal, E. M. 2008, in Revista Mexicana de Astronomia y Astrofisica Conference Series, Vol. 33, Revista Mexicana de Astronomia y Astrofisica Conference Series, 140–141
- Benaglia et al. (2010) Benaglia, P., Romero, G. E., Martí, J., Peri, C. S., & Araudo, A. T. 2010, A&A, 517, L10, doi: 10.1051/0004-6361/201015232
- Brighenti & D’Ercole (1995a) Brighenti, F., & D’Ercole, A. 1995a, in IAU Symposium, Vol. 163, Wolf-Rayet Stars: Binaries; Colliding Winds; Evolution, ed. K. A. van der Hucht & P. M. Williams, 70
- Brighenti & D’Ercole (1995b) Brighenti, F., & D’Ercole, A. 1995b, MNRAS, 273, 443, doi: 10.1093/mnras/273.2.443
- De Becker (2007) De Becker, M. 2007, A&A Rev., 14, 171, doi: 10.1007/s00159-007-0005-2
- De Becker (2018) —. 2018, A&A, 620, A144, doi: 10.1051/0004-6361/201834101
- De Becker & Raucq (2013) De Becker, M., & Raucq, F. 2013, A&A, 558, A28, doi: 10.1051/0004-6361/201322074
- De Becker et al. (2006) De Becker, M., Rauw, G., Sana, H., et al. 2006, MNRAS, 371, 1280, doi: 10.1111/j.1365-2966.2006.10746.x
- del Palacio et al. (2018) del Palacio, S., Bosch-Ramon, V., Müller, A. L., & Romero, G. E. 2018, A&A, 617, A13, doi: 10.1051/0004-6361/201833321
- del Valle & Romero (2012) del Valle, M. V., & Romero, G. E. 2012, A&A, 543, A56, doi: 10.1051/0004-6361/201218937
- del Valle & Romero (2014) —. 2014, A&A, 563, A96, doi: 10.1051/0004-6361/201322308
- Dopita & Lozinskaia (1990) Dopita, M. A., & Lozinskaia, T. A. 1990, ApJ, 359, 419, doi: 10.1086/169074
- Dopita et al. (1990) Dopita, M. A., Lozinskaia, T. A., McGregor, P. J., & Rawlings, S. J. 1990, ApJ, 351, 563, doi: 10.1086/168493
- Dorfi & Drury (1985) Dorfi, E. A., & Drury, L. O. 1985, International Cosmic Ray Conference, 3
- Dougherty & Williams (2000) Dougherty, S. M., & Williams, P. M. 2000, MNRAS, 319, 1005, doi: 10.1046/j.1365-8711.2000.03837.x
- Drury (1983) Drury, L. O. 1983, Reports on Progress in Physics, 46, 973, doi: 10.1088/0034-4885/46/8/002
- Dubner & Giacani (2015) Dubner, G., & Giacani, E. 2015, A&A Rev., 23, 3, doi: 10.1007/s00159-015-0083-5
- Eichler & Usov (1993) Eichler, D., & Usov, V. 1993, ApJ, 402, 271, doi: 10.1086/172130
- Goss & Lozinskaya (1995) Goss, W. M., & Lozinskaya, T. A. 1995, ApJ, 439, 637, doi: 10.1086/175203
- Goss & Shaver (1968) Goss, W. M., & Shaver, P. A. 1968, ApJ, 154, L75, doi: 10.1086/180273
- Gray (1994) Gray, A. D. 1994, MNRAS, 270, 835, doi: 10.1093/mnras/270.4.835
- Green & Downes (1987) Green, D. A., & Downes, A. J. B. 1987, MNRAS, 225, 221, doi: 10.1093/mnras/225.2.221
- Gupta et al. (2017) Gupta, Y., Ajithkumar, B., Kale, H., et al. 2017, Current Science, 113, 707, doi: 10.18520/cs/v113/i04/707-714
- Haslam et al. (1982) Haslam, C. G. T., Salter, C. J., Stoffel, H., & Wilson, W. E. 1982, A&AS, 47, 1
- Johnson (1975) Johnson, H. M. 1975, ApJ, 198, 111, doi: 10.1086/153581
- Lal & Rao (2006) Lal, D. V., & Rao, A. P. 2006, Monthly Notices of the Royal Astronomical Society, 374, 1085, doi: 10.1111/j.1365-2966.2006.11225.x
- Longair (1992) Longair, M. S. 1992, High energy astrophysics. Vol.1: Particles, photons and their detection, 436
- Melrose (1980) Melrose, D. B. 1980, Plasma astrohysics. Nonthermal processes in diffuse magnetized plasmas - Vol.1: The emission, absorption and transfer of waves in plasmas; Vol.2: Astrophysical applications
- Merten et al. (2017) Merten, L., Becker Tjus, J., Eichmann, B., & Dettmar, R.-J. 2017, Astropart. Phys., 90, 75, doi: 10.1016/j.astropartphys.2017.02.007
- Mirabel & Rodríguez (1994) Mirabel, I. F., & Rodríguez, L. F. 1994, Nature, 371, 46, doi: 10.1038/371046a0
- Polcaro et al. (1992) Polcaro, V. F., Viotti, R., Rossi, C., & Norci, L. 1992, A&A, 265, 563
- Reich et al. (1984) Reich, W., Fuerst, E., Haslam, C. G. T., Steffen, P., & Reif, K. 1984, A&AS, 58, 197
- Reich et al. (1990) Reich, W., Fuerst, E., Reich, P., & Reif, K. 1990, A&AS, 85, 633
- Reynolds (2011) Reynolds, S. P. 2011, Ap&SS, 336, 257, doi: 10.1007/s10509-010-0559-8
- Rodríguez-Kamenetzky et al. (2019) Rodríguez-Kamenetzky, A., Carrasco-González, C., González-Martín, O., et al. 2019, MNRAS, 482, 4687, doi: 10.1093/mnras/sty3055
- Roger et al. (1999) Roger, R. S., Costain, C. H., Landecker, T. L., & Swerdlyk, C. M. 1999, A&AS, 137, 7, doi: 10.1051/aas:1999239
- Rybicki & Lightman (1979) Rybicki, G. B., & Lightman, A. P. 1979, Radiative processes in astrophysics
- Sánchez-Monge et al. (2013) Sánchez-Monge, Á., Kurtz, S., Palau, A., et al. 2013, ApJ, 766, 114, doi: 10.1088/0004-637X/766/2/114
- Sander et al. (2018) Sander, A. A. C., Hamann, W.-R., Todt, H., et al. 2018, ArXiv e-prints. https://arxiv.org/abs/1807.04293
- Seo et al. (2018) Seo, J., Kang, H., & Ryu, D. 2018, Journal of Korean Astronomical Society, 51, 37, doi: 10.5303/JKAS.2018.51.2.37
- Swarup et al. (1991) Swarup, G., Ananthakrishnan, S., Kapahi, V. K., et al. 1991, Current Science, Vol. 60, NO.2/JAN25, P. 95, 1991, 60, 95
- Toalá & Arthur (2018) Toalá, J. A., & Arthur, S. J. 2018, MNRAS, 478, 1218, doi: 10.1093/mnras/sty1127
- Toalá et al. (2015a) Toalá, J. A., Guerrero, M. A., Chu, Y. H., Arthur, S. J., & Gruendl, R. A. 2015a, in Wolf-Rayet Stars: Proceedings of an International Workshop held in Potsdam, 333–336. https://arxiv.org/abs/1511.00861
- Toalá et al. (2015b) Toalá, J. A., Guerrero, M. A., Ramos-Larios, G., & Guzmán, V. 2015b, A&A, 578, A66, doi: 10.1051/0004-6361/201525706
- Tramper et al. (2015) Tramper, F., Straal, S. M., Gräfener, G., et al. 2015, in IAU Symposium, Vol. 307, New Windows on Massive Stars, ed. G. Meynet, C. Georgy, J. Groh, & P. Stee, 144–145, doi: 10.1017/S1743921314006590
- Treffers & Chu (1982) Treffers, R. R., & Chu, Y.-H. 1982, ApJ, 254, 132, doi: 10.1086/159715
- Vig et al. (2018) Vig, S., Veena, V. S., Mandal, S., Tej, A., & Ghosh, S. K. 2018, MNRAS, 474, 3808, doi: 10.1093/mnras/stx3032
- Wright & Barlow (1975) Wright, A. E., & Barlow, M. J. 1975, MNRAS, 170, 41, doi: 10.1093/mnras/170.1.41
- Yang et al. (2018) Yang, R.-z., de Oña Wilhelmi, E., & Aharonian, F. 2018, A&A, 611, A77, doi: 10.1051/0004-6361/201732045