How much graphene in space?
Abstract
The possible presence of graphene in the interstellar medium (ISM) is examined by comparing the interstellar extinction curve with the ultraviolet absorption of graphene calculated from its dielectric functions experimentally obtained with the electron energy loss spectroscopy (EELS) method. Based on the absence in the interstellar extinction curve of the 2755 – electronic interband transition of graphene, we place an upper limit of 20 of C/H on the interstellar graphene abundance, exceeding the previous estimate by a factor of 3 which made use of the dielectric functions measured with the spectroscopic ellipsometry (SE) method. Compared with the SE method which measures graphene in air (and hence its surface is contaminated) in a limited energy range of 0.7–5, the EELS probes a much wider energy range of 0–50 and is free of contamination. The fact that the EELS dielectric functions are substantially smaller than that of SE naturally explains why a higher upper limit on the graphene abundance is derived with EELS. Inspired by the possible detection of C24, a planar graphene sheet, in several Galactic and extragalactic planetary nebulae, we also examine the possible presence of C24 in the diffuse ISM by comparing the model IR emission of C24 with the observed IR emission of the Galactic cirrus and the diffuse ISM toward and . An upper limit of 20 on C24 is also derived from the absence of the characteristic vibrational bands of C24 at 6.6, 9.8 and 20 in the observed IR emission.
keywords:
dust, extinction – infrared: ISM – ISM: lines and bands — ISM: molecules1 Introduction
As the 4th most abundant element in the universe, carbon (C) is widespread in the interstellar medium (ISM) in various allotropic forms (e.g., see Henning & Salama 1998), including graphite (Groopman & Nittler 2018), nanodiamonds (Lewis et al. 1987, Allamandola et al. 1992, Guillois et al. 1999, van Kerckhoven et al. 2002, Shimonish et al. 2016), fullerene (Cami et al. 2010, Sellgren et al. 2010, García-Hernández et al. 2010, Zhang & Kwok 2011, Berné et al. 2013, Strelnikov et al. 2015, Berné et al. 2017), amorphous carbon and hydrogenated amorphous carbon (Wickramasinghe & Allen 1980, Sandford et al. 1991, Pendleton et al. 1994, Greenberg et al. 1995, Whittet et al. 1997, Furton et al. 1999, Pendleton & Allamandola 2002, Duley et al. 2005, Dartois et al. 2007, Chiar et al. 2013, Maté et al. 2016 Günay et al. 2018), and planar polycyclic aromatic hydrocarbons (PAHs; Léger & Puget 1984, Allamandola et al. 1985). Carbon buckyonions, composed of spherical concentric fullerene shells, are also postulated to be present in the ISM (Chhowalla et al. 2003, Iglesias-Groth et al. 2003, Ruiz et al. 2005, Li et al. 2008, Qi et al. 2018). The presence of various carbon allotropes in the ISM is revealed either through their fingerprint ultraviolet (UV) and/or infrared (IR) absorption or emission spectral features. Their presence in the ISM is also revealed through isotope analysis of primitive meteorites as presolar grains of interstellar origin. Although the interstellar C abundance is not accurately known, it is generally believed that in the ISM 40–60% of the interstellar C must have been tied up in these carbon allotropes (see Mishra & Li 2015, 2017).
Graphene, a novel material experimentally synthesized by A.K. Geim and K.S. Novoselov (see Novoselov et al. 2004, but also see Henning et al. 2004), was first shown by García-Hernández et al. (2011b, 2012) to be possibly present in the ISM based on the detection of the unusual IR emission features at 6.6, 9.8, and 20 in several planetary nebulae (PNe), both in the Milky Way and in the Magellanic Clouds, which are coincident with the strongest transitions of planar C24, a piece of graphene. Chen et al. (2017) argued that, in principle, graphene could be present in the ISM as it could be formed from the photochemical processing of PAHs, which are abundant in the ISM, through a complete loss of their H atoms (e.g., see Berné & Tielens 2012). Chuvilin et al. (2010) showed experimentally that C60 could be formed from a graphene sheet. Berné & Tielens (2012) further proposed that such a formation route of converting PAHs into graphene and subsequently C60 could occur in space, in the presence of UV irradiation. More recently, Sarre (2019) suggested that graphene oxide nanoparticles could be present in the ISM and their photoluminescence could explain the widespread extended red emission (ERE), a broad, featureless emission band between 5400 and 9500 (see Witt & Vijh 2004, Witt 2014, Lai et al. 2017).
Based on the dieletric functions measured in the wavelength range of 245–1700 nm (corresponding to 0.7–5 eV) by Nelson et al. (2010) for large-area polycrystalline chemical vapor deposited (CVD) graphene, Chen et al. (2017) calculated the absorption of graphene from the UV to the near-IR. By comparing the calculated absorption of graphene with the observed interstellar extinction, they found that as much as 5 of C/H could be tied up in graphene without violating the observational constraints on the interstellar extinction and IR emission.
However, the dielectric functions of graphene of Nelson et al. (2010) were derived from the spectroscopic ellipsometry (SE) method in which the CVD graphene was exposed to air and the majority of its surface was covered with adsorbates and contamination. In order to discern the composition of the adsorbates and contamination, Nelson (2012) performed an electron energy loss spectroscopy (EELS) measurement of the graphene sample over the core-loss energy region (i.e., hundreds of eV) which detects inner-shell ionizations on the order of the atoms’s binding energies. It was found that the EELS core-loss spectra show the presence of oxygen, calcium and iron from exposure to the environment and the copper etchant/deionized water-based transfer process.111In the chemical vapor deposition of graphene of Nelson et al. (2010), a hydrocarbon precursor (methane) was delivered under low pressure to a copper foil for deposition. The CVD graphene was then transfered to a secondary SiO2/Si glass substrate. The graphene transfer process consisted of applying a thermal release tape to the graphene on copper foil, etching away the foil in an aqueous solution of iron chloride, and applying the graphene+tape to the substrate.
In contrast, the EELS method enables the isolation of the spectroscopy to a freely suspended area without contamination and therefore allows one to measure the dielectric functions of perfectly clean graphene. In EELS, inelastically scattered electrons are collected that have undergone Coulomb interaction with the atomic electrons of the sample and have been scattered to much smaller angles (on the oder of mrad). The EELS over the low-loss region (0–50 eV) detects energy losses that are the result of plasmons, interband transitions and intraband transitions. In comparison to the energy range probed by SE, EELS extends this range by 6–10 times, depending on the bandwidth of the light source used in a comparative optical technique.
Nelson et al. (2014) measured the EELS of monolayer CVD graphene in the low-loss energy region. They found that the EELS dielectric functions of graphene in the UV and optical are substantially smaller than those measured by Nelson et al. (2010) in terms of the SE technique. Since the UV/optical absorption of graphene sensitively depends on its dielectric function, a smaller dielectric function would lead to a lower UV/optical absorption level (on a per unit mass basis). By implication, it would also result in a smaller amount of thermal emission in the IR because of the energy balance between absorption and emission. Therefore, the detection (or nondetection) of any fingerprint spectral features characteristic of graphene in the UV and IR would imply a larger amount of graphene in the interstellar space, or place a higher upper limit in the case of nondetection. In this work, we re-visit the possible presence of graphene in the ISM by applying the EELS-measured dielectric functions of graphene of Nelson et al. (2014) and confronting the model extinction (§2) and emission (§3) with the observed interstellar extinction curve and IR emission. The major results are summarized in §4.
2 Extinction
If we approximate a 2-dimensional graphene monolayer as a very flat oblate (“pancake”), in the Rayleigh regime the absorption cross section at wavelength per unit volume () is
| (1) |
where is the complex dielectric function in the graphene plane,222For a graphene monolayer, the dielectric function along the c-axis perpendicular to the graphene plane is close to 1 in the wavelength range of interest here (see Nelson et al. 2014). Therefore, the contribution to by the dielectric function along the c-axis is negligible. is the depolarization factor for the electric field vector along the graphene plane, and denotes the imaginary part of a complex function (see eq. 3.40 of Krügel 2003). By relating the graphene volume to , the number of C atoms contained in the graphene sheet (see eq. 4 of Chen at al. 2017), we calculate from as follows:
| (2) |
where is the mass of a hydrogen nuclei, is the monolayer thickness of graphene, and is the surface mass density of graphene.
While Chen et al. (2017) adopted the SE-measured dielectric functions of Nelson et al. (2010), in this work we will use the EELS-measured dielectric functions of Nelson et al. (2014).333When deducing dielectric functions from the experimental energy loss sepctrum of graphene, Nelson et al. (2014) treated graphene as isotropic, although it is surely anisotropic. However, as shown by the theoretical energy loss spectrum of Nelson et al. (2014) calculated from first-principles methods based on density functional theory (DFT), the experimental spectrum is dominated almost entirely by electronic excitations with momentum transfer parallel to the basal plane, i.e., the graphene layer (see the lower panel of Figure 3b in Nelson et al. 2014). The imaginary parts of the DFT-calculated dielectric functions along the “c-axis” (which is normal to the basal plane) are negligible at 10 compared to that along the basal plane. As mentioned in §1, the graphene film measured with SE was exposed to air and the majority of its surface was covered with adsorbates and contamination that would affect the measurement of its optical properties (see Nelson 2012). In contrast, the EELS method could allow one to localize the measurement to an area that is free of contamination or the effects of a substrate. In this way the EELS technique could give a purer dielectric response than an optical measurement like SE in terms of completely isolating the graphene monolayer.
Also, while the SE method measures the dielectric functions of graphene in the energy range of 0.7–5 (which corresponds to a wavelength range of or ), the EELS method probes a much wider energy range at 0–50 (i.e., or ). The EELS dielectric functions are astrophysically more relevant since the Galactic interstellar extinction curve spans a wavelength range much wider than that probed by SE but well within that of EELS. As demonstrated in Chen et al. (2017), to facilitate a direct comparison of the absorption of graphene with the interstellar extinction curve, an extrapolation of the SE-measured dielectric functions (Nelson et al. 2010) over a wide wavelength range was made by fitting the SE-measured dielectric functions with three Lorentz oscillators. A major advantage of the EELS method over SE is that no extrapolation is needed for the EELS-measured dielectric functions.
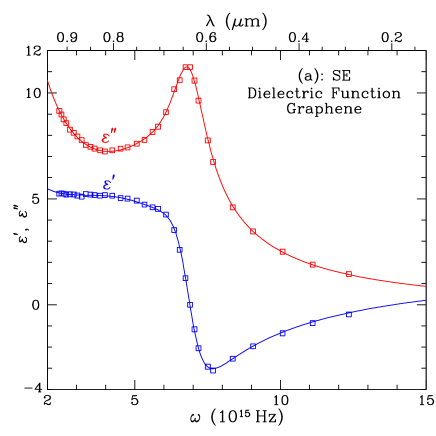
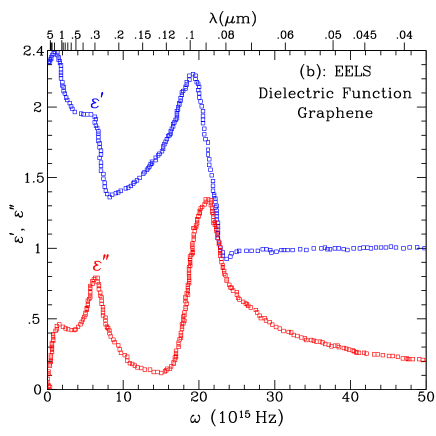
A comparison of the SE vs. EELS dielectric functions is shown in Figure 1. Most notably, both the real () and imaginary () parts of the EELS dielectric functions are substantially lower than that of SE.444For , it is actually , the absolute value of SE that always exceeds that of EELS since beccomes negative at some wavelengths. The difference between the SE and EELS dielectric functions of graphene clearly demonstrates that the presence of surface contamination in the SE method (due to measurement in air) could considerably affect the measurement of its optical properties. We also note that, as shown in Nelson et al. (2014), the experimentally measured EELS spectrum of graphene closely agrees with that calculated from the two-dimensional hydrodynamic model of Jovanovic et al. (2011).
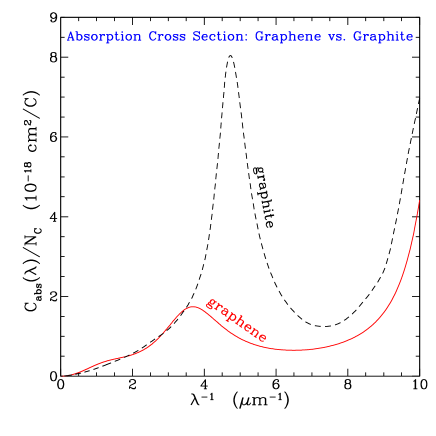
In Figure 2 we show the UV/optical absorption cross section (per C atom) of graphene which exhibits a gradual increase from the near-IR through the visible to the near-UV and a prominent absorption band peaking at 4.5 (i.e, , ), followed by a relatively flat plateau at 6–8 and a steep rise at . The – electronic interband transition peak at 4.5 has been predicted by quantum-chemical calculations (see Yang et al. 2009, Trevisanutto et al. 2010) and seen in the SE spectrum of the CVD graphene (Nelson et al. 2010). While it was previously ascribed to plasmons, Nelson et al. (2014) attributed it to single-particle interband excitations. Also shown in Figure 2 is the extinction cross section of a graphite nano particle of calculated from Mie theory (Bohren & Huffman 1983) using the dielectric functions of “astronomical graphite” of Draine & Lee (1984).555Nano-sized graphite grains are in the Rayleigh regime even in the far-UV wavelength range . Hence the extinction is dominated by absorption while the scattering is negligible (see Bohren & Huffman 1983). At , the absorption cross section (per unit mass) of graphene agrees remarkably well with that of graphite. The major difference lies at : while graphene peaks at 2755, graphite exhibits a prominent absorption peak at 2175 (i.e., 4.60).666It is interesting to note that the absorption cross sections of graphite calculated from the dielectric functions newly compiled by Draine (2016) for the electric field vector parallel to the c-axis also exhibit an absorption band at 2755 (see Figure 10 of Draine 2016).
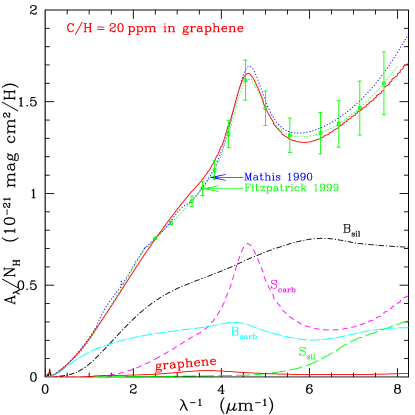
As shown in Figure 3, the Galactic extinction curve exhibits a strong absorption band at 2175 but lacks any spectral features around 2755. As demonstrated in Chen et al. (2017), the nondetection of the 2755 absorption feature in the extinction curve allows us to place an upper limit on the abundance of graphene in the ISM. Following Chen et al. (2017), we achieve this by adding graphene to the silicate-graphite-PAH model of Weingartner & Draine (2001) and Li & Draine (2001b) which reproduces both the observed interstellar extinction curve and the observed IR emission. Let be the amount of C (relative to H) tied up in graphene. The extinction results from graphene of a quantity of is
| (3) |
As shown in Figure 3, the maximum amount of graphene allowable in the ISM is derived by requiring the graphene-added model extinction not to exceed the observational uncertainties of the Galatcic interstellar extinction curve (Mathis 1990, Fitzpatrick 1999). In this way, we estimate the upper bound to be , corresponding to 7% of the total interstellar C, if the interstellar C abundance is solar (i.e., C/H 26931, Asplund et al. 2009). We note that the upper limit of 20 derived here is higher by a factor of 3 than that of Chen et al. (2017). This is expected since the dielectric functions of graphene adopted here were measured with EELS for clean graphene, while Chen et al. (2017) adopted the dielectric functions of contaminated graphene measured with SE in air. As shown in Figure 1, the former are considerably smaller than the latter. We note that, as shown in eq. 2, the UV/optical absorption (per unit mass) of graphene linearly increases with , the imaginary parts of the dielectric functions of graphene.
3 Emission
Graphene, if indeed present in the ISM, would absorb UV/optical stellar photons and re-radiate the absorbed photon energy in the IR. Therefore, graphene could also reveal its presence in the ISM through its characteristic C–C vibrational bands. Indeed, C24, a small graphene sheet, has been possibly detected in several Galactic and extragalactic PNe (García-Hernández et al. 2011a, 2012) and even in the ISM (Berné et al. 2013) through its characteristic bands at 6.6, 9.8 and 20. Chen et al. (2017) modeled the vibrational excitation and radiative relaxation of C24 in two interstellar regions — the high Galactic-latitude cirrus and the diffuse ISM toward , . The former is illuminated by the solar neighbourhood interstellar radiation field (ISRF) estimated by Mathis et al. (1983; hereafter MMP83). The starlight in the latter region can also be approximated by the solar neighbourhood ISRF but with an intensity twice as that of MMP83 (see Li & Draine 2001b).
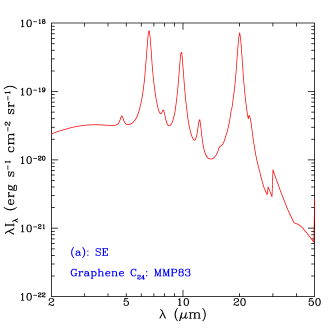
Using the UV/optical absorption cross section derived from the SE dielectric functions of Nelson et al. (2010), Chen et al. (2017) calculated the IR emission spectrum of C24 excited by the MMP83 ISRF. As illustrated in Figure 4a, the 6.6, 9.8 and 20 features are prominent in the model emission spectrum of C24. However, these emission features are neither seen in the Galactic cirrus nor in the diffuse ISM toward , . Chen et al. (2017) found that the nondetection of the fingerprint bands of C24 at 6.6, 9.8 and 20 is consistent with an upper limit of 5 of C24 in these regions.
As discussed in §2, the true UV/optical absorption of graphene would be considerably weaker than that derived in Chen et al. (2017). By implication, graphene would emit much less (on a per unit mass basis) compared to that calculated by Chen et al. (2017). Therefore, we expect to derive a higher upper limit on the abundance of C24 from the nondetection of the C24 bands at 6.6, 9.8 and 20 in the Galactic cirrus and in the diffuse ISM toward , .
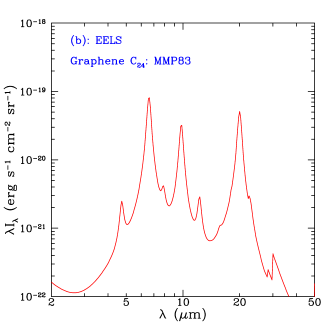
Following Chen et al. (2017), we employ the “exact-statistical” method developed by Draine & Li (2001) to model the stochastic heating of C24.777For a planar graphene of several hundred C atoms or smaller, its energy content is often smaller than the energy of a single UV/optical stellar photon. Therefore, graphene will not attain an equilibrium temperature but undergo stochastic heating in the ISM (Greenberg 1968). We use the vibrational modes and intensities of the C24 graphene obtained by Martin et al. (1996) and Kuzmin & Duley (2011) from DFT-based quantum-chemical computations. Due to lack of data on the UV/optical absorption of C24, we adopt that of graphene derived from the EELS-measured dielectric functions (see Figure 2), although the actual absorption spectrum of C24 may not be as smooth as the EELS-derived data and may have strong, sharp individual UV absorption features. For illustration, we show in Figure 4b the model emission spectrum of C24 excited by the MMP83 ISRF. As expected, the model emission intensity of C24 calculated here is substantially lower than that of Chen et al. (2017).
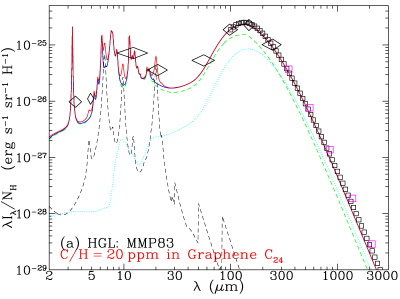
Similar to Chen et al. (2017), we also derive upper limits on the abundance of the graphene C24 in the Galactic cirrus and in the diffuse ISM toward , based on comparison of the observed IR emission with the calculated emission spectrum of C24. For the Galactic cirrus, the average emission per H has been measured by COBE/DIRBE (Arendt et al. 1998), COBE/FIRAS (Finkbeiner et al. 1999), and Planck (Planck Collaboration XVII 2014). The diffuse ISM toward , has been observed by COBE/DIRBE (Hauser et al. 1998). The Mid-Infrared Spectrograph (MIRS) aboard the Infrared Telescope in Space (IRTS) has also obtained the 4.7–11.7 spectrum for the diffuse ISM toward , (Onaka et al. 1996). As shown in Figure 5a, even locking up 20 of C/H — the upper limit of graphene derived from the interstellar extinction — all in the specific graphene species C24, the 6.6, 9.8 and 20 emission features of C24 would still be hidden by the PAH features at 6.2, 7.7, 8.6 and 11.3 and would remain undetected by Spitzer or by the Short Wavelength Spectrometer (SWS) aboard the Infrared Space Observatory (ISO). This is also true for the diffuse ISM toward , . As illustrated in Figure 5b, as much as 20 of C/H could also be tied up in the C24 graphene while the characteristic 6.6, 9.8 and 20 emission features of C24 are still not strong enough to be detected by IRTS. Therefore, for both the Galactic cirrus and the line of sight toward , , a upper limit of C/H 20 is imposed by the COBE/DIRBE photometric data and the IRTS spectrum. Nevertheless, the actual abundance of C24 could be much lower than 20 since, if graphene is indeed present in the ISM, it could span a wide range of sizes and charging states.
4 Summary
We have explored the possible presence of graphene in the diffuse ISM based on the dielectric functions of graphene recently measured with the EELS method. Our principal results are as follows:
-
1.
Using the EELS dielectric functions of graphene, we have calculated its UV/optical absorption and compared it with the observed interstellar extinction curve.
-
2.
Based on the absence of the 2755 – electronic absorption band of graphene in the interstellar extinction curve, we have placed an upper limit of 20 of C/H (i.e., 7% of the total interstellar C) on the interstellar graphene abundance.
-
3.
The upper limit of 20 of C/H on graphene derived here with the EELS dielectric functions exceeds the previous SE-based estimate by a factor of 3. This is because the SE method measures the dielectric functions of graphene exposed to air and the majority of its surface would be covered with adsorbates and contamination, while the EELS method localizes the measurement to an area that is free of contamination. As a result, the EELS dielectric functions are substantially smaller than the SE dielectric functions and thus the UV/optical absorption of graphene (on a per unit mass basis) calculated here using the EELS dielectric functions is considerably smaller than that of SE.
-
4.
Inspired by the possible detection of the 6.6, 9.8 and 20 emission features of the C24 graphene in several Galactic and extragalactic PNe, we have also explored the possible presence of this specific graphene species in two interstellar regions — the high Galactic latitude cirrus and the diffuse ISM toward , — by modeling the vibrational excitation and radiative emission processes of C24. Using the EELS dielectric functions of graphene to calculate the UV/optical absorption of C24, we have found that as much as 20 of C/H could be tied up in C24 while the 6.6, 9.8 and 20 emission features of C24 would remain undetected in these two interstellar regions by IRTS, ISO/SWS, or Spitzer.
-
5.
We note that the true interstellar abundance of C24 could be much lower than 20 since, if graphene is indeed present in the ISM, it could span a wide range of sizes and charging states. We call for further quantum-chemical computations and experimental measurements of the IR vibrational spectra of graphene of a wide range of sizes and their cationic as well as anionic counterparts.
Acknowledgements
We thank X.H Chen, A. Diebold, B.T. Draine, W.W. Duley, Th. Hening, C. Jäger, S. Kuzmin, S.K. Madhulika, L. Yang and the anonymous referee for very helpful discussions and suggestions. This work is supported by NSFC through Projects 11533002 and 11873041. AL is supported in part by NSF AST-1816411.
References
- [] Allamandola, L.J., Tielens, A.G.G.M., & Barker, J.R. 1985, ApJ, 290, L25
- [] Allamandola, L.J., Tielens, A.G.G.M., & Barker, J.R. 1989, ApJS, 71, 733
- [] Allamandola, L.J., Sandford, S.A., Tielens, A.G.G.M., & Herbst, T.M. 1992, ApJ, 399, 134
- [] Arendt, R. G., Odegard, N., Weiland, J. L., et al. 1998, ApJ, 508, 74
- [] Asplund, M., Grevesse, N., Sauval, A. J., & Scott, P. 2009, ARA&A, 47, 481
- [] Berné, O, & Tielens, A.G.G.M. 2012, PNAS, 109, 401
- [] Berné, O., Mulas, G., & Joblin, C. 2013, A&A, 550, L4
- [] Berné, O., Cox, N. L. J., Mulas, G., & Joblin, C. 2017, A&A, 605, L1
- [] Bernstein, L. S., Shroll, R. M., Lynch, D. K., & Clark, F. O. 2017, ApJ, 836, 229
- [] Bohren, C.F., & Huffman, D.R. 1983, Absorption and Scattering of Light by Small Particles, Wiley, New York
- [] Cami, J., Bernard-Salas, J., Peeters, E., & Malek, S. E. 2010, Science, 329, 1180
- [] Chen, X.H., Li, A., & Zhang, K. 2017, ApJ, 850, 104
- [] Chiar, J. E., Tielens, A. G. G. M., Adamson, A. J., et al. 2013, ApJ, 770, 78
- [] Chhowalla, M., Wang, H., Sano, N., Teo, K. B., Lee, S. B., & Amaratunga, G. A. 2003, Phys. Rev. Lett., 90, 155504
- [] Chuvilin, A., Kaiser, U., Bichoutskaia, E., Besley, N. A., & Khlobystov, A. N. 2010, Nature Chem., 2, 450
- [] Dartois, E., Geballe, T. R., Pino, T., et al. 2007, A&A, 463, 635
- [] Draine, B.T. 2016, ApJ, 831, 109
- [] Draine, B.T., & Lee, H.M. 1984, ApJ, 285, 89
- [] Draine, B.T., & Li, A. 2001, ApJ, 551, 807
- [] Duley, W. W., Grishko, V. I., Kenel, J., et al. 2005, ApJ, 626, 933
- [] Finkbeiner, D. P., Davis, M., & Schlegel, D.J. 1999, ApJ, 524, 867
- [] Fitzpatrick, E.L. 1999, PASP, 111, 63
- [] Furton, D. G., Laiho, J. W., & Witt, A. N. 1999, ApJ, 526, 752
- [] García-Hernández, D. A., Manchado, A., García-Lario, P., et al. 2010, ApJL, 724, L39
- [] García-Hernández, D. A., Kameswara Rao, N., & Lambert, D. L. 2011a, ApJ, 729, 126
- [] García-Hernández, D. A., Iglesias-Groth, S., Acosta-Pulido, J. A., et al. 2011b, ApJL, 737, L30
- [] García-Hernández, D. A., Villaver, E., García-Lario, P., et al. 2012, ApJ, 760, 107
- [] Greenberg, J.M. 1968, in Stars and Stellar Systems, Vol. VII, ed. B.M. Middlehurst & L.H. Aller (Chicago: Univ. of Chicago Press), 221
- [] Greenberg, J. M., Li, A., Mendoza-Gomez, C. X., et al. 1995, ApJL, 455, L177
- [] Groopman, E.E., & Nittler, L.R. 2018, Geochimica et Cosmochimica Acta, 221, 219.
- [] Guillois, O., Ledoux, G., & Reynaud, C. 1999, ApJ, 521, L133
- [] Günay, B., Schmidt, T. W., Burton, M. G., et al. 2018, MNRAS, 479, 4336
- [] Hauser, M.G., Kelsall, T., Leisawitz, D., & Weiland, J. 1998, COBE Diffuse Infrared Background Experiment Explanatory Supplement version 2.3 (COBE Ref. Pub. No. 98-A; Greenbelt: NASA/GSFC)
- [] Henning, Th., & Salama, F. 1998, Science, 282, 2204
- [] Henning, Th., Jäger, C., & Mutschke, H. 2004, in Astrophysics of Dust (ASP Conf. Ser. 309), ed. A.N. Witt, G.C. Clayton, & B.T. Draine (San Francisco, CA: ASP), 603
- [] Iglesias-Groth, S., Ruiz, A., Bretón, J., & Gomez Llorente, J. M. 2003, J. Chem. Phys., 118, 7103
- [] Jäger, C., Mutschke, H., Henning, Th., & Huisken, F. 2011, EAS Publ. Ser., 46, 293
- [] Jovanović, V. B., Radović, I., Borka, D., et al. 2011, Phys. Rev. B, 84, 155416
- [] Krügel, E. 2003, The Physics of Interstellar Dust (Bristol: IOP)
- [] Kuzmin, S., & Duley, W. W. 2011, arXiv:1103.2989
- [] Kwok, S., & Zhang, Y. 2011, Nature, 479, 80
- [] Lai, T. S.-Y., Witt, A. N., & Crawford, K. 2017, MNRAS, 469, 4933
- [] Léger, A., & Puget, J. 1984, A&A, 137, L5
- [] Lewis, R.S., Tang, M., Wacker, J.F., Anders, E., & Steel, E. 1987, Nature, 326, 16
- [] Li, A., & Draine, B.T. 2001a, ApJL, 550, L213
- [] Li, A., & Draine, B.T. 2001b, ApJ, 554, 778
- [] Li, A., Chen, J. H., Li, M. P., Shi, Q. J., & Wang, Y. J. 2008, MNRAS, 390, L39
- [] Mackie, C. J., Peeters, E., Bauschlicher, C. W., Jr., & Cami, J. 2015, ApJ, 799, 131
- [] Martin, J. M. L., El-Yazal, J., & François, J.-P. 1996, Chem. Phys. Lett., 255, 7
- [] Maté, B., Molpeceres, G., Jiménez-Redondo, M., et al. 2016, ApJ, 831, 51
- [] Mathis, J.S. 1990, ARA&A, 28, 37
- [] Mathis, J. S., Rumpl, W., & Nordsieck, K. H. 1977, ApJ, 217, 425
- [] Mathis, J.S., Mezger, P.G., & Panagia, N. 1983, A&A, 128, 212
- [] Mishra, A., & Li, A. 2015, ApJ, 809, 120
- [] Mishra, A., & Li, A. 2017, ApJ, 850, 138
- [] Nelson, F. J. 2012, Study of the Dielectric Function of Graphene from Spectroscopic Ellipsometry and Electron Energy Loss Spectroscopy, PhD Thesis, State University of New York at Albany
- [] Nelson, F. J., Kamineni, V. K., Zhang, T., et al. 2010, Appl. Phys. Lett., 97, 253110
- [] Nelson, F. J., Idrobo, J.-C., Fite, J. D., et al. 2014, Nano Lett., 14, 3827
- [] Novoselov, K. S., Geim, A. K., Morozov, S. V., et al. 2004, Science, 306, 666
- [] Onaka, T., Yamamura, I., Tanabe, T., et al. 1996, PASJ, 48, L59
- [] Ott, U., Besmehn, A., Farouqi, K., et al. 2012, PASA, 29, 90
- [] Pendleton, Y. J., & Allamandola, L. J. 2002, ApJS, 138, 75
- [] Pendleton, Y. J., Sandford, S. A., Allamandola, L. J., Tielens, A. G. G. M., & Sellgren, K. 1994, ApJ, 437, 683
- [] Planck Collaboration XVII 2014, A&A, 566, A55
- [] Qi, H., Picaud, S., Devel, M., Liang, E., & Wang, Z. 2018, ApJ, 867, 133
- [] Ruiz, A., Bretón, J., & Gomez Llorente, J. M. 2005, Phys. Rev. Lett., 94, 105501
- [] Sandford, S. A., Allamandola, L. J., Tielens, A. G. G. M., et al. 1991, ApJ, 371, 607
- [] Sarre, P. J. 2019, MNRAS, in press (arXiv:1908.07787)
- [] Sellgren, K., Werner, M. W., Ingalls, J. G., et al. 2010, ApJL, 722, L54
- [] Shimonishi, T., Dartois, E., Onaka, T., et al. 2016, A&A, 585, A107
- [] Strelnikov, D., Kern, B., & Kappes, M. M. 2015, A&A, 584, A55
- [] Tielens, A. G. G. M. 2008, ARA&A, 46, 289
- [] Trevisanutto, P.E., Holzmann, M., Côté, M., & Olevano, V. 2010, Phys. Rev. B, 81, 121405
- [] van Kerckhoven, C., Tielens, A.G.G.M., & Waelkens, C. 2002, A&A, 384, 568
- [] Weingartner, J.C., & Draine, B.T. 2001, ApJ, 548, 296
- [] Whittet, D. C. B., Boogert, A. C. A., Gerakines, P. A., et al. 1997, ApJ, 490, 729
- [] Wickramasinghe, D. T., & Allen, D. A. 1980, Nature, 287, 518
- [] Witt, A. N. 2014, in IAU Symp. 297, The Diffuse Interstellar Bands, ed. J. Cami & N. L. J. Cox (Cambridge: Cambridge Univ. Press), 173
- [] Witt, A. N., & Vijh, U. P. 2004, in ASP Conf. Ser. 309, Astrophysics of Dust, ed. A.N. Witt, G.C. Clayton, & B.T. Draine (San Francisco: ASP), 115
- [] Yang, L., Deslippe, J., Park, C.-H., Cohen, M. L., & Louie, S. G. 2009, Phys. Rev. Lett., 103, 186802
- [] Zhang, Y., & Kwok, S. 2011, ApJ, 730, 126