In Situ Momentum Distribution Measurement of a Quantum Degenerate Fermi Gas using Raman Spectroscopy
Abstract
The ability to directly measure the momentum distribution of quantum gases is both unique to these systems and pivotal in extracting many other important observables. Here we use Raman transitions to measure the momentum distribution of a weakly-interacting Fermi gas in a harmonic trap. For narrow atomic dispersions, momentum and energy conservation imply a linear relation between the two-photon detuning and the atomic momentum. We detect the number of atoms transferred by the Raman beams using sensitive fluorescence detection in a magneto-optical trap. We employ this technique to a degenerate weakly-interacting Fermi gas at different temperatures. The measured momentum distributions match theoretical curves over two decades, and the extracted temperatures are in very good agreement with the ones obtained from a conventional time-of-flight technique. The main advantages of our measurement scheme are that it can be spatially selective and applied to a trapped gas, it can be completed in a relatively short time, and due to its high sensitivity, it can be used with very small clouds.
In recent years, experiments with ultracold dilute gases contributed immensely to our understanding of quantum many-body phenomena Bloch et al. (2008). Among the properties that make these systems so useful are the tunability of inter-particle interactions in the vicinity of a Feshbach resonance Chin et al. (2010), the flexibility of generating different potentials using far-off-resonance light Grimm et al. (2000), and the ability to directly measure observables not easily accessible in other systems, such as the momentum of the particles. The momentum distribution is instrumental for extracting many other important observables. For instance, the total energy of the cloud can be calculated from the momentum distribution measured after the interaction energy has been converted into kinetic energy in a ballistic expansion Ensher et al. (1996); DeMarco (1999); Bourdel et al. (2003); Stewart et al. (2006). In addition, the contact parameter, , can be extracted from the tail of the momentum distribution Stewart et al. (2010), which scales as for , with being the Fermi wave-vector Tan (2008). The occupied single-particle spectral function can also be reconstructed from a set of momentum distribution measurements of rf out-coupled atoms Stewart et al. (2008). This so-called momentum resolved photoemission spectroscopy (MRPES) technique is one of the most powerful methods to characterize the many-body state of the system Gaebler et al. (2010); Feld et al. (2011); Koschorreck et al. (2012); Sagi et al. (2015).
The most common way to measure the momentum distribution is by abruptly closing the confining potential and letting the atoms expand ballistically without collisions, commonly referred to as time-of-flight (TOF) measurement. To eliminate systematic errors due to the initial size of the cloud, the expansion time must be very long or alternatively be performed in a perfect harmonic trap for a quarter of the trapping period Shvarchuck et al. (2002); van Amerongen et al. (2008); Tung et al. (2010). These techniques do not allow determination of the momentum distribution of a gas which is still trapped. Since they rely on optical imaging, they are naturally limited by the relatively small atomic absorption cross-section and the spatial optical resolution.
An alternative approach is to use stimulated Raman scattering. In this process, two different internal states are coupled by the absorption and stimulated emission of two photons from two different optical beams. Conservation of energy and momentum restrict the possible velocity of the atom coupled by the Raman beams. The velocity-selective nature of the Raman process has been employed for manipulation Kasevich et al. (1991), velocity detection Kasevich et al. (1991); Afek et al. (2017), cooling Aspect et al. (1988); Kasevich and Chu (1992), and atomic interferometry Kasevich and Chu (1991). Raman coupling was also used for creating spin-orbit coupling for neutral Bose Lin et al. (2011) and Fermi gases Cheuk et al. (2012); Wang et al. (2012). Bragg scattering, a closely-related process, was used to study the structure factor and excitation spectrum of Bose-Einstein condensates (BEC) Stenger et al. (1999); Steinhauer et al. (2002) and degenerate Fermi gases Veeravalli et al. (2008), and to measure the momentum distribution of a homogeneous weakly-interacting BEC Gotlibovych et al. (2014).
In this paper, we demonstrate an in situ measurement of the momentum distribution of a degenerate weakly-interacting Fermi gas using Raman spectroscopy and a sensitive fluorescence detection scheme Shkedrov et al. (2018). There are four main advantages to this approach. First, it can be applied to the atoms without releasing them from the trap. This is particularly useful if a measurement of only part of the cloud is needed, in which case the Raman beams can be focused and probe this part specifically. Second, since our detection scheme is done by recording the fluorescence of atoms trapped in a MOT, it is very sensitive and can be applied with very small atom numbers. Third, the measurement is not sensitive to the shape of the cloud. Lastly, unlike TOF techniques which require an expansion of tens of milliseconds, the measurement using Raman transition can be performed in a short duration, typically much less than a millisecond. This merit can open the door to novel studies of out-of-equilibrium dynamics.
The two-photon Raman transition connects atoms with energy and , in the initial and final states, respectively, where is the initial momentum of the atom and is the relative wave-vector of the Raman transition. Assuming a quadratic dispersion relation , with being the zero momentum energy, conservation of energy and momentum yields:
| (1) |
where is the atomic momentum projection along the direction of , is the Raman detuning. Since , we can write where is the average wavelength of the Raman beams and is the angle between them. Eq.(1) shows there is a linear relation between the Raman detuning and . Note that in this treatment we assume a linear response of the Raman transition, which means the Raman pulse duration should be much shorter than the Raman Rabi duration . Thanks to the high sensitivity of our fluorescence detection scheme, we can indeed work in the weak coupling regime where the fraction of transferred atoms is typically less than few precents.
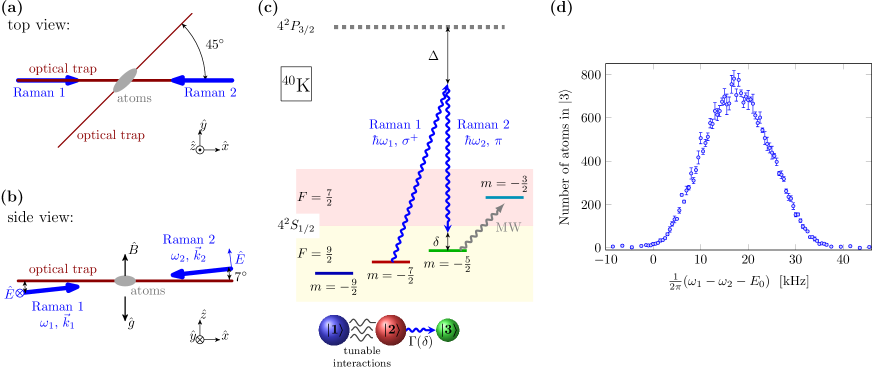
The experiments are conducted with a quantum degenerate gas of fermionic 40K atoms. The gas is prepared in a balanced incoherent mixture of the states and in the manifold, whose interaction, characterized by the s-wave scattering length , can be tuned by an external magnetic field near a Feshbach resonance at G Shkedrov et al. (2018). The experimental apparatus and cooling sequence are the same as described in Refs. Shkedrov et al. (2018); Ness et al. (2018). Two counter-propagating Raman beams overlap with the atomic cloud (see figure 3a and 3b). The Raman process, shown schematically in figure 1c, couples atoms in the state to a third initially unoccupied state . We denote the Raman beams frequencies by and and their wave-vectors by and . The detuning of and from the closest transition, P3/2, is given by , which is chosen to be much larger than the excited state width in order to keep a low rate of spontaneous Raman scattering events.
The Raman beams are derived from a single distributed Bragg reflector (DBR) laser whose wavelength can be tuned by changing the temperature and current. The linewidth of the laser is MHz, and with temperature stabilization it is stable to within MHz, much smaller than . The two beams are generated by two acousto-optical modulators in a double-pass configuration Donley et al. (2005). The modulators are driven by a single direct digital synthesizer (DDS), which ensures that the two Raman beams are phase-coherent. The beams are delivered to the apparatus by two single-mode polarization-maintaining optical fibers. Their radius is mm and their power is around mW. They have linear orthogonal polarizations, and their propagation axis forms an angle of with the direction of the magnetic field (the quantization axis) and with the long axis of the optical trap (see figure 1a and 1b). With this choice, we are able to drive the Raman transition which requires and photons.
In order to achieve the highest detection sensitivity, we employ a technique we have recently developed for rf spectroscopy Shkedrov et al. (2018). The main idea is to selectively transfer only the atoms in state to another magnetically trappable state which is initially unoccupied. Then, these atoms are trapped by turning on a magnetic trap, while driving atoms in all the other untrappable states out of the detection region. We then turn on laser beams which create a 3D MOT in which we detect the trapped atoms by recording their fluorescence. This technique allows us to detect very small signals down to only few atoms.
The Raman spectrum is obtained by scanning the two-photon detuning, , and recording the number of atoms transferred to state . A characteristic measurement is shown in figure 1d. Each data point requires that the cloud be prepared anew. For each spectrum, we also take several data points at khz, far from the Raman resonance around kHz (see figure 1d). These shots are used as a calibration of the background signal, which originates from spontaneous Raman scattering events. The background, which is typically 20-40 times smaller than the peak Raman signal, is subtracted from all measurements presented in this paper.
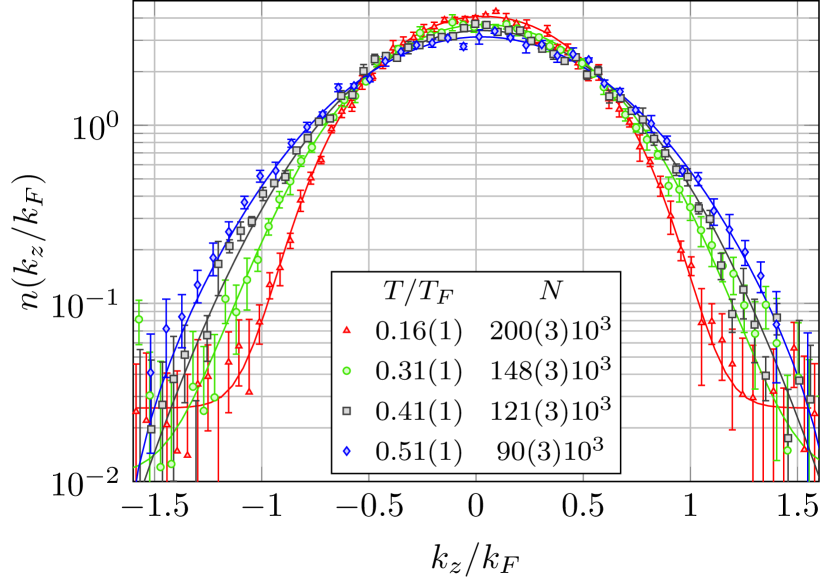
Raman spectroscopy measurements of the one-dimensional momentum distributions of a weakly-interacting degenerate Fermi gas are shown in figure 2. In these measurements, the atomic cloud was prepared in a magnetic field of G where and states and are weakly-interacting. After evaporative cooling in the optical trap, we ramp up the trap such that the radial and axial oscillation frequencies are Hz and Hz, respectively. In order to prepare a gas with different ( is the Fermi temperature), we vary the waiting time in the trap before applying the Raman pulse. The two-photon Raman detuning, , is translated into momentum using Eq.(1) and normalized by , which is calculated from the measured number of atoms and the trap oscillation frequencies. The quantity , namely the energy difference between the initial and final states, is measured by rf spectroscopy with a spin-polarized gas Shkedrov et al. (2018).
One-dimensional momentum distribution of non-interacting fermions in a harmonic trap has the following form:
| (2) |
where is the polylogarithmic function and is the fugacity. This relation can be obtained by doubly integrating the three-dimensional momentum distribution over the and directions Ketterle and Zwierlein (2008). In a harmonic trap the fugacity is related to the normalized temperature through:
| (3) |
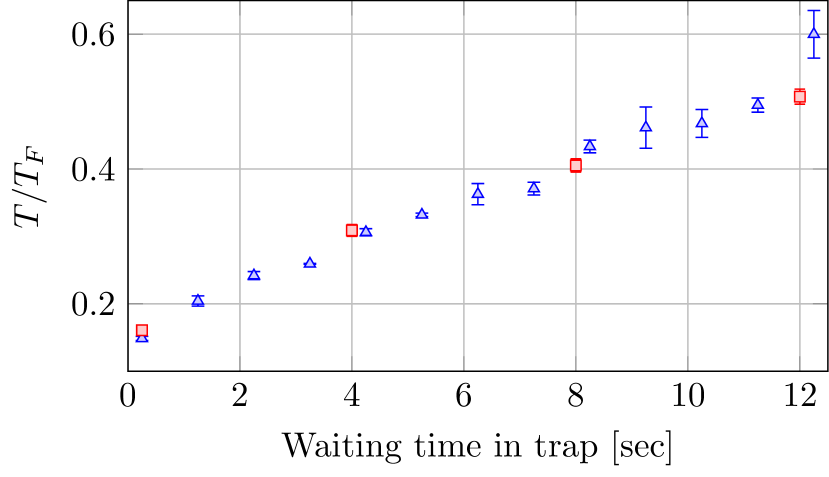
We fit the data with Eq.(2) (solid lines in figure 2). When fitting, Eq.(3) constrain the fugacity , such that there are only free parameters: , the distribution center, and a background level, which is typically very small because of our procedure to subtract the background. The excellent agreement between the fits and the data over more than two decades is a compelling evidence that indeed the measurement yields the momentum distribution. In figure 3, we plot the normalized temperature, , extracted from the fits (red squares) as a function of the waiting time in the optical trap. For comparison, we also plot the temperature extracted from the momentum distribution measured with a conventional TOF technique (blue triangles). The temperatures extracted by the two techniques agree to within the experimental uncertainty.
In conclusion, we have explored the use of Raman transitions for probing the momentum distribution of a weakly-interacting quantum degenerate Fermi gas in a harmonic trap. There are several ways to extend Raman spectroscopy to the strong interaction regime. If the quantum state supports quasi-particles with a well-defined dispersion relation, e.g. a Fermi liquid, then the considerations leading to Eq.(1) may still hold, albeit with a renormalized mass and a mean-field energy shift. The Raman spectrum is then expected to reflect the momentum distribution of the quasi-particles. In the general case, Raman spectroscopy can be used to probe the single-particle spectral function, similar to rf MRPES Dao et al. (2007, 2009). This, however, requires resolving the momentum distribution of the Raman-coupled atoms. In order to measure the momentum distribution of strongly-interacting fermions, it is necessary to rapidly ramp the magnetic field to the zero-crossing point where (G for 40K Smale et al. (2019)) Bourdel et al. (2003); Regal et al. (2005). This ramp has to be faster than the many-body timescale Stewart et al. (2010). Finally, when the Raman spectrum reflects the momentum distribution, it should be symmetric at equilibrium. Indeed, we have observed that in cases where the cloud has not yet reached equilibrium, the Raman spectrum shows interesting asymmetric patterns which are not noticeable in TOF measurements. This sensitivity suggests that Raman spectroscopy can be instrumental in exploring the non-equilibrium dynamics of driven Fermi gases.
This research was supported by the Israel Science Foundation (ISF) grant No. 888418, and by the United States-Israel Binational Science Foundation (BSF), Jerusalem, Israel, grant No. 2014386.
References
- Bloch et al. (2008) I. Bloch, J. Dalibard, and W. Zwerger, Rev. Mod. Phys. 80, 885 (2008).
- Chin et al. (2010) C. Chin, R. Grimm, P. Julienne, and E. Tiesinga, Rev. Mod. Phys. 82, 1225 (2010).
- Grimm et al. (2000) R. Grimm, M. Weidemuller, and Y. B. Ovchinnikov (Academic Press, 2000) pp. 95–170.
- Ensher et al. (1996) J. R. Ensher, D. S. Jin, M. R. Matthews, C. E. Wieman, and E. A. Cornell, Phys. Rev. Lett. 77, 4984 (1996).
- DeMarco (1999) B. DeMarco, Science 285, 1703 (1999).
- Bourdel et al. (2003) T. Bourdel, J. Cubizolles, L. Khaykovich, K. M. F. Magalhães, S. J. J. M. F. Kokkelmans, G. V. Shlyapnikov, and C. Salomon, Phys. Rev. Lett. 91 (2003), 10.1103/physrevlett.91.020402.
- Stewart et al. (2006) J. T. Stewart, J. P. Gaebler, C. A. Regal, and D. S. Jin, Phys. Rev. Lett. 97, 220406 (2006).
- Stewart et al. (2010) J. T. Stewart, J. P. Gaebler, T. E. Drake, and D. S. Jin, Phys. Rev. Lett. 104, 235301 (2010).
- Tan (2008) S. Tan, Ann. Phys. 323, 2971 (2008).
- Stewart et al. (2008) J. T. Stewart, J. P. Gaebler, and D. S. Jin, Nature 454, 744 (2008).
- Gaebler et al. (2010) J. P. Gaebler, J. T. Stewart, T. E. Drake, D. S. Jin, A. Perali, P. Pieri, and G. C. Strinati, Nat. Phys. 6, 569 (2010).
- Feld et al. (2011) M. Feld, B. Fröhlich, E. Vogt, M. Koschorreck, and M. Köhl, Nature 480, 75 (2011).
- Koschorreck et al. (2012) M. Koschorreck, D. Pertot, E. Vogt, B. Fröhlich, M. Feld, and M. Köhl, Nature 485, 619 (2012).
- Sagi et al. (2015) Y. Sagi, T. E. Drake, R. Paudel, R. Chapurin, and D. S. Jin, Phys. Rev. Lett. 114, 075301 (2015).
- Shvarchuck et al. (2002) I. Shvarchuck, C. Buggle, D. S. Petrov, K. Dieckmann, M. Zielonkowski, M. Kemmann, T. G. Tiecke, W. von Klitzing, G. V. Shlyapnikov, and J. T. M. Walraven, Phys. Rev. Lett. 89, 270404 (2002).
- van Amerongen et al. (2008) A. H. van Amerongen, J. J. P. van Es, P. Wicke, K. V. Kheruntsyan, and N. J. van Druten, Phys. Rev. Lett. 100, 090402 (2008).
- Tung et al. (2010) S. Tung, G. Lamporesi, D. Lobser, L. Xia, and E. A. Cornell, Phys. Rev. Lett. 105, 230408 (2010).
- Kasevich et al. (1991) M. Kasevich, D. S. Weiss, E. Riis, K. Moler, S. Kasapi, and S. Chu, Phys. Rev. Lett. 66, 2297 (1991).
- Afek et al. (2017) G. Afek, J. Coslovsky, A. Courvoisier, O. Livneh, and N. Davidson, Phys. Rev. Lett. 119 (2017), 10.1103/physrevlett.119.060602.
- Aspect et al. (1988) A. Aspect, E. Arimondo, R. Kaiser, N. Vansteenkiste, and C. Cohen-Tannoudji, Phys. Rev. Lett. 61, 826 (1988).
- Kasevich and Chu (1992) M. Kasevich and S. Chu, Phys. Rev. Lett. 69, 1741 (1992).
- Kasevich and Chu (1991) M. Kasevich and S. Chu, Phys. Rev. Lett. 67, 181 (1991).
- Lin et al. (2011) Y.-J. Lin, K. Jiménez-García, and I. B. Spielman, Nature 471, 83 (2011).
- Cheuk et al. (2012) L. W. Cheuk, A. T. Sommer, Z. Hadzibabic, T. Yefsah, W. S. Bakr, and M. W. Zwierlein, Phys. Rev. Lett. 109 (2012), 10.1103/physrevlett.109.095302.
- Wang et al. (2012) P. Wang, Z.-Q. Yu, Z. Fu, J. Miao, L. Huang, S. Chai, H. Zhai, and J. Zhang, Phys. Rev. Lett. 109, 095301 (2012).
- Stenger et al. (1999) J. Stenger, S. Inouye, A. P. Chikkatur, D. M. Stamper-Kurn, D. E. Pritchard, and W. Ketterle, Phys. Rev. Lett. 82, 4569 (1999).
- Steinhauer et al. (2002) J. Steinhauer, R. Ozeri, N. Katz, and N. Davidson, Phys. Rev. Lett. 88 (2002), 10.1103/physrevlett.88.120407.
- Veeravalli et al. (2008) G. Veeravalli, E. Kuhnle, P. Dyke, and C. J. Vale, Phys. Rev. Lett. 101, 250403 (2008).
- Gotlibovych et al. (2014) I. Gotlibovych, T. F. Schmidutz, A. L. Gaunt, N. Navon, R. P. Smith, and Z. Hadzibabic, Phys. Rev. A 89 (2014), 10.1103/physreva.89.061604.
- Shkedrov et al. (2018) C. Shkedrov, Y. Florshaim, G. Ness, A. Gandman, and Y. Sagi, Phys. Rev. Lett. 121, 093402 (2018).
- Ness et al. (2018) G. Ness, C. Shkedrov, Y. Florshaim, and Y. Sagi, New J. Phys. 20, 095002 (2018).
- Donley et al. (2005) E. A. Donley, T. P. Heavner, F. Levi, M. O. Tataw, and S. R. Jefferts, Rev. Sci. Instrum. 76, 063112 (2005).
- Ketterle and Zwierlein (2008) W. Ketterle and M. W. Zwierlein, in Proceedings of the International School of Physics “Enrico Fermi”, Course CLXIV, edited by M. Inguscio, W. Ketterle, and C. Salomon (IOS Press, Amsterdam, 2008).
- Dao et al. (2007) T.-L. Dao, A. Georges, J. Dalibard, C. Salomon, and I. Carusotto, Phys. Rev. Lett. 98, 240402 (2007).
- Dao et al. (2009) T.-L. Dao, I. Carusotto, and A. Georges, Phys. Rev. A 80, 023627 (2009).
- Smale et al. (2019) S. Smale, P. He, B. A. Olsen, K. G. Jackson, H. Sharum, S. Trotzky, J. Marino, A. M. Rey, and J. H. Thywissen, Sci. Adv. 5, eaax1568 (2019).
- Regal et al. (2005) C. A. Regal, M. Greiner, S. Giorgini, M. Holland, and D. S. Jin, Phys. Rev. Lett. 95, 250404 (2005).