The Physical Origins of the Identified and Still Missing Components of the Warm-Hot Intergalactic Medium: Insights from Deep Surveys in the Field of Blazar 1ES1553+113
Abstract
The relationship between galaxies and the state/chemical enrichment of the warm-hot intergalactic medium (WHIM) expected to dominate the baryon budget at low- provides sensitive constraints on structure formation and galaxy evolution models. We present a deep redshift survey in the field of 1ES1553113, a blazar with a unique combination of UVX-ray spectra for surveys of the circum-/intergalactic medium (CGM/IGM). Nicastro et al. (2018) reported the detection of two O VII WHIM absorbers at and in its spectrum, suggesting that the WHIM is metal-rich and sufficient to close the missing baryons problem. Our survey indicates that the blazar is a member of a group and that the higher- O VII candidate arises from its intragroup medium. The resulting bias precludes its use in baryon censuses. The candidate occurs in an isolated environment kpc from the nearest galaxy (with stellar mass ) which we show is unexpected for the WHIM. Finally, we characterize the galactic environments of broad H I Ly absorbers (Doppler widths of ; K) which provide metallicity independent WHIM probes. On average, broad Ly absorbers are closer to the nearest luminous () galaxy (700 kpc) than narrow ( ; K) ones (1300 kpc) but further than O VI absorbers (350 kpc). These observations suggest that gravitational collapse heats portions of the IGM to form the WHIM but with feedback that does not enrich the IGM far beyond galaxy/group halos to levels currently observable in UV/X-ray metal lines.
1 Introduction
Cosmological simulations predict that gravitational shocks associated with structure formation will heat a large fraction of the cool ( K) intergalactic medium (IGM) that dominates the baryon budget in the early Universe to form a Warm-Hot Intergalactic Medium (WHIM; K) at (e.g. Cen & Ostriker, 1999). The predicted physical state and enrichment levels of the WHIM depend sensitively on stellar and black hole feedback which provide additional heating and chemical enrichment (e.g. Rahmati et al., 2016; Nelson et al., 2018; Wijers et al., 2019). Observations of the WHIM and its relationship to galaxies can, therefore, serve as a check of our cosmological paradigm and as a laboratory for studying galaxy evolution.
While observationally elusive, the WHIM can be detected via absorption spectroscopy through ionic transitions in the UV and X-ray as well as through metallicity independent probes such as broad H I Ly absorption (e.g. Danforth et al., 2010), the Sunyaev-Zel’dovich (SZ) effect (e.g. de Graaff et al., 2019), and the dispersion measure of fast radio bursts (FRBs; e.g. Bannister et al., 2019; Ravi et al., 2019). Surveys of the highly ionized phases of the CGM/IGM traced by O VI (e.g. Danforth et al., 2016), Ne VIII (e.g. Pachat et al., 2017; Frank et al., 2018), and Mg X (Qu & Bregman, 2016) with the Cosmic Origins Spectrograph (Green et al., 2012) on the Hubble Space Telescope (HST) can account for a large fraction of the baryons expected in the WHIM but leave missing (e.g. Shull et al., 2012) and potentially in a chemically pristine or more highly ionized phase.
Surveys of CGM/IGM around galaxies find that metal ion absorption is common in the CGM at projected distances () less than the estimated galaxy host halo virial radii () but comparatively rare at larger distances (e.g. Liang & Chen, 2014; Turner et al., 2014; Johnson et al., 2015, 2017; Burchett et al., 2019). These observations suggest that feedback may be ineffective at enriching the IGM far beyond galaxy halos. Indeed, the statistical detection of SZ signal from the filaments between massive galaxies (de Graaff et al., 2019) can potentially account for the remaining missing baryons, suggesting that a substantial portion of the WHIM exhibits low metallicities ( solar; Liang & Chen, 2014; Johnson et al., 2015) or high temperatures ( K) not traced in the UV.
New insights into chemical enrichment mechanisms and the physical state of the CGM/IGM require deep galaxy surveys in fields with UV and X-ray absorption spectra. Blazars are ideal for such studies because of their high UV/X-ray flux levels. Recently, Nicastro et al. (2018) obtained a 1.7 Msec XMM-Newton X-ray spectrum of the blazar , reaching the S/N levels required to detect hot CGM/IGM absorbers individually over a large redshift pathlength for the first time. The X-ray spectrum revealed two candidate O VII absorption systems at and , each with statistical significance of , though we note that systematic/non-Gaussian errors (e.g. Nevalainen et al., 2019) and contamination (e.g. Nicastro et al., 2016) have led to past controversies over X-ray absorbers. Nevertheless, taken together, the two O VII absorbers reported by Nicastro et al. (2018) suggest that the hot phase of the CGM/IGM is metal-rich and accounts for of the baryon budget. However, the combination of a poorly constrained blazar redshift (due to a featureless spectrum) and limited complementary galaxy surveys complicates the interpretation of absorbers toward .
Here, we present a deep and highly complete galaxy redshift survey in the field of . When combined with UV absorption spectra, the survey enables a precise measurement of the redshift of and provides insights into the origins of intervening IGM/CGM systems. The letter proceeds as follows: In Section 2, we describe the galaxy survey and UV spectroscopy. In Section 3, we combine these datasets to infer the blazar redshift. In Section 4, we characterize the galactic environments of the candidate WHIM absorbers and draw insights into their origins.
We adopt a flat cosmology with , , and . All magnitudes are in the AB system. We define the knee in the galaxy luminosity function, , as (Loveday et al., 2012).
2 Observations and Data
2.1 Galaxy survey data
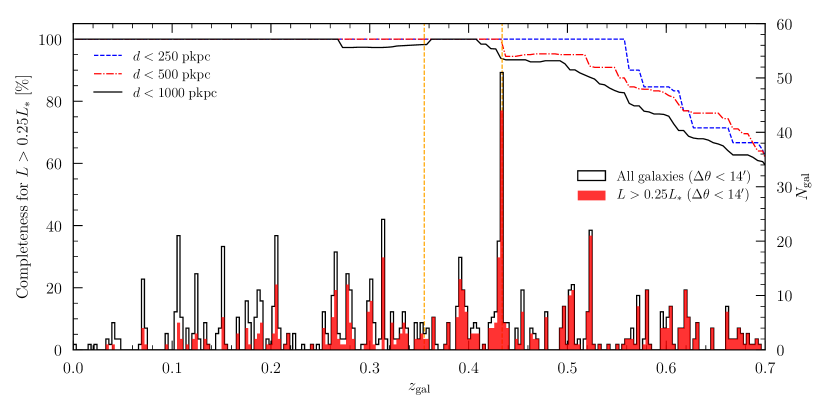
To study the relationship between galaxies and the IGM, we conducted a deep and highly complete redshift survey targeting galaxies of mag in the field of with multi-slit spectrographs on the Magellan Telescopes. We acquired deep -, -, and -band images with MOSAIC on the Mayall telescope with 1800 sec of exposure in each filter under seeing (PI: Johnson; PID: 2015A-0187) and an HST image with the ACSF814W filter and 1200 sec of exposure (PI: Mulchaey; PID: 13024). We processed the data as described in Chen & Mulchaey (2009) and Johnson et al. (2015). In total, we measured spectroscopic redshifts for 921 galaxies at angular distances of from the blazar sightline and also include 25 redshifts from Prochaska et al. (2011) and one from Keeney et al. (2018). Redshift histograms and completeness levels for galaxies of ( at projected distances of kpc and ) are shown in Figure 1.
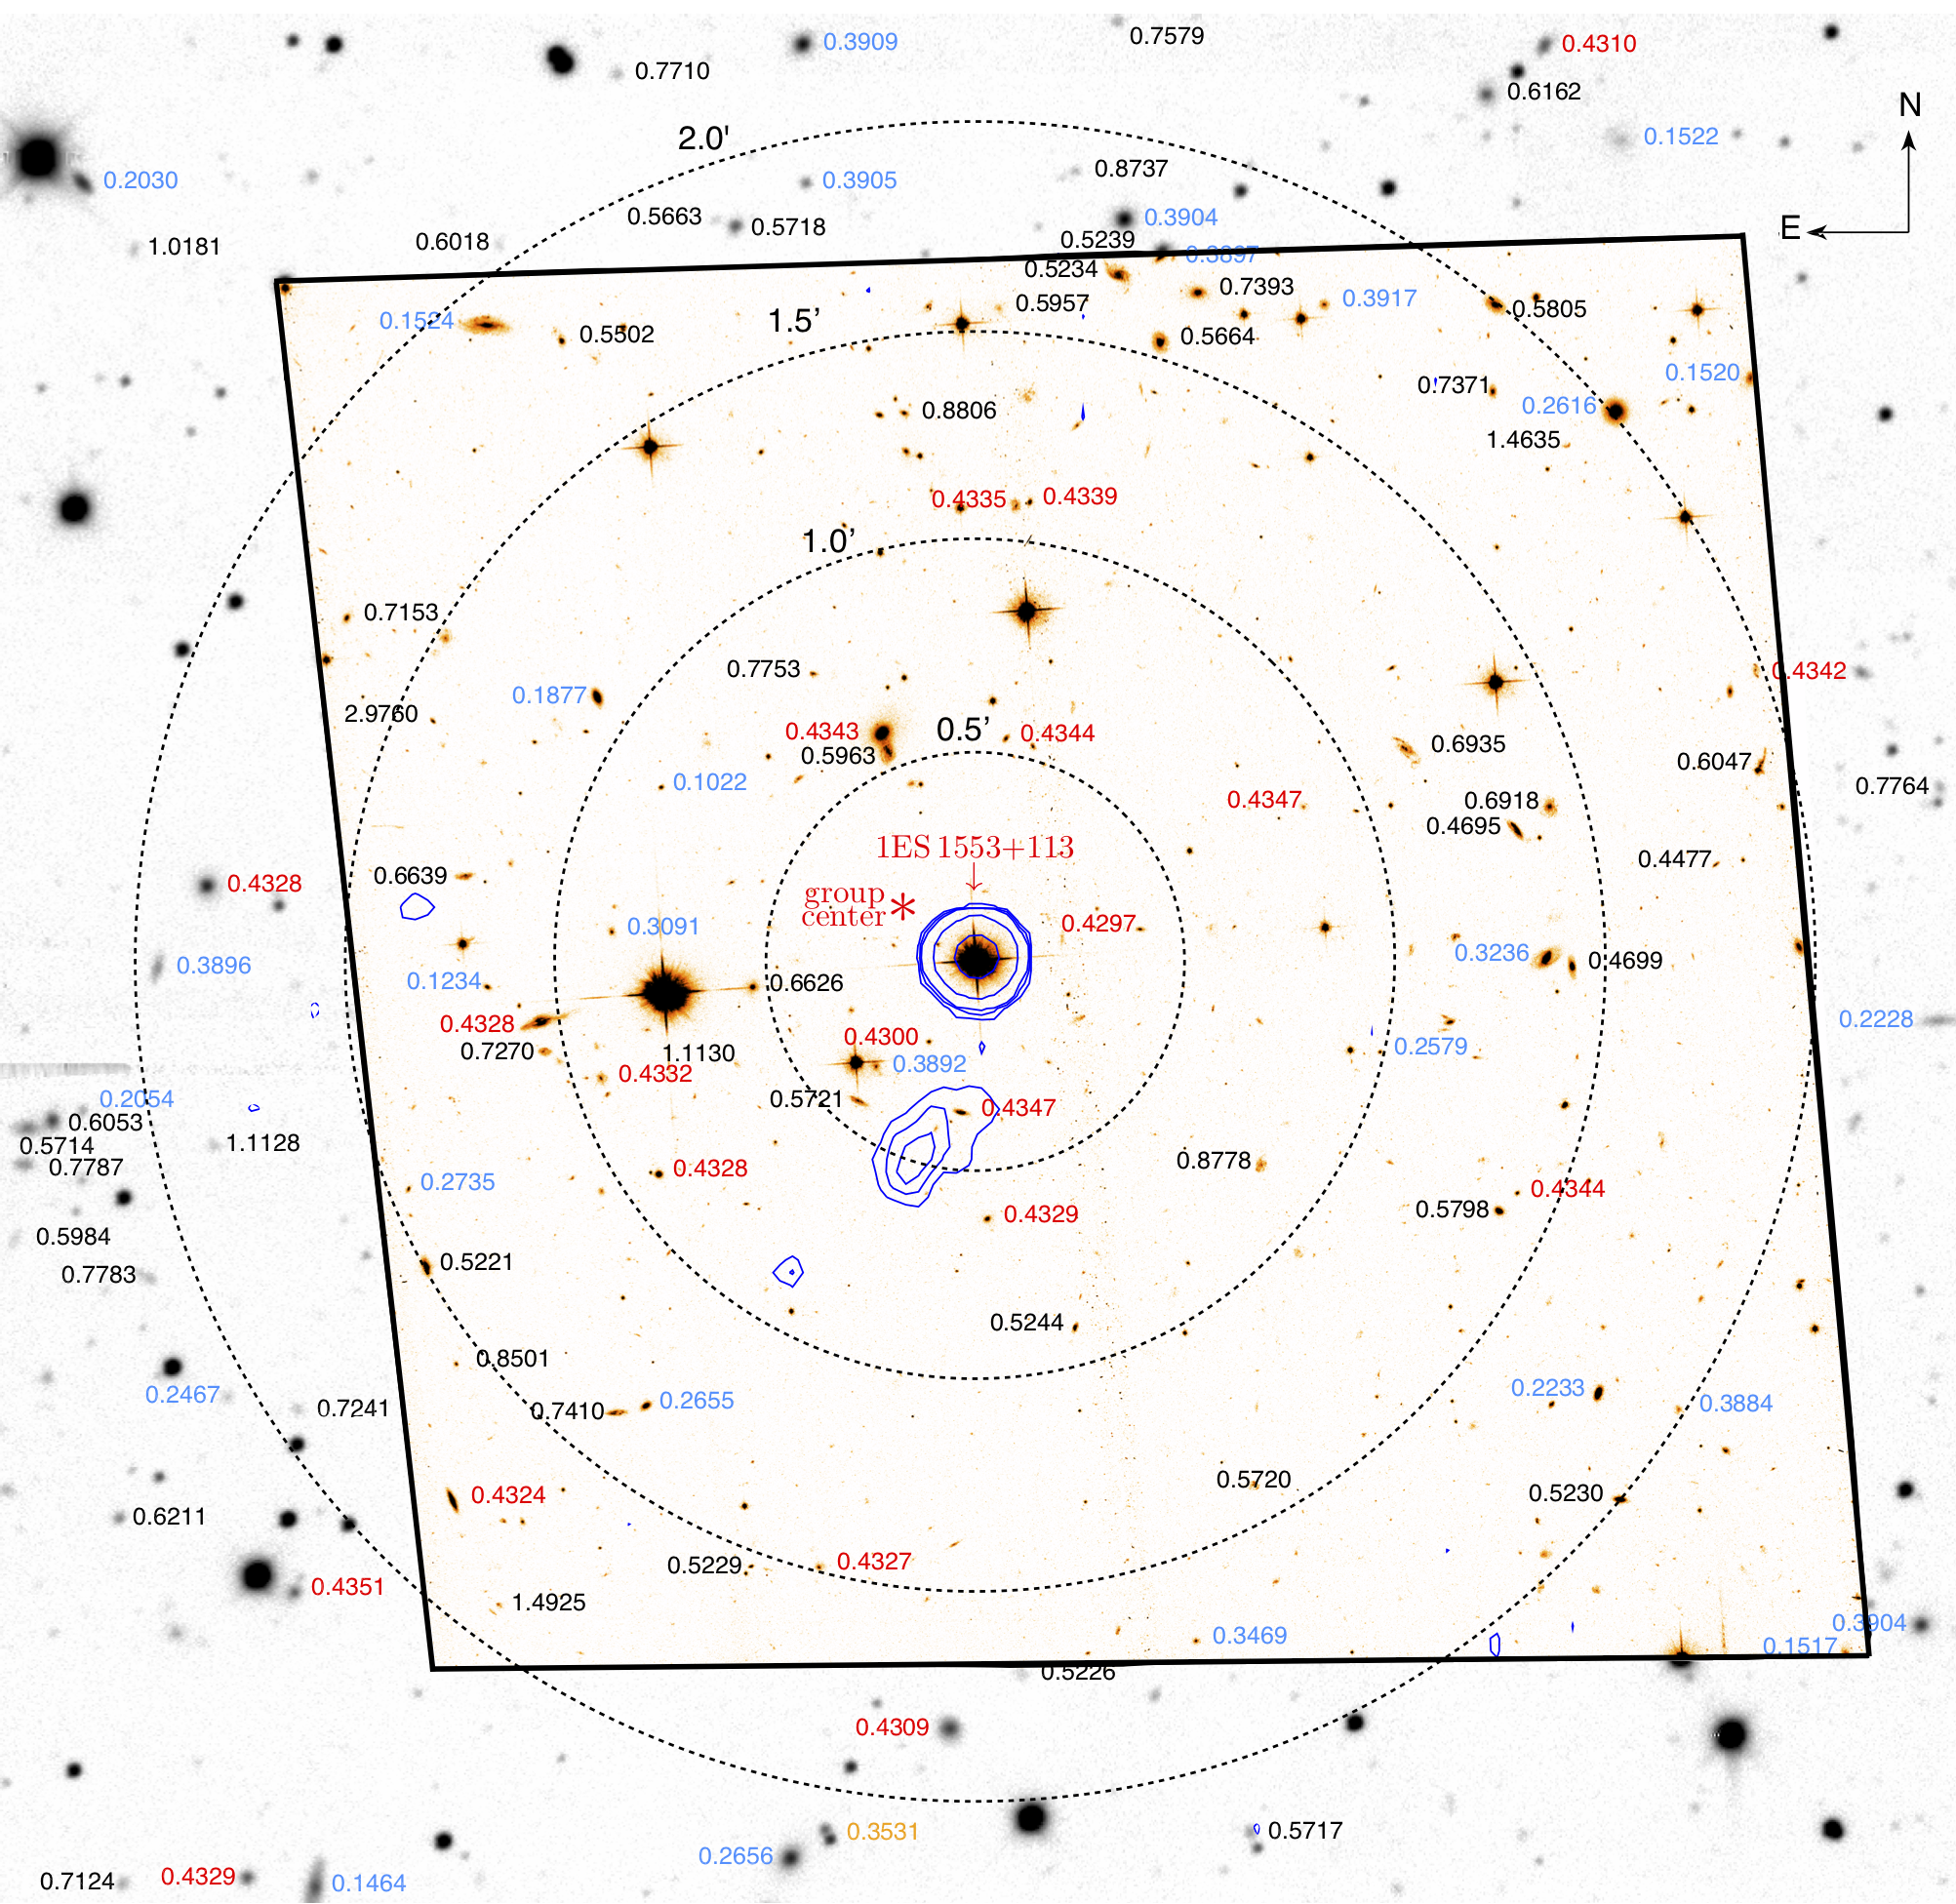
The survey results are summarized in Table 1 which reports coordinates, apparent magnitudes (), redshift quality (“g” for secure redshifts and “s” for single-line redshifts), redshift (), rest-frame color, absolute rest-frame -band magnitude (), stellar mass (), and projected angular & physical separations from the blazar sightline ( & ). The absolute magnitudes include -corrections, and the stellar masses are estimated as in Johnson et al. (2015) assuming a Chabrier (2003) IMF. Typical uncertainties in the redshifts, magnitudes, and stellar masses are , mags, and dex respectively. Table 1 is separated into sections by redshift within of the two candidate O VII absorbers (; ), those at higher redshift (), and all other redshifts. Figure 2 displays an image of the field with galaxy redshifts labeled.
2.2 UV absorption spectroscopy
The COS GTO team acquired G130MG160M spectra of (PI: Green; PID: 11520, 12025) which are useful for inferring the redshift of the blazar based on the presence/absence of Ly forest absorption. We retrieved all available COS spectra for from the HST archive and combined them into a single coadded spectrum as described in Johnson et al. (2013).
| R.A. | Decl. | quality | |||||||||
| (J2000) | (J2000) | (AB) | (AB) | (AB) | (AB) | (AB) | (arcsec) | (pkpc) | |||
| 15:55:44.20 | +11:11:04.6 | 23.1 | 22.1 | 21.4 | g | 0.5721 | 0.4 | 10.3 | 26.1 | 170 | |
| 15:55:43.91 | +11:11:54.4 | 22.9 | 21.6 | 20.8 | g | 0.5963 | 0.5 | 10.7 | 32.7 | 218 | |
| 15:55:45.22 | +11:11:20.7 | 23.3 | 21.9 | 21.1 | g | 0.6626 | 0.4 | 10.6 | 32.3 | 226 | |
| 15:55:45.38 | +11:11:09.9 | 23.6 | 23.1 | 22.9 | s | 1.1130 | 0.2 | 10.3 | 37.2 | 305 | |
| 15:55:42.08 | +11:10:32.1 | 23.1 | 22.2 | 22.0 | g | 0.5244 | 0.2 | 9.4 | 54.1 | 338 | |
| 15:55:44.62 | +11:12:05.5 | 23.7 | 23.2 | 22.8 | g | 0.7753 | 0.2 | 9.5 | 47.3 | 351 | |
| 15:55:40.28 | +11:10:55.3 | 23.9 | 23.1 | 22.3 | g | 0.8778 | 0.4 | 10.5 | 49.9 | 386 | |
| 15:55:47.24 | +11:11:11.6 | 23.7 | 23.1 | 22.3 | g | 0.7270 | 0.2 | 9.7 | 63.0 | 457 | |
| 15:55:37.80 | +11:11:43.4 | 23.0 | 21.4 | 20.9 | g | 0.4695 | 0.4 | 10.3 | 79.5 | 469 | |
| 15:55:38.87 | +11:11:54.8 | 22.5 | 21.6 | 21.1 | g | 0.6935 | 0.2 | 10.1 | 68.5 | 488 | |
| 15:55:37.26 | +11:11:23.9 | 23.2 | 21.5 | 20.9 | g | 0.4699 | 0.5 | 10.5 | 85.2 | 503 | |
| ⋮ | ⋮ | ⋮ | ⋮ | ⋮ | ⋮ | ⋮ | ⋮ | ⋮ | ⋮ | ⋮ | |
| 15:55:43.51 | +11:11:13.0 | 23.9 | 22.7 | 22.5 | g | 0.4300 | 0.5 | 10.2 | 13.2 | 74 | |
| 15:55:43.19 | +11:11:02.8 | 23.6 | 22.2 | 21.5 | g | 0.4347 | 0.6 | 10.3 | 21.6 | 122 | |
| 15:55:41.45 | +11:11:29.1 | 25.4 | 23.3 | 22.9 | s | 0.4297 | 0.4 | 9.5 | 23.9 | 134 | |
| 15:55:42.76 | +11:11:56.4 | 24.9 | 23.1 | 22.6 | g | 0.4344 | 0.7 | 9.9 | 32.3 | 183 | |
| 15:55:43.95 | +11:11:56.7 | 21.4 | 19.6 | 18.9 | g | 0.4343 | 0.8 | 11.4 | 35.0 | 198 | |
| 15:55:42.94 | +11:10:47.6 | 23.6 | 22.1 | 21.5 | g | 0.4329 | 0.6 | 10.2 | 36.8 | 207 | |
| 15:55:39.87 | +11:11:46.8 | 24.3 | 23.3 | 23.4 | g | 0.4347 | 0.0 | 8.7 | 51.9 | 293 | |
| 15:55:46.15 | +11:10:54.1 | 22.5 | 21.1 | 20.6 | g | 0.4328 | 0.5 | 10.5 | 54.8 | 308 | |
| 15:55:46.69 | +11:11:07.7 | 23.1 | 22.3 | 22.2 | g | 0.4332 | 0.0 | 9.1 | 56.1 | 316 | |
| 15:55:47.25 | +11:11:16.0 | 22.3 | 20.6 | 20.0 | g | 0.4328 | 0.7 | 11.0 | 62.4 | 351 | |
| 15:55:42.66 | +11:12:29.8 | 23.4 | 22.1 | 21.9 | g | 0.4335 | 0.3 | 9.6 | 65.7 | 370 | |
| 15:55:42.53 | +11:12:30.2 | 24.5 | 22.8 | 22.4 | g | 0.4339 | 0.5 | 9.8 | 66.3 | 374 | |
| 15:55:37.79 | +11:10:51.4 | 24.3 | 23.0 | 22.8 | g | 0.4344 | 0.3 | 9.3 | 84.0 | 474 | |
| 15:55:44.56 | +11:09:57.9 | 24.4 | 23.0 | 22.7 | g | 0.4327 | 0.4 | 9.5 | 89.3 | 503 | |
| ⋮ | ⋮ | ⋮ | ⋮ | ⋮ | ⋮ | ⋮ | ⋮ | ⋮ | ⋮ | ⋮ | ⋮ |
| 15:55:44.49 | +11:09:19.3 | 22.8 | 21.7 | 21.4 | g | 0.3531 | 0.4 | 9.7 | 126.8 | 630 | |
| 15:56:02.12 | +11:12:44.1 | 22.7 | 21.6 | 21.3 | g | 0.3537 | 0.4 | 9.8 | 291.8 | 1451 | |
| 15:55:29.10 | +11:05:37.7 | 24.3 | 23.3 | 23.2 | g | 0.3547 | 0.1 | 8.6 | 402.8 | 2007 | |
| 15:55:47.81 | +11:04:41.8 | 22.8 | 21.9 | 21.6 | g | 0.3596 | 0.4 | 9.6 | 408.6 | 2054 | |
| 15:55:41.14 | +11:03:51.8 | 21.2 | 19.5 | 18.8 | g | 0.3580 | 0.8 | 11.2 | 453.4 | 2273 | |
| 15:56:13.90 | +11:09:06.0 | 24.1 | 23.3 | 23.4 | g | 0.3590 | 0.0 | 8.5 | 474.8 | 2384 | |
| 15:55:24.61 | +11:18:04.5 | 22.2 | 20.7 | 20.3 | g | 0.3538 | 0.6 | 10.4 | 483.4 | 2405 | |
| 15:55:12.93 | +11:17:48.8 | 21.9 | 20.9 | 20.6 | g | 0.3542 | 0.4 | 10.0 | 586.6 | 2920 | |
| 15:55:52.15 | +11:21:42.4 | 20.6 | 19.4 | 18.9 | g | 0.3531 | 0.6 | 11.0 | 632.4 | 3142 | |
| ⋮ | ⋮ | ⋮ | ⋮ | ⋮ | ⋮ | ⋮ | ⋮ | ⋮ | ⋮ | ⋮ | ⋮ |
| Other redshifts | |||||||||||
| 15:55:07.77 | +11:01:42.3 | 21.1 | 19.8 | 19.3 | g | 0.0017 | 1.2 | 5.8 | 780.0 | 28 | |
| 15:55:46.11 | +11:11:49.4 | 23.5 | 22.9 | 22.8 | g | 0.1022 | 0.3 | 7.8 | 51.6 | 97 | |
| 15:55:44.01 | +11:11:09.1 | 23.1 | 22.6 | 22.3 | g | 0.3892 | 0.3 | 9.3 | 20.8 | 110 | |
| ⋮ | ⋮ | ⋮ | ⋮ | ⋮ | ⋮ | ⋮ | ⋮ | ⋮ | ⋮ | ⋮ | ⋮ |
3 Discovery and redshift of the group hosting
OpticalX-ray spectra of exhibit no detected emission lines, preventing systemic redshift measurements (Landoni et al., 2014). The lack of a precise redshift measurement complicates the interpretation of absorption features in the spectrum of due to an inability to differentiate intervening IGM/CGM systems from associated absorption. Previous estimates of the redshift of based on the detection of intervening H I Ly absorption (e.g. Danforth et al., 2010) and the shape of its -ray spectrum (e.g. Abramowski et al., 2015) imply .
Blazars are typically hosted by luminous elliptical galaxies (e.g. Urry et al., 2000) in massive groups (e.g. Wurtz et al., 1997). Moreover, is a high energy peaked blazar which are thought to arise from beamed FR-I radio galaxies (e.g. Rector et al., 2000). exhibits a complex, one-sided radio-jet morphology (see Figure 2; Rector et al., 2003), indicating disturbance by a hot intragroup or intracluster medium. Identification of the blazar’s host group therefore represents a precise means of inferring its redshift (e.g. Rovero et al., 2016; Farina et al., 2016).
To identify the host group of , the top panel of Figure 3 displays the redshift histogram for galaxies of from our survey at and proper kpc (pkpc) from the blazar sightline. With high completeness levels of , , and % for galaxies of and respectively at pkpc and , our redshift survey is sensitive to galaxy groups over the full range of possible systemic redshifts for . The only significant overdensity with multiple luminous galaxies near the blazar sightline is at , a strong indication that the blazar is a member of the group.
The blazar host group consists of () members of at (1000) pkpc from the blazar and exhibits a light-weighted redshift of . Not including the blazar host, the total stellar mass (luminosity) of the group is () with () coming from three massive, quiescent galaxies of . The measured line-of-sight velocity dispersion of the group is , which corresponds to an estimated dynamical mass of . Such a massive group is consistent with expectations for the environment of blazars like . Assuming that the luminosity of the blazar host galaxy is (Urry et al., 2000), the group light-weighted center is E. (70 pkpc) and N. (40 pkpc) of the blazar position.

The presence/absence of H I Ly absorption in the blazar spectrum as a function of redshift can be used for an independent estimate of the blazar redshift. The archival COS spectrum of enables searches for H I Ly absorption at Å which corresponds to a maximum redshift of . In this wavelength range, the is sufficient to detect absorbers of Å at significance. The spectrum reveals Ly absorbers at implying but none over the similar interval of (bottom left panel of Figure 3).
To quantify the redshift constraint on from the Ly forest with objects of similar luminosity, we identified available QSOs with measured systemic redshifts, archival COS spectra, and IGM absorption line identifications from Danforth et al. (2016). For each QSO, we computed the difference between the systemic redshift and that of the highest redshift H I Ly line with Å in the spectrum, . The resulting distribution is shown in the bottom right panel of Figure 3. When combined with the highest redshift Ly line in the spectrum of at ( 50 pMpc from where the UV background dominates), this distribution implies a 95% confidence interval for the redshift of of , consistent with membership of the galaxy group. This constraint assumes that blazars and QSOs reside in similar intergalactic environments and is subject to small number statistics in the wings of the distribution. It will be further tested with new HST NUV spectra (PI: Muzahid, PID: 15835) for improved Ly searches.
4 Implications for the WHIM
4.1 The origins of candidate WHIM X-ray absorbers
Nicastro et al. (2018) identified two candidate WHIM O VII absorbers at and in the XMM spectrum of , suggesting that the hot phase of the IGM is metal-rich and potentially closing the missing baryon problem. Neither O VII candidate is detected in O VI, O VIII, or lower ionization metal ions, similar to recent non-detections in an X-ray emitting cosmic filament (Connor et al., 2019). Here, we discuss the origins of these WHIM candidates based on our redshift survey.
As discussed in Section 3, is most likely a member of a galaxy group at . The identified O VII system at is therefore associated with the blazar environment and cannot be used in cosmic baryon censuses.
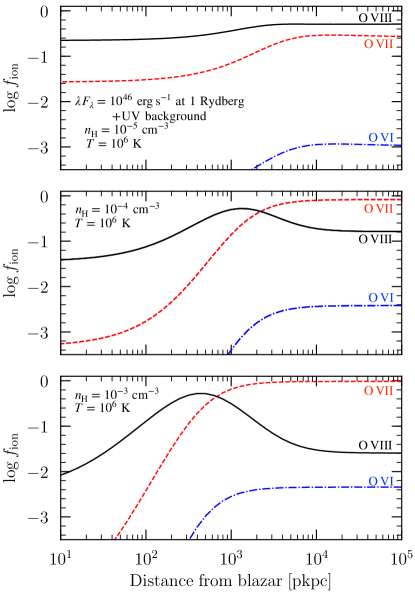
The blazar host group is part of a larger scale overdensity consisting of three additional groups at pMpc S.E., pMpc N.W., and pMpc E.S.E. from the blazar. The O VII candidate could be due to WHIM from this overdensity, but photoionization from the blazar and UV background would be important. To evaluate the feasibility of the WHIM interpretation under these circumstances, we ran a series of Cloudy (Ferland et al., 2017) models to calculate the equilibrium O VI, O VII, and O VIII ion fractions as a function of distance from the blazar for gas with and temperatures of K including photoionization from the blazar ( at Rydberg and UV spectral slope of based the COS spectrum) and UV background (Khaire & Srianand, 2019) as shown in Figure 4.
Nicastro et al. (2018) demonstrated that the O VII detection and O VI/O VIII non-detections at require a gas temperature of K with little contribution from photoionization. This rules out WHIM gas with at any distance from the blazar because photoionization by the UV background is significant at such low densities (see Figure 4; Wijers et al., 2019). Denser hot gas of () can reproduce the absorber properties but only at () pMpc from the blazar (see Figure 4). The O VII candidate is, therefore, unlikely to be due to low-density WHIM but may arise from hot CGM or intragroup medium (Mulchaey et al., 1996) in the blazar environment.
The O VII candidate resides in a comparatively isolated region with no galaxies at pkpc from the sightline within from the absorber redshift despite completeness levels for galaxies of . The nearest galaxy to the sightline is a star-forming galaxy of at and pkpc or its virial radius (estimated with the stellar-to-halo mass relation from Kravtsov et al. (2018) and virial radius definition from Bryan & Norman (1998)). The nearest massive galaxy has a stellar mass of and is at pkpc or its virial radius. The candidate could be due to an undetected dwarf in principle, but surveys of the CGM/IGM around dwarfs (Johnson et al., 2017) indicate that metal absorption systems are rare beyond the virial radius, and dwarfs are not expected to maintain a hot halo (e.g. Correa et al., 2018).
To determine whether strong O VII systems are expected from the WHIM in isolated environments, we calculated the fraction of predicted strong O VII absorbers as a function of environment using WHIM predictions (Wijers et al., 2019) from the EAGLE cosmological hydrodynamical simulations (Schaye et al., 2015; Crain et al., 2015; McAlpine et al., 2016). We calculated column densities within simulation slices and cross-correlated with galaxies as a function stellar mass and projected distance. In total, only % of the predicted, comparably strong O VII () systems occur in similarly isolated environments ( pkpc to the nearest galaxy of ). While the model predictions are subject to non-negligible uncertainties due to treatment of peculiar velocities and feedback, we nevertheless conclude that strong O VII WHIM systems are not expected to be common in isolated environments. Moreover, Bonamente (2018) estimated a 4% probability that the O VII candidate arises from noise fluctuations.
We conclude that neither of the two candidate O VII absorbers in the spectrum of are of confident and unbiased intergalactic origin. This implies a 95% upper limit on the number of WHIM O VII absorbers with mÅ per unit redshift of . The lack of strong WHIM X-ray absorption systems suggests that metal enrichment is primarily confined to galaxy halos and their immediate outskirts. This is consistent with the EAGLE simulations which predict that most strong O VII systems arise from metal rich () gas at over-densities of (see Wijers et al., 2019). Further exploration of the relationship between the WHIM and galaxies requires metallicity independent probes.
4.2 The origins of broad H I Ly systems
While metallicity independent probes of the hot IGM are not currently available (except via stacking), broad H I absorbers ( ) can be used to trace metal poor, warm IGM. While temperature measurements are not possible for most broad H I systems due to lack of detected metals, Savage et al. (2014) found that of broad H I absorbers with well aligned O VI detections exhibit warm-hot temperatures of . Danforth et al. (2010) identified 12 broad H I absorbers in the COS spectrum of at from the blazar redshift. None of the broad H I absorbers are coincident with detected galaxies at . However, all are coincident with at least one luminous galaxy of within with a median projected distance to the closest one of pkpc. In contrast, narrow ( ; K) H I absorption systems detected toward are further from luminous galaxies on average with a median distance to the nearest one of pkpc while O VI absorbers are closer to luminous galaxies ( pkpc; Johnson et al., 2013; Pratt et al., 2018).
4.3 Summary and conclusions
Based on deep and highly complete redshift surveys in the field of we found that:
-
1.
Neither of the two candidate O VII WHIM systems reported toward the sightline (Nicastro et al., 2018) are of confident and unbiased intergalactic origin. The origins, state, and cosmological mass density of the hot IGM therefore remain uncertain.
-
2.
Low metallicity warm IGM traced by broad H I Ly absorbers occur further from luminous () galaxies than O VI absorbers on average, but closer than cool IGM traced by narrow Ly.
Our findings are consistent with gravitational collapse heating portions of the IGM to form the WHIM. However, they also suggest that feedback is ineffective at enriching the low- IGM far beyond galaxy/group halos to levels currently observable in UV and X-ray metal ions. Indeed, Liang & Chen (2014) and Johnson et al. (2015) placed upper limits on the mean metallicity of the IGM of and pristine () gas can be found even around massive galaxies (Chen et al., 2019). These observations highlight the need for a variety of WHIM probes coupled with deep galaxy surveys.
Acknowledgements
We are grateful to J. Nevalainen, F. Nicastro, and M. Petropoulou for insightful comments. SDJ is supported by a NASA Hubble Fellowship (HST-HF2-51375.001-A). MRD acknowledges support from the Dunlap Institute at the University of Toronto and the Canadian Institute for Advanced Research (CIFAR). J.C.C. acknowledges support by the National Science Foundation under Grant No. AST-1517816. Based on observations from the Magellan, the NOAO Mayall, and NASA/ESA Hubble Telescopes. The authors are honored to conduct research on Iolkam Duág (Kitt Peak), a mountain with particular significance to the Tohono Oódham. We made use of the NASA Astrophysics Data System.
References
- Abramowski et al. (2015) Abramowski, A., Aharonian, F., Ait Benkhali, F., et al. 2015, ApJ, 802, 65, doi: 10.1088/0004-637X/802/1/65
- Bannister et al. (2019) Bannister, K. W., Deller, A. T., Phillips, C., et al. 2019, Science, 365, 565. https://arxiv.org/abs/1906.11476
- Becker et al. (1995) Becker, R. H., White, R. L., & Helfand, D. J. 1995, ApJ, 450, 559, doi: 10.1086/176166
- Bonamente (2018) Bonamente, M. 2018, arXiv e-prints. https://arxiv.org/abs/1810.02207
- Bryan & Norman (1998) Bryan, G. L., & Norman, M. L. 1998, ApJ, 495, 80, doi: 10.1086/305262
- Burchett et al. (2019) Burchett, J. N., Tripp, T. M., Prochaska, J. X., et al. 2019, ApJ, 877, L20, doi: 10.3847/2041-8213/ab1f7f
- Cen & Ostriker (1999) Cen, R., & Ostriker, J. P. 1999, ApJ, 514, 1, doi: 10.1086/306949
- Chabrier (2003) Chabrier, G. 2003, PASP, 115, 763, doi: 10.1086/376392
- Chen & Mulchaey (2009) Chen, H.-W., & Mulchaey, J. S. 2009, ApJ, 701, 1219, doi: 10.1088/0004-637X/701/2/1219
- Chen et al. (2019) Chen, H.-W., Johnson, S. D., Straka, L. A., et al. 2019, MNRAS, 484, 431, doi: 10.1093/mnras/sty3513
- Connor et al. (2019) Connor, T., Zahedy, F. S., Chen, H.-W., et al. 2019, arXiv e-prints, arXiv:1909.10518. https://arxiv.org/abs/1909.10518
- Correa et al. (2018) Correa, C. A., Schaye, J., Wyithe, J. S. B., et al. 2018, MNRAS, 473, 538, doi: 10.1093/mnras/stx2332
- Crain et al. (2015) Crain, R. A., Schaye, J., Bower, R. G., et al. 2015, MNRAS, 450, 1937, doi: 10.1093/mnras/stv725
- Danforth et al. (2010) Danforth, C. W., Keeney, B. A., Stocke, J. T., Shull, J. M., & Yao, Y. 2010, ApJ, 720, 976, doi: 10.1088/0004-637X/720/1/976
- Danforth et al. (2016) Danforth, C. W., Keeney, B. A., Tilton, E. M., et al. 2016, ApJ, 817, 111, doi: 10.3847/0004-637X/817/2/111
- de Graaff et al. (2019) de Graaff, A., Cai, Y.-C., Heymans, C., & Peacock, J. A. 2019, A&A, 624, A48, doi: 10.1051/0004-6361/201935159
- Farina et al. (2016) Farina, E. P., Fumagalli, M., Decarli, R., & Fanidakis, N. 2016, MNRAS, 455, 618, doi: 10.1093/mnras/stv2277
- Ferland et al. (2017) Ferland, G. J., Chatzikos, M., Guzmán, F., et al. 2017, Rev. Mexicana Astron. Astrofis., 53, 385. https://arxiv.org/abs/1705.10877
- Frank et al. (2018) Frank, S., Pieri, M. M., Mathur, S., Danforth, C. W., & Shull, J. M. 2018, MNRAS, 476, 1356, doi: 10.1093/mnras/sty294
- Green et al. (2012) Green, J. C., Froning, C. S., Osterman, S., et al. 2012, ApJ, 744, 60, doi: 10.1088/0004-637X/744/1/60
- Johnson et al. (2013) Johnson, S. D., Chen, H.-W., & Mulchaey, J. S. 2013, MNRAS, 434, 1765, doi: 10.1093/mnras/stt1137
- Johnson et al. (2015) —. 2015, MNRAS, 449, 3263, doi: 10.1093/mnras/stv553
- Johnson et al. (2017) Johnson, S. D., Chen, H.-W., Mulchaey, J. S., Schaye, J., & Straka, L. A. 2017, ApJ, 850, L10, doi: 10.3847/2041-8213/aa9370
- Keeney et al. (2018) Keeney, B. A., Stocke, J. T., Pratt, C. T., et al. 2018, ApJS, 237, 11, doi: 10.3847/1538-4365/aac727
- Khaire & Srianand (2019) Khaire, V., & Srianand, R. 2019, MNRAS, 484, 4174, doi: 10.1093/mnras/stz174
- Kravtsov et al. (2018) Kravtsov, A. V., Vikhlinin, A. A., & Meshcheryakov, A. V. 2018, Astronomy Letters, 44, 8, doi: 10.1134/S1063773717120015
- Landoni et al. (2014) Landoni, M., Falomo, R., Treves, A., & Sbarufatti, B. 2014, A&A, 570, A126, doi: 10.1051/0004-6361/201424232
- Liang & Chen (2014) Liang, C. J., & Chen, H.-W. 2014, MNRAS, 445, 2061, doi: 10.1093/mnras/stu1901
- Loveday et al. (2012) Loveday, J., Norberg, P., Baldry, I. K., et al. 2012, MNRAS, 420, 1239, doi: 10.1111/j.1365-2966.2011.20111.x
- McAlpine et al. (2016) McAlpine, S., Helly, J. C., Schaller, M., et al. 2016, Astronomy and Computing, 15, 72, doi: 10.1016/j.ascom.2016.02.004
- Mulchaey et al. (1996) Mulchaey, J. S., Mushotzky, R. F., Burstein, D., & Davis, D. S. 1996, ApJ, 456, L5, doi: 10.1086/309861
- Nelson et al. (2018) Nelson, D., Kauffmann, G., Pillepich, A., et al. 2018, MNRAS, 477, 450, doi: 10.1093/mnras/sty656
- Nevalainen et al. (2019) Nevalainen, J., Tempel, E., Ahoranta, J., et al. 2019, A&A, 621, A88, doi: 10.1051/0004-6361/201833109
- Nicastro et al. (2016) Nicastro, F., Senatore, F., Gupta, A., et al. 2016, MNRAS, 458, L123, doi: 10.1093/mnrasl/slw022
- Nicastro et al. (2018) Nicastro, F., Kaastra, J., Krongold, Y., et al. 2018, Nature, 558, 406, doi: 10.1038/s41586-018-0204-1
- Pachat et al. (2017) Pachat, S., Narayanan, A., Khaire, V., et al. 2017, MNRAS, 471, 792, doi: 10.1093/mnras/stx1435
- Pratt et al. (2018) Pratt, C. T., Stocke, J. T., Keeney, B. A., & Danforth, C. W. 2018, ApJ, 855, 18, doi: 10.3847/1538-4357/aaaaac
- Prochaska et al. (2011) Prochaska, J. X., Weiner, B., Chen, H.-W., Cooksey, K. L., & Mulchaey, J. S. 2011, ApJS, 193, 28, doi: 10.1088/0067-0049/193/2/28
- Qu & Bregman (2016) Qu, Z., & Bregman, J. N. 2016, ApJ, 832, 189, doi: 10.3847/0004-637X/832/2/189
- Rahmati et al. (2016) Rahmati, A., Schaye, J., Crain, R. A., et al. 2016, MNRAS, 459, 310, doi: 10.1093/mnras/stw453
- Ravi et al. (2019) Ravi, V., Catha, M., D’Addario, L., et al. 2019, Nature, 572, 352. https://arxiv.org/abs/1907.01542
- Rector et al. (2003) Rector, T. A., Gabuzda, D. C., & Stocke, J. T. 2003, AJ, 125, 1060, doi: 10.1086/367802
- Rector et al. (2000) Rector, T. A., Stocke, J. T., Perlman, E. S., Morris, S. L., & Gioia, I. M. 2000, AJ, 120, 1626, doi: 10.1086/301587
- Rovero et al. (2016) Rovero, A. C., Muriel, H., Donzelli, C., & Pichel, A. 2016, A&A, 589, A92, doi: 10.1051/0004-6361/201527778
- Savage et al. (2014) Savage, B. D., Kim, T.-S., Wakker, B. P., et al. 2014, ApJS, 212, 8, doi: 10.1088/0067-0049/212/1/8
- Schaye et al. (2015) Schaye, J., Crain, R. A., Bower, R. G., et al. 2015, MNRAS, 446, 521, doi: 10.1093/mnras/stu2058
- Shull et al. (2012) Shull, J. M., Smith, B. D., & Danforth, C. W. 2012, ApJ, 759, 23, doi: 10.1088/0004-637X/759/1/23
- Turner et al. (2014) Turner, M. L., Schaye, J., Steidel, C. C., Rudie, G. C., & Strom, A. L. 2014, MNRAS, 445, 794, doi: 10.1093/mnras/stu1801
- Urry et al. (2000) Urry, C. M., Scarpa, R., O’Dowd, M., et al. 2000, ApJ, 532, 816, doi: 10.1086/308616
- Wijers et al. (2019) Wijers, N. A., Schaye, J., Oppenheimer, B. D., Crain, R. A., & Nicastro, F. 2019, MNRAS, 488, 2947. https://arxiv.org/abs/1904.01057
- Wurtz et al. (1997) Wurtz, R., Stocke, J. T., Ellingson, E., & Yee, H. K. C. 1997, ApJ, 480, 547, doi: 10.1086/304006