Energy-dependent morphology of the pulsar wind nebula HESS J1825-137 seen by Fermi-LAT
Abstract:
Taking advantage of 10 years of Fermi-LAT data, we perform a new and deep analysis of the pulsar wind nebula (PWN) HESS J1825-137. We present the results of the spectral analysis and of the first energy-resolved morphological study of the PWN HESS J1825-137 from 1 GeV to 1 TeV. This PWN is an archetypal system making it a perfect laboratory for studying particle transport mechanisms. Combining this analysis with recent HESS results enables a more complete picture of the nebula to emerge.
1 Introduction
The core collapse of a massive star may create a rapidly rotating and magnetized neutron star (pulsar), which can emit a wind of relativistic, charged particles with luminosity around erg s-1. Confinement of these outflows generates luminous pulsar wind nebula (PWN). The composite supernova remnant (SNR) is charcterized by the evolution of this PWN inside the interior region of the collapsed star[1]. While the majority of these objects maintain a spherical symmetry during the early-stage evolution [2], the composite system is particularly interesting when its relic PWN tends to form complex structure during the late-stage devolopment. Evolved PWNe, due to their large -ray extension and possible energy-dependent morphology are ideal candidates for investigating particle transport mechanisms inside celestial objects.
Among such objects, HESS J1825-137 is the largest and one of the most TeV efficient -ray emitting PWN currently known [3, 4]. It is powered by a young and very energetic pulsar PSR J1826-1334 (also known as PSR B1823-13), which was discovered in 1992 [5]. The pulsar has characteristics very similar to the Vela pulsar: it has a spin period of 101.48 ms, a characteristic age of 21 kyr, a spin-down energy of 2.8 erg s-1 and it is situated at a distance of 3.90.4 kpc [6]. The PWN HESS J1825-137 presents an asymmetric emission, towards the south of the pulsar location, which has been suggested to be caused by the interaction of the progenitor SNR with molecular clouds north of the pulsar leading to a reverse shock interaction early in the system evolution. The discovery of the energy-dependent morphology of the PWN HESS J1825-137 at TeV energies [7] indicates that the emission is dominated by ‘relic’ electrons from the earlier epochs of the nebula in which the pulsar was spinning down more rapidly, therefore releasing more energy into the system.
In the GeV regime, the source was first detected in 2011 by the Large Area Telescope (LAT) [8], on board the Fermi Gamma-ray Space Telescope. Previous LAT analyses of the PWN HESS J1825-137 have been performed using 20 months of data in the 1 – 100 GeV energy band [9] and subsequently 6 years of data in the 10 GeV – 1 TeV energy band [10]. Despite the LAT energy threshold of 20 MeV, the source is not resolved in the MeV range [11].
Taking advantage of the large amount of available Fermi-LAT data, an analysis of the energy-resolved morphology and spectral parameters of this source is performed using 10 years of LAT data in the energy range between 1 GeV and 1 TeV.
2 Fermi data and analysis
For the analysis, we use 10 years (between August 4, 2008 and August 3, 2018) of Pass 8 Source class events [12] in the energy range between 1 GeV and 1 TeV. The data are taken in a region of interest (ROI) of radius 15∘ and centered on the PWN position given in [10]. The P8R2_Source_V6 instrument response functions (IRFs) are used. In order to eliminate most of the contamination from secondary -rays from the Earth’s limb [13], we exclude -rays with zenith angle larger than 105∘.
The analysis is performed with Fermipy111http://fermipy.readthedocs.io/en/latest/ [14], a python package that facilitates analysis of data from the LAT with the Fermi Science Tools, of which the version 11-07-00 is used. We estimate the general parameters of the source (localization, averaged extension and spectra) using the complete energy range between 1 GeV and 1 TeV. The model used to describe the sky in this ROI includes all point-like and extended LAT sources within 20∘ from the PWN position listed in the FL8Y222https://fermi.gsfc.nasa.gov/ssc/data/access/lat/fl8y/gll_psc_8year_v5.fit list, as well as the Galactic diffuse [15] and isotropic emission. We model the source using a 2D-Gaussian model for the spatial template and a LogParabola spectral model [10].
3 The PWN HESS J1825-137
3.1 Localization and averaged extension analysis
After a preliminary optimization of the parameters of the sources included in the model, we perform the localization and extension analysis first in the entire energy range: 1 GeV–1 TeV. The source is not significantly detected below 3 GeV, therefore figure 1 shows the excess map of the region around the PWN for the energy range between 3 GeV and 1 TeV. In the map, the size obtained for the PWN in this work is compared with the radius obtained in the previous analyses with Fermi-LAT data.
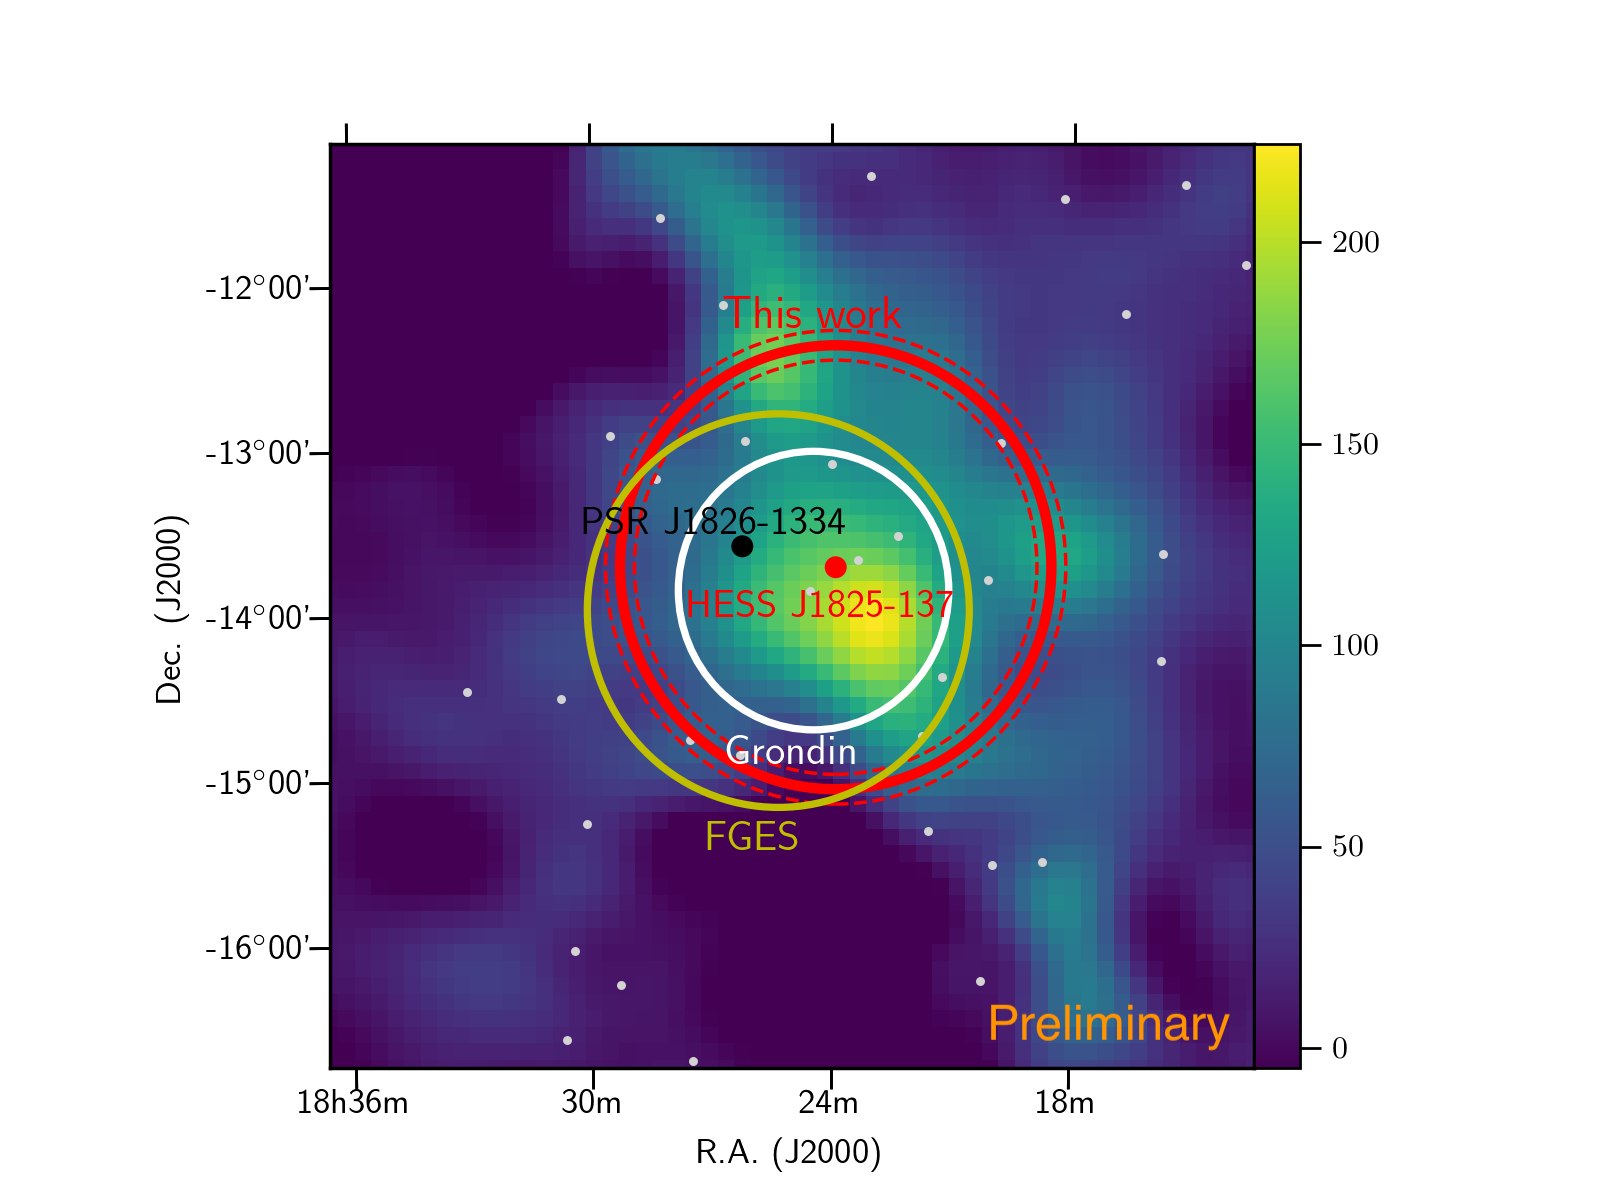
Table 1 reports the results of the localization and extension analysis performed in the energy range between 1 GeV and 1 TeV using a 2D-Gaussian model as spatial template for the source. The extension result reported here corresponds to the 68% containment radius.
| Position | Value |
|---|---|
| RA | |
| DEC | |
| Extension (1 GeV-1 TeV) | |
| Test Statistic (TS) | 992 |
The resulting center position of the PWN is shifted by about 0.58∘ from PSR J1826-1334, the pulsar associated with the nebula. The interaction of the progenitor SNR with dense molecular clouds north east of the pulsar, leading to a relatively fast formation of a reverse shock on the northern side of the nebula, has been supposed to be the probable cause of the asymmetry. EVLA observation at 1.4 GHz made by [16] reveal, in fact, a nearby molecular cloud with a density of 400 cm-3, which possibly explains the asymmetric apparent shape.
3.2 Fermi-LAT Spectral Energy Distribution
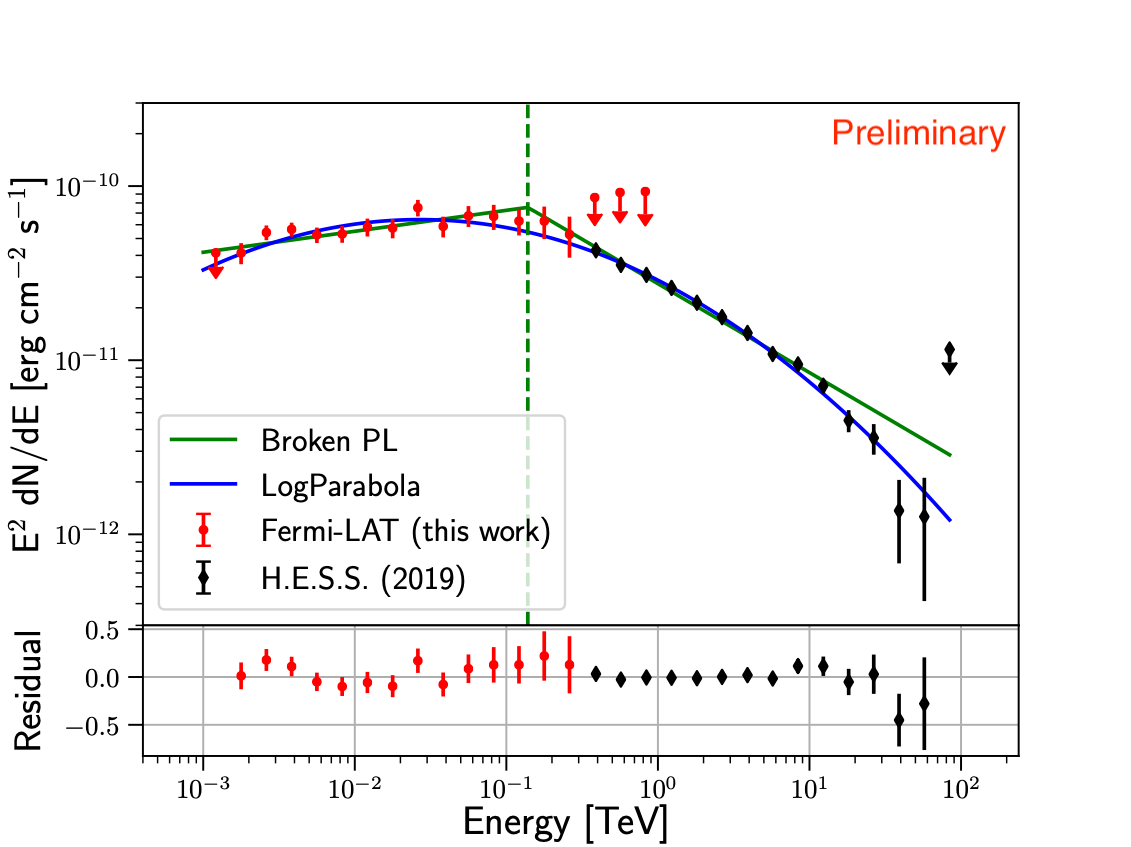
For the analysis of the source spectrum, we use the LAT data in the energy range between 1 GeV and 1 TeV. The photon events are divided in 18 logarithmically distributed energy bins. The diffuse background, as well all the sources within 2∘ of the center position of the PWN, are also fitted during the spectral analysis. The spectral energy distribution (SED) is fitted with a LogParabola model as well as with a Broken Power Law (Broken PL) model in order to better estimate the break energy. The function used for the Broken PL law is
| (1) |
In order to measure the spectra of the PWN, we perform the spectral analysis twice: after a preliminary optimization of the parameters of the sources included in the model, the spectral analysis is performed for the first time in the whole energy range 1 GeV-1 TeV. We perform the spectral analysis a second time in the various energy ranges using the resulting templates for the PWN morphology obtained from the localization and extension analysis in each energy bin (see Section 3.3).
The fit results for the LogParabola and Broken PL are reported in the “Fermi” column of Table 2. The “Fermi + H.E.S.S.” column of the Table 2 contains the resulting spectral information for the PWN HESS J1825-137 from a joint fit to the recent H.E.S.S. data [3] and energy flux derived in this work with Fermi-LAT.
| LogParabola | Broken PL | ||||
|---|---|---|---|---|---|
| Parameter | Fermi | Fermi H.E.S.S. | Parameter | Fermi | Fermi H.E.S.S. |
| 2.05 0.18 | 2.13 0.03 | 1.84 0.04 | 1.88 0.03 | ||
| 0.040 0.013 | 0.061 0.002 | 2.08 0.06 | 2.51 0.01 | ||
| (GeV) | 79 18 | 78 18 | (GeV) | 26 1 | 139 17 |
| 6.41 0.73 | 5.99 0.21 | 6.79 0.41 | 7.55 0.46 | ||
| /ndf | 9/14 | 29/28 | /ndf | 10/14 | 81/28 |
Figure 2 shows the combined SED with the results obtained in this work, using 10 years of Fermi-LAT for the 1 GeV – 1 TeV energy band, and the H.E.S.S. results for the 100 GeV – 90 TeV energy range [3].
3.3 Energy dependent analysis of HESS J1825-137
For the analysis of the energy-dependent extension the spectra of HESS J1825-137 and of the nearby sources, have been fixed to the Table 2 values. The normalization values of the isotropic and diffuse components are instead left as free parameters of the fit.
Before performing the extension analysis, the localization is again optimized inside each energy bin. The localization and extension analysis are performed in this part separately in each energy bin. We use 2 bins per decade in the 1–100 GeV band and a single bin in the 100 GeV – 1 TeV energy band. A variation of the PWN position between the different bins is observed. Moving from the lowest energy bin, 1–3 GeV, to the highest energy one, 100 GeV – 1 TeV, the fitted 2DGaussian centroid of the PWN moves toward the position of the pulsar. The extension analysis is performed by fitting a 2D-Gaussian template in each energy bin.
In the energy band between 1 and 3 GeV the source is not resolved, therefore no significant result is reported for the extension below 3 GeV. This is connected to the reduced source flux at low energy, as well as the large influence of the diffuse emission in this energy range which does not allow the source to be easily distinguished from the background. Figure 3 presents the source excess maps for each energy bin used in the energy-extent analysis.

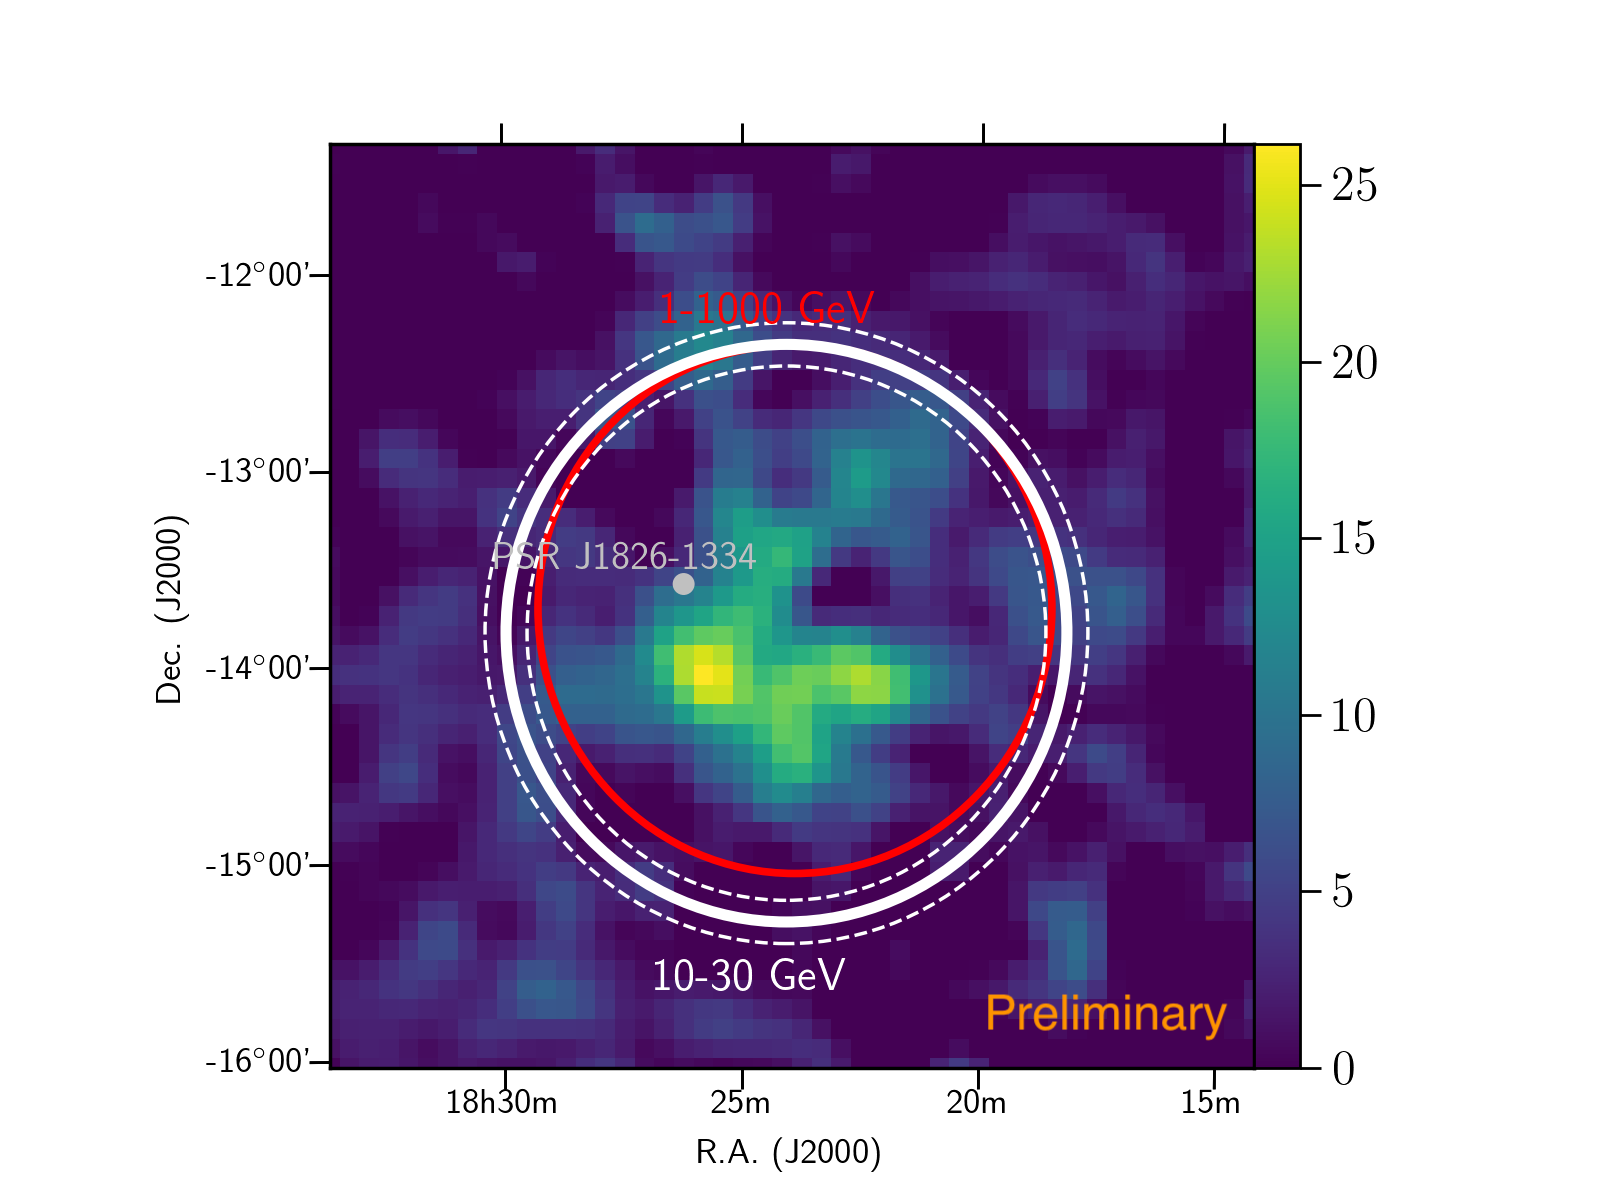
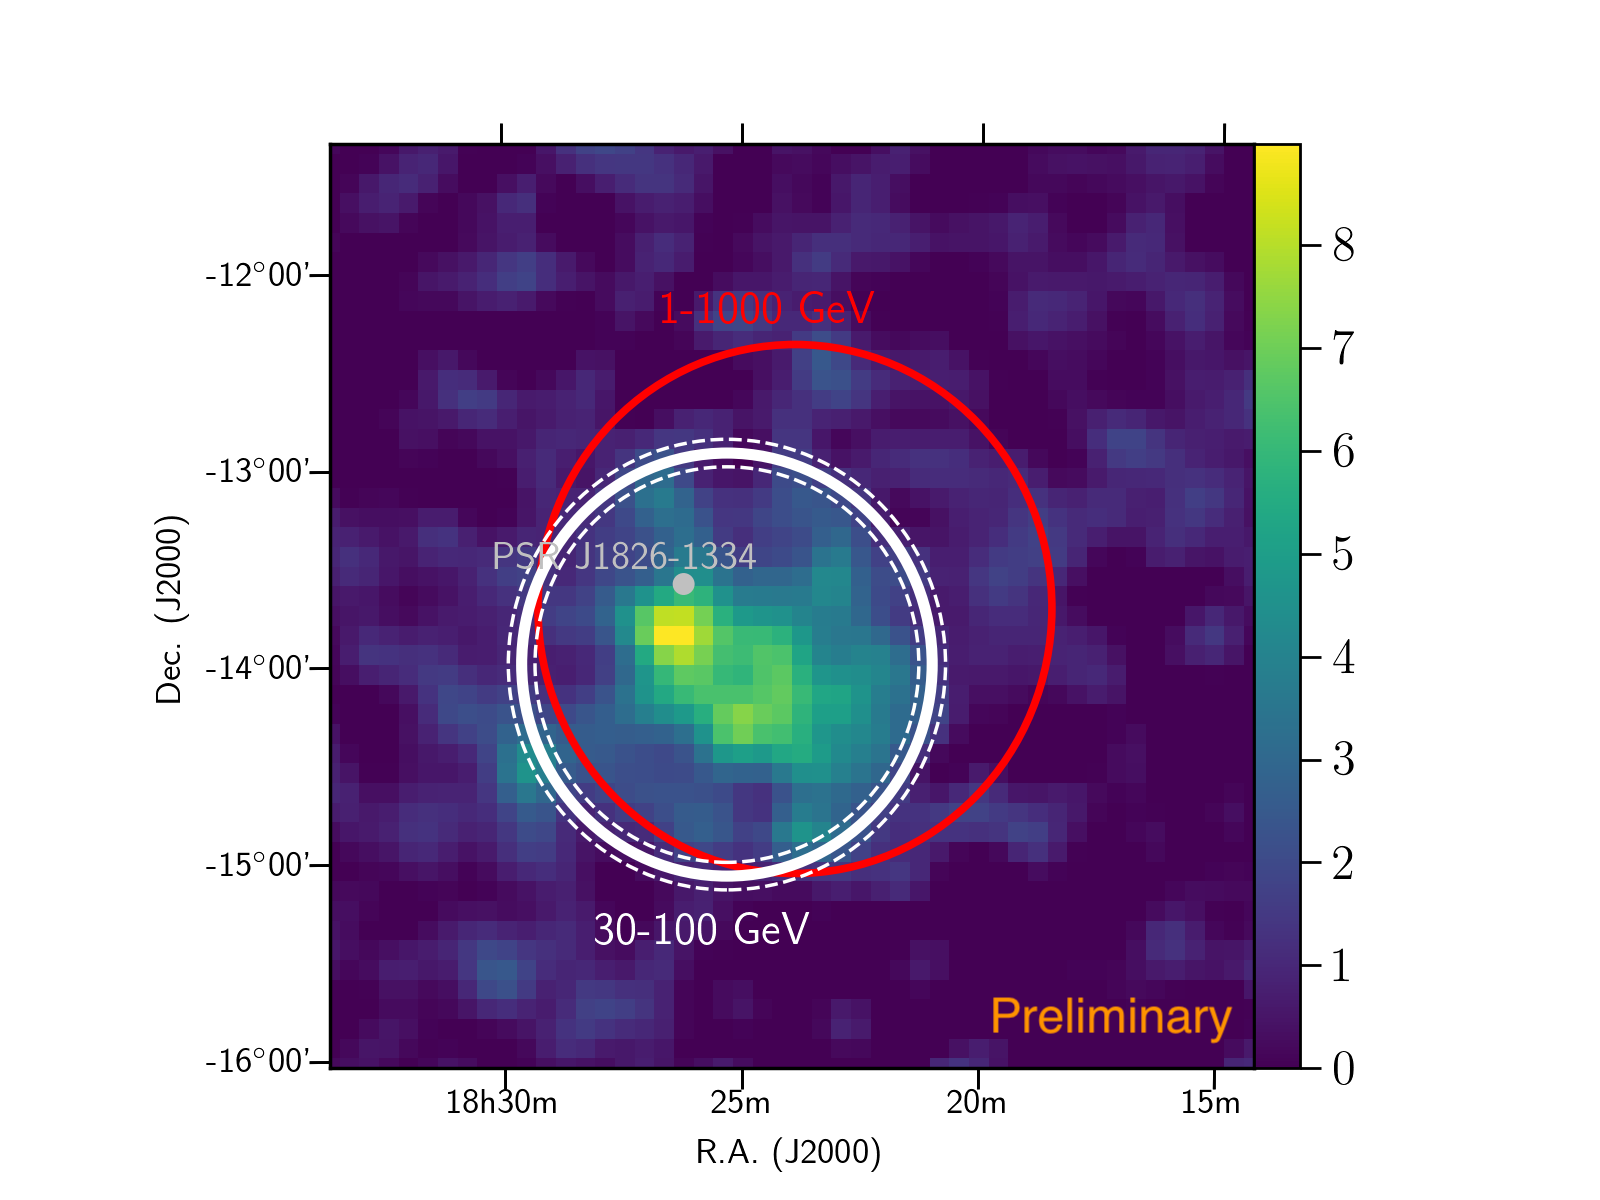
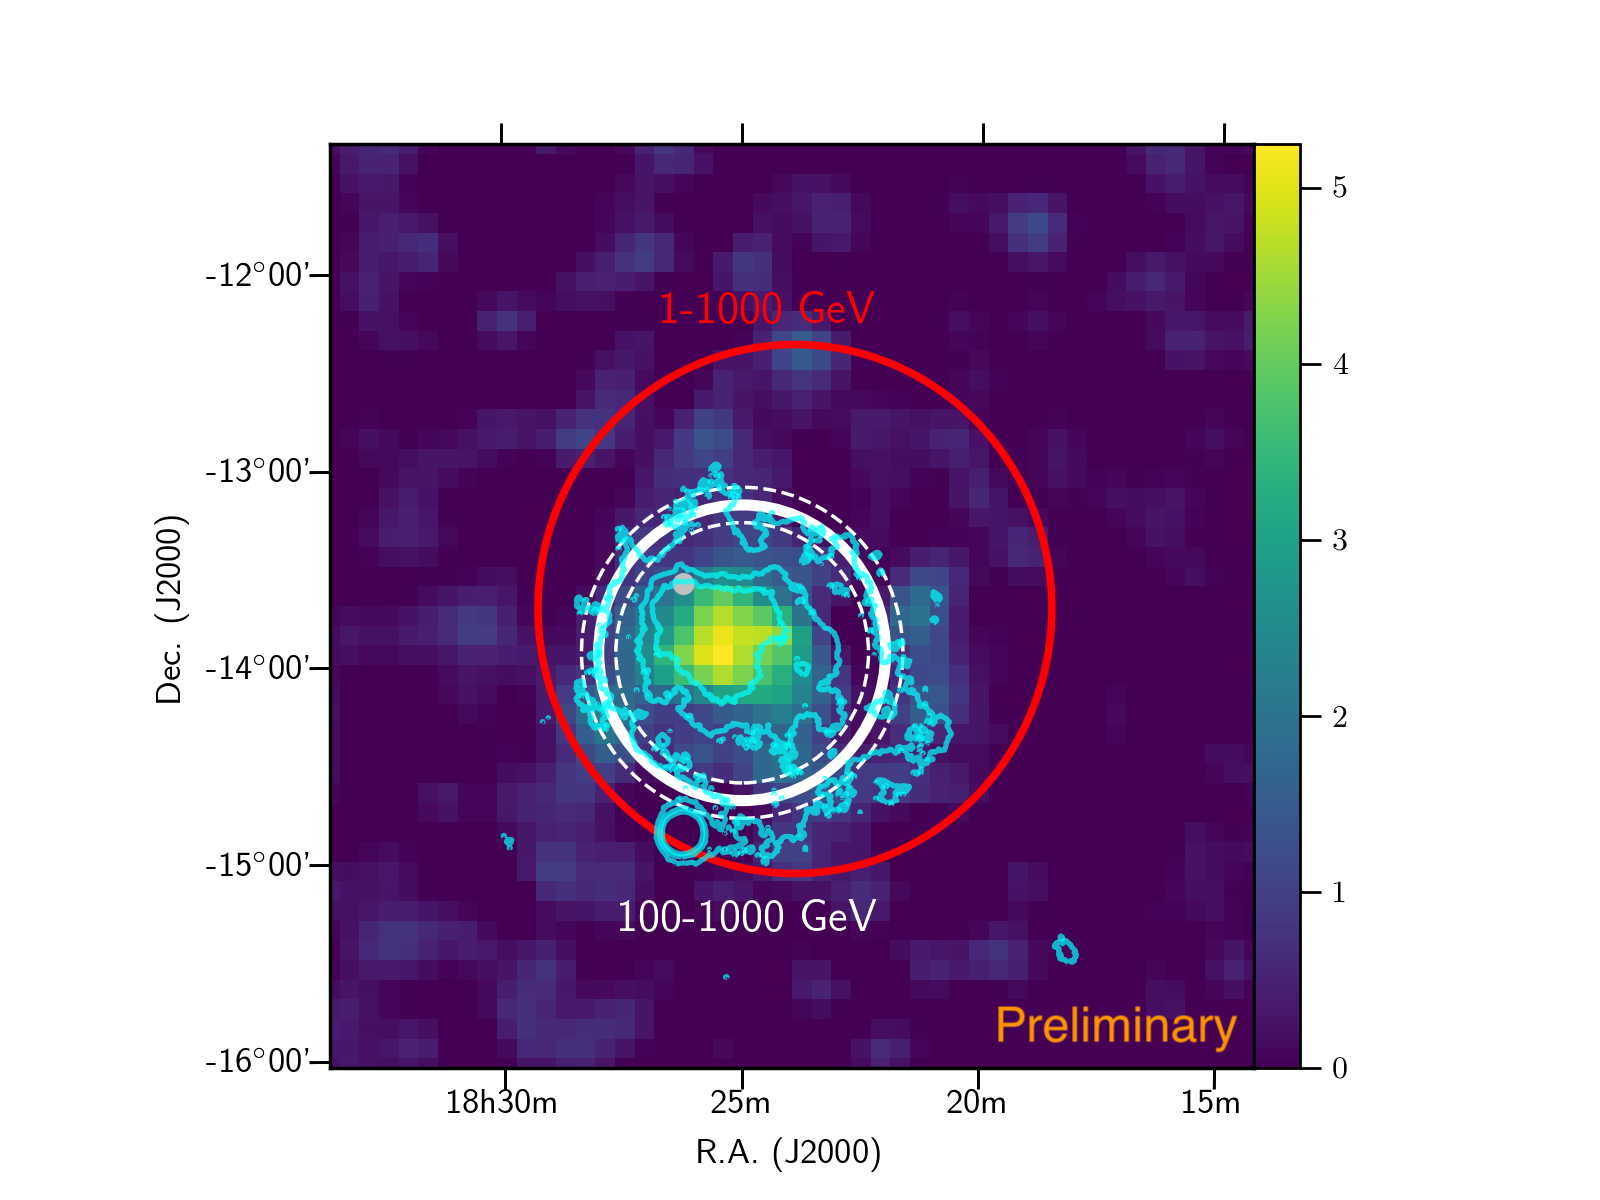
Table 3 contains the results of the extent measurements performed with the 2D-Gaussian template in 2 bins per decade in the 3–100 GeV band and in a single bin for the 100 GeV – 1 TeV band. With the extension is reported also the total error. For the estimation of systematic error , the analysis has been repeated using two different diffuse models: .
| Energy range (GeV) | Extension (∘ ) | TSext |
|---|---|---|
| 3 – 10 | 219 | |
| 10 – 32 | 234 | |
| 32 – 100 | 207 | |
| 100 – 1000 | 129 |
4 Conclusions
We have analyzed 10 years of Fermi-LAT data in the energy range between 1 GeV and 1 TeV and we have performed, for the first time with Fermi-LAT data, an energy dependent analysis of the extension of the PWN HESS J1825-137. The nebula HESS J1825-137 presents a strong energy dependent morphology. The spectral index was seen by [7] to soften with increasing distance from the PSR, this implies that the population of electrons in the nebula had travelled and cooled out to large distances. The fact that the low-energy electrons at large distances from the pulsar produce the softest spectrum was interpreted to mean that these are the oldest electrons in the system. In this work, the observation was extended low to few GeV confirming the emission at large distances by the lowest energetic particles.
Although a variation of the nebula extension is expected at TeV energy, a similar change is not expected at Fermi-LAT energies because the age of the PWN is smaller than the typical time of energy losses. We found continued morphological changes and increasing size of this PWN towards lower energies, which would be difficult to explain with a simple diffusion-energy loss process.
ACKNOWLEDGMENTS
The Fermi-LAT Collaboration acknowledges support from NASA and DOE (United States), CEA/Irfu, IN2P3/CNRS, and CNES (France), ASI, INFN, and INAF (Italy), MEXT, KEK, and JAXA (Japan), and the K.A. Wallenberg Foundation, the Swedish Research Council, and the National Space Board (Sweden).
References
- [1] Kolb, C., Blondin, J., Slane, P., et al. 2017, Astrophys. J. , (8) 44, 1
- [2] Gaensler, B. M., & Slane, P. O. 2006, Ann. Rev. Astron. & Astrophys. , (4) 4, 17
- [3] H. E. S. S. Collaboration, Abdalla, H., Aharonian, F., et al. 2019, A&A, 621, A116
- [4] H.E.S.S. Collaboration, Abdalla, H., Abramowski, A., et al. 2018, A&A, 612, A2
- [5] Clifton, T. R., Lyne, A. G., Jones, A. W., McKenna, J., & Ashworth, M. 1992, MNRAS, 254, 177
- [6] Manchester, R. N., Hobbs, G. B., Teoh, A., & Hobbs, M. 2005, AJ, 129, 1993
- [7] Aharonian, F., Akhperjanian, A. G., Bazer-Bachi, A. R., et al. 2006, A&A, 460, 365
- [8] Atwood, W. B., Abdo, A. A., Ackermann, M., et al. 2009, Astrophys. J. , (6) 97, 1071
- [9] Grondin, M.-H., Funk, S., Lemoine-Goumard, M., et al. 2011, Astrophys. J. , (7) 38, 42
- [10] Ackermann, M., Ajello, M., Baldini, L., et al. 2017, Astrophys. J. , (8) 43, 139
- [11] Principe, G., Malyshev, D., Ballet, J., et al. 2018, A&A, 618, A22
- [12] Atwood, W., Albert, A., Baldini, L., et al. 2013, arXiv:1303.3514
- [13] Abdo, A. A., Ackermann, M., Ajello, M., et al. 2009, Phys. Rev. D , (8) 0, 122004
- [14] Wood, M., Caputo, R., Charles, E., et al. 2017, International Cosmic Ray Conference, 35, 824
- [15] Ackermann, M., Ajello, M., Albert, A., et al. 2017, Astrophys. J. , (8) 40, 43
- [16] Castelletti, G., Giacani, E., & Dubner, G. 2012, Boletin de la Asociacion Argentina de Astronomia La Plata Argentina, 55, 179