Characterizing physiological and symptomatic variation in menstrual cycles using self-tracked mobile-health data
Abstract
The menstrual cycle is a key indicator of overall health for women of reproductive age. Previously, menstruation was primarily studied through survey results; however, as menstrual tracking mobile apps become more widely adopted, they provide an increasingly large, content-rich source of menstrual health experiences and behaviors over time. By exploring a database of user-tracked observations from the Clue app by BioWink of over 378,000 users and 4.9 million natural cycles, we show that self-reported menstrual tracker data can reveal statistically significant relationships between per-person cycle length variability and self-reported qualitative symptoms. A concern for self-tracked data is that they reflect not only physiological behaviors, but also the engagement dynamics of app users. To mitigate such potential artifacts, we develop a procedure to exclude cycles lacking user engagement, thereby allowing us to better distinguish true menstrual patterns from tracking anomalies. We uncover that women located at different ends of the menstrual variability spectrum, based on the consistency of their cycle length statistics, exhibit statistically significant differences in their cycle characteristics and symptom tracking patterns. We also find that cycle and period length statistics are stationary over the app usage timeline across the variability spectrum. The symptoms that we identify as showing statistically significant association with timing data can be useful to clinicians and users for predicting cycle variability from symptoms or as potential health indicators for conditions like endometriosis. Our findings showcase the potential of longitudinal, high-resolution self-tracked data to improve understanding of menstruation and women’s health as a whole.
1 Introduction
Menstruation is an important indicator of overall health and quality of life in women: the reproductive endocrine system is associated with sexual and reproductive health, bone and heart health, and cancers (55, 13, 74, 64, 20, 34, 11, 59, 49); it affects fertility (40, 23), menopause (56, 44, 57), exercise (58), and diet (12). Seminal work on variation of menstrual cycle length throughout the reproductive lifespan (9, 67) has concluded that “complete regularity in menstruation through extended time is a myth,” and recent empirical studies (61, 31, 35) have confirmed that variation between cycles, women, and populations is the norm (22, 51, 14, 18, 70, 24, 73, 69). Establishing a clear, informative, and quantitative characterization of the patterns and underlying female physiology of what has been hypothesized as “the fifth vital sign” (8, 15, 48, 52) has been a long-explored issue in women’s health, but remains an open research question (62, 63, 24), in part due to limited access to large, reliable datasets concerning menstruation.
With the rise of data-powered health, we now have the ability to identify menstrual patterns at scale and explore their relationships with a broad set of symptoms. Observational health data sources have shed light on individual clinical trajectories (37), increased self-awareness about individual health (47), and helped deliver on the promise of precision medicine (41). Mobile-health solutions enable a high-resolution view of a large, highly diverse range of individuals over time (33, 43, 6, 7) and can provide insights into chronic diseases and behaviors (21, 72, 27, 16, 25, 60, 19, 10, 66, 68). Menstrual trackers in particular have become increasingly common: they are the second most popular app for adolescent girls and the fourth most popular for adult women (71, 32). Millions of women around the world routinely track their menstrual cycles and a variety of contextual factors and symptoms, accumulating high volumes of temporal, heterogeneous data via many different apps (1, 2, 3, 5, 4). As exemplified by studies connecting the menstrual cycle to variations in women’s mood, behavior, and vital signs (54), self-tracked data can provide insights into cycle characteristics (17), ovulation timing, and the evolution of reproductive health for large populations (65), as well as empower informed decision-making through increased self-awareness (28).
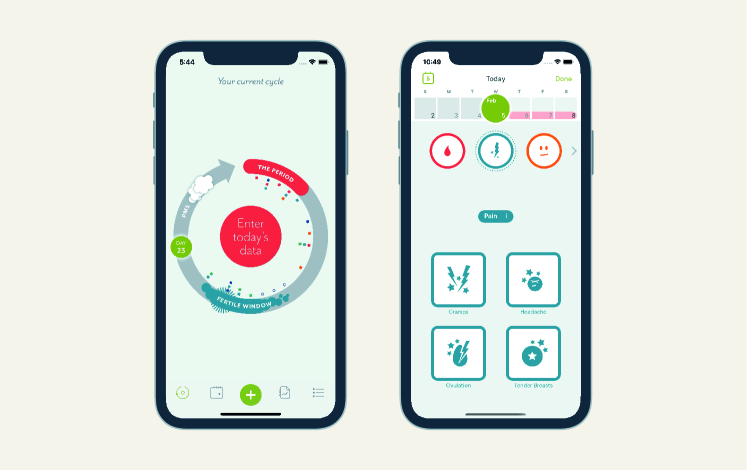
We utilize de-identified user-tracked data from Clue by BioWink (1), one of the most popular and accurate menstrual trackers worldwide (50). In addition to period data, Clue users can track symptom information in categories like exercise, pain, and sexual activity (see Figure 1). Note that Clue users are not required to specify gender—in this paper, we refer to Clue users or menstruators as ‘women,’ but we acknowledge that not all menstruators are women and vice versa. This large-scale dataset provides a high resolution, long-term view of variation in both physiology (period and cycle duration) and symptoms (e.g., pain and mood) across menstrual cycles, enabling us to study the shared information between quantitative, temporal attributes and qualitative, symptomatic attributes of menstrual experiences.
While previous work has examined how menstrual cycle characteristics like cycle and phase length vary with age and body mass index (BMI) (17), we aim instead to use the observed variability in cycle length statistics to investigate differences in symptomatic behavior between those who exhibit more or less variable cycle lengths. Namely, we seek to answer two research questions:
(1) how do cycle length characteristics for a large, self-tracked user population differ among groups of users?; and (2) how do users who fall at different ends of the cycle length variability spectrum self-track their menstrual symptoms?
To this end, we select users from the Clue dataset aged 21-33 (because menstrual cycle lengths are relatively less variable and cycles are more likely to be ovulatory during this age interval (67, 22, 30, 69, 36)) with natural menstrual cycles (i.e., no hormonal birth control or intrauterine device (IUD)). We define a menstrual cycle as the span of days from the first day of a period through to and including the day before the first day of the next period (69). A period consists of sequential days of bleeding (greater than spotting and within ten days after the first greater-than-spotting bleeding event) unbroken by no more than one day on which only spotting or no bleeding occurred.
In this paper, we take symptom tracking behavior to be a proxy for true physiological behavior. The Clue tracking categories (summarized in Table 2) encompass a wide range of experiences (subject to user interpretation of the category rather than based on specific validated scales), enabling broad usage of the app to meet individual user needs. Self-tracked data reliability is dependent on consistent and accurate user tracking; for instance, cycle length can be arbitrarily long if a user forgets to track their period, which would skew the analysis of menstrual patterns by misrepresenting a long cycle as due to physiological behavior rather than tracking behavior. We propose a procedure to mitigate such potential engagement artifacts by quantifying engagement with cycle tracking and identifying cycles lacking engagement, allowing us to separate true menstrual patterns from tracking anomalies. To investigate the spectrum of variability in women’s menstrual health experiences, we propose cycle length difference or CLD—the absolute difference between subsequent cycle lengths—as a robust metric for quantifying cycle variability, and we examine users who fall at opposite ends of the variability spectrum.
2 Results
Study population.
The cohort for this study comprises users located on all continents, aged 21 to 33 years old (see Table 1 for detailed summary statistics). The average user is (median of ) years old (per-country and per-age detailed statistics are provided in the Supplementary Information). As reported in Table 3, the average number of cycles tracked per user is (median of ), with an average cycle length of (median of ) days and mean period length of (median of ) days.
| Variable | Full cohort | Consistently not highly variable | Consistently highly variable |
|---|---|---|---|
| Number of users | 378,694 (100.00%) | 349,606 (92.32%) | 29,088 (7.68%) |
| \hdashline Number of observations | 117,014,597 (100.00%) | 112,093,683 (95.79%) | 4,920,914 (4.21%) |
| \hdashline Number of days of observation | 34,056,343 (100.00%) | 32,699,312 (96.02%) | 1,357,031 (3.98%) |
| \hdashline Number of cycles | 4,881,697 (100.00%) | 4,701,694 (96.31%) | 180,003 (3.69%) |
Summary statistics of the full cohort, as well as for the consistently not highly variable and consistently highly variable user groups. We utilize a greater than 9 day median cycle length difference threshold to place users in each group—those in the consistently highly variable group represent the far end of a cycle variability spectrum.
| Category | Description | Symptoms | Number of tracking events (%) for the consistently not highly variable group | Number of tracking events (%) for the consistently highly variable group |
|---|---|---|---|---|
| period | Period flow | spotting, light, medium, heavy | 22,096,884 (19.71%) | 913,403 (18.56%) |
| \hdashline emotion | Emotional state | happy, sensitive, sad, PMS | 11,377,997 (10.15%) | 501,610 (10.19%) |
| \hdashline pain | Type of pain experienced | cramps, tender breasts, headache, ovulation pain | 9,730,958 (8.68%) | 406,710 (8.26%) |
| \hdashline energy | Energy level | low, high, exhausted, energized | 8,710,403 (7.77%) | 410,216 (8.34%) |
| \hdashline sleep | Hours of sleep | 0-3, 3-6, 6-9, > 9 | 8,597,769 (7.67%) | 405,726 (8.24%) |
| \hdashline skin | Skin health | acne, good, oily, dry | 5,896,540 (5.26%) | 263,258 (5.35%) |
| \hdashline mental | Mental state | calm, distracted, focused, stressed | 5,871,137 (5.24%) | 252,621 (5.13%) |
| \hdashline sex | Sexual health | unprotected sex, high sex drive, protected sex, withdrawal sex | 5,813,292 (5.19%) | 271,540 (5.52%) |
| \hdashline motivation | Motivation level | motivated, unmotivated, productive, unproductive | 5,467,728 (4.88%) | 236,052 (4.80%) |
| \hdashline craving | Food cravings | sweet, salty, carbs, chocolate | 4,867,777 (4.34%) | 224,751 (4.57%) |
| \hdashline digestion | Digestive health | great, bloated, gassy, nauseated | 4,825,627 (4.30%) | 209,651 (4.26%) |
| \hdashline social | Social behavior | sociable, withdrawn, supportive, conflict | 4,178,744 (3.73%) | 186,110 (3.78%) |
| \hdashline poop | Stool health | normal, constipated, great, diarrhea | 3,889,471 (3.47%) | 172,716 (3.51%) |
| \hdashline hair | Hair health | good, bad, oily, dry | 3,128,384 (2.79%) | 147,844 (3.00%) |
| \hdashline fluid | Vaginal discharge type | creamy, egg white, sticky, atypical | 2,378,211 (2.12%) | 106,782 (2.17%) |
| \hdashline collection method | Method for period collection | pad, tampon, panty liner, menstrual cup | 2,027,258 (1.81%) | 84,270 (1.71%) |
| \hdashline exercise | Physical exercise | running, yoga, biking, swimming | 1,222,568 (1.09%) | 44,946 (0.91%) |
| \hdashline party | Party-related experiences | drinks, cigarettes, big night, hangover | 900,444 (0.8%) | 40,779 (0.83%) |
| \hdashline medication | Type of medication taken | pain, cold / flu, antihistamine, antibiotic | 561,540 (0.5%) | 21,030 (0.43%) |
| \hdashline ailment | Physical maladies | cold / flu, allergy, injury, fever | 550,951 (0.49%) | 20,899 (0.42%) |
Description of tracking categories and corresponding symptoms for the Clue app, along with the per-symptom number of tracking observations (and their corresponding proportion with respect to the total number of observations) for the consistently not highly variable and consistently highly variable user groups.
| Full cohort’s | Consistently not highly variable group’s | Consistently highly variable group’s | |
| Variable | meansd, (95% CI), median | meansd, (95% CI), median | meansd, (95% CI), median |
| Number of cycles | 12.89 9.11 (3.00,36.00) 11.00 | 13.45 9.19 (3.00,37.00) 11.00 | 6.19 3.87 (2.00,17.00) 5.00 |
| \hdashlineCycle length | 29.73 5.73 (21.00,43.00) 29.00 | 29.45 4.98 (21.00,41.00) 29.00 | 37.04 13.71 (13.00,69.00) 34.00 |
| \hdashlinePeriod length | 4.08 1.76 (1.00,7.00) 4.00 | 4.07 1.72 (1.00,7.00) 4.00 | 4.28 2.54 (1.00,9.00) 4.00 |
| \hdashlineMedian CLD | 4.15 4.94 (1.00,18.00) 3.00 | 3.04 1.86 (1.00,8.00) 2.50 | 17.48 9.15 (9.50,43.00) 14.00 |
| \hdashlineMaximum CLD | 10.07 7.49 (2.00,31.00) 8.00 | 8.82 5.65 (2.00,23.00) 8.00 | 25.15 10.10 (12.00,53.00) 23.00 |
Per-user high-level cycle characteristics for the full cohort, as well as for the consistently not highly variable and consistently highly variable user groups. We utilize a greater than 9 day median cycle length difference threshold to place users in each group—those in the consistently highly variable group represent the far end of a cycle variability spectrum. The ‘cycle length difference’ (CLD) refers to the absolute difference between two consecutive cycles.
Cycle length difference (CLD) as a robust metric for quantifying cycle variability.
We propose cycle length difference, or CLD—the absolute difference between subsequent cycle lengths—as a powerful metric to characterize the spectrum of menstrual variability. We examine each user’s CLDs to identify those who are ‘consistently highly variable’ in their cycle lengths. We find that a median CLD of 9 days splits consistently highly variable and consistently not highly variable cycle behavior, and we use this threshold to separate the menstrual experiences and symptom reporting of those at different ends of the variability spectrum. Tables 1, 3, and 2 showcase the summary statistics, high-level cycle characteristics, and category tracking frequencies for the resulting two groups, respectively. We note that the consistently highly variable group comprises about 7.68% of the user cohort (29,088 out of 378,694 users) and that their relative category tracking frequencies is similar to the larger, consistently not highly variable user group. Period flow, emotional state, and experienced pain are the most frequently tracked categories across both groups; they account for 38.54% of the events for the consistently not highly variable group and 37.01% for the consistently highly variable group. Below, we summarize the commonalities and differences in cycle and period length characteristics and symptom tracking behavior between these two populations.
Cycle variability characterization — Women in the consistently highly variable group experience volatile cycle lengths.
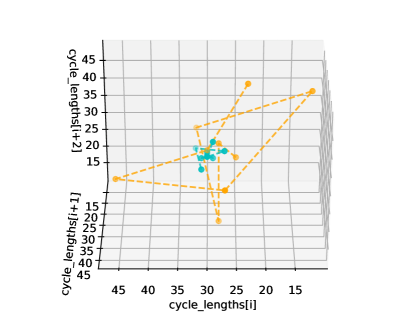
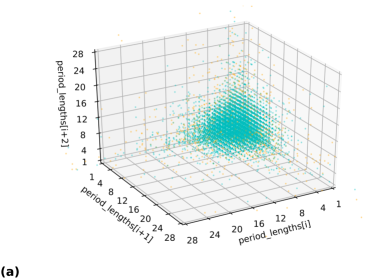
We examine the cycle length characteristics of the proposed user groups, both visually and statistically. At an individual level, we visualize for two randomly sampled users (one per group) a time series embedding of all of their consecutive cycle lengths in Figure 2. We sample one consistently highly variable and one consistently not highly variable user with the median number of cycles (11) from the cohort and plot each set of three consecutive cycles on the and axes, respectively. In Figure 2, the consistently not highly variable (teal) user occupies a small region of the space, indicating that this user experiences similar cycle lengths throughout their history; however, the consistently highly variable (orange) user’s points wander through the space, indicating that this user experiences consistently fluctuating cycle lengths throughout their cycle history.
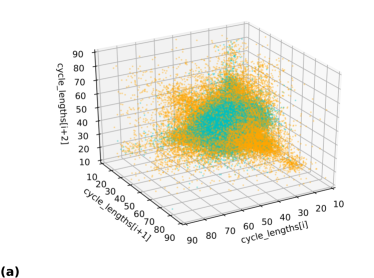
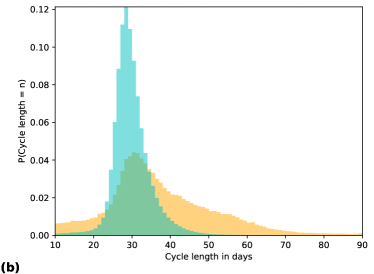
In Figure 3a, we plot the time series embeddings of cycle length for the entire cohort, where each point represents three consecutive cycles randomly sampled from each user’s cycle history (for users with at least three cycles). In contrast to Figure 2, each user is represented by one point, instead of plotting the whole cycle histories of two randomly sampled users. We visualize at a population level whether our median CLD metric successfully separates out groups of users based on their cycle length fluctuations. If a user is perfectly consistently not highly variable, then its representative point would fall exactly on the line, since the three cycle lengths would be identical (i.e., not fluctuating at all). We observe a consistent phenomenon in Figure 3a: the consistently not highly variable group (teal) occupies a tighter region of the space than the consistently highly variable one (orange). That is, a user in the consistently highly variable group experiences volatile menstrual patterns (i.e., highly varying cycle lengths).
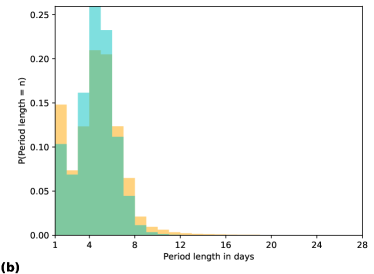
Furthermore, we study the empirical cycle length distributions per group, and as seen in Figure 3b, the cycle length distributions differ significantly between the two user groups. Observe that not only are cycle length statistics such as mean and median cycle length different, but that the shapes of the distributions are also distinct. Specifically, in addition to being centered at longer cycle lengths (median of 34 days versus 29 days), the cycle length distribution for the consistently highly variable group is less peaked with a wider spread (encompasses a more volatile range of cycle lengths), has much heavier tails, and is skewed towards longer cycle lengths.
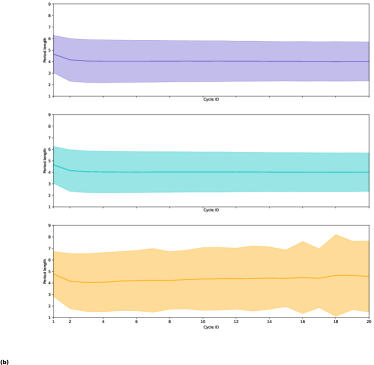
Cycle variability characterization—Period length statistics are homogeneous across the variability spectrum.
We find that while women in different groups as separated by median CLD differ in their cycle length variability, their period length distributions are much less variable and fluctuate similarly between the groups. Period length is centered around the same median of 4 days for both groups and displays a similar length distribution. Figure 4 confirms that the variability in cycle length is not due to period length differences between the groups, as the period length varies the same amount across all women. These results show that our metric (median CLD) identifies two distinct groups of users based on their cycle (not period) length variability. Note that while the period length distributions do differ significantly by the two-sample Kolmogorov-Smirnov (KS) test, the KS statistic for the period length distributions is 0.066 with a 95% confidence interval of (0.064, 0.068) (details on computing the confidence interval using bootstrapping are presented in the Methods section). These numbers are nearly an order of magnitude smaller than those for the cycle length distributions (0.377 with a 95% confidence interval of (0.375, 0.378)). That is, the KS test identifies the cycle length distributions to differ more drastically and with much higher probability than the period length distributions.
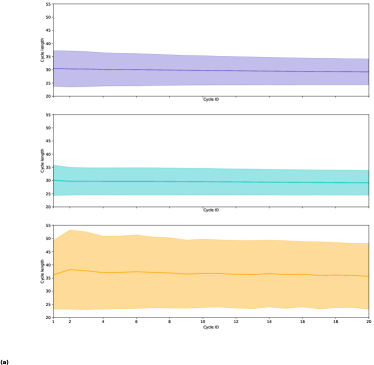
Cycle variability characterization—Cycle and period length statistics are stationary within groups over the app usage timeline.
We study per-group cycle statistics over the app usage time (as represented by cycle ID) in Figure 5 and find that cycle and period length statistics are stationary over time at the group level. Cycle ID enables us to align all users according to their subsequently tracked cycles (not absolute time), i.e., a cycle ID of 1 corresponds to the first cycle of a user, 2 to their second cycle, and so on. As reported in Table 3, the mean cycle length for the consistently not highly variable group is 29.45 days (median of 29), and the mean is 37.04 days (median of 34) for the consistently highly variable group. We observe that while average cycle and period length are similar over subsequent reported cycles for both the entire user cohort and the consistently not highly variable user group, consistently highly variable users exhibit a wider spread (i.e., higher volatility). This volatility is maintained across cycles for users in the consistently highly variable group, showcasing that this group accounts for a large degree of the volatility in the data; this detail would be largely ‘smoothed out’ and lost if we considered the whole population rather than separating the users into two groups. Since cycle and period length statistics are constant within groups across app usage, we are confident that the proposed median CLD is not merely capturing spurious correlations that depend on how long the user stays with the app.
Reported symptom differences—Women located at different ends of the spectrum of menstrual variability exhibit different symptom patterns.
We find that there exists a relationship between median CLD and cycle level user symptom tracking behavior—despite CLD being a measure of cycle length variability, it is also correlated with symptom tracking behavior. Specifically, our analysis of the symptoms tracked across the two variability groups showcases that while users exhibit similar tracking frequencies (i.e., the total number of times they track throughout history) per category (as in Table 2), there are notable differences among their symptom tracking patterns (i.e., how they track throughout history). The population level distributions of our metric (i.e., ‘proportion of cycles with symptom out of cycles with category’ in Equation 1) differ between the user groups across most categories, with these differences being significant for all symptoms within the period, pain, and emotion categories, a result which may be clinically useful for assessing menstrual conditions and overall wellness. We present the KS test results for symptoms within those categories in Table 4.
| Category | Symptom | Kolmogorov-Smirnov statistic (95% CI) |
|---|---|---|
| Period flow | heavy | 0.181 (0.178,0.183) |
| \hdashlinePeriod flow | medium | 0.134 (0.132,0.137) |
| \hdashlinePeriod flow | light | 0.121 (0.118,0.124) |
| \hdashlinePeriod flow | spotting | 0.089 (0.087,0.092) |
| \hdashlineType of pain experienced | cramps | 0.101 (0.097,0.104) |
| \hdashlineType of pain experienced | ovulation pain | 0.096 (0.093,0.099) |
| \hdashlineType of pain experienced | headache | 0.089 (0.087,0.092) |
| \hdashlineType of pain experienced | tender breasts | 0.082 (0.080,0.084) |
| \hdashlineEmotional state | sensitive emotion | 0.115 (0.112,0.118) |
| \hdashlineEmotional state | happy | 0.108 (0.105,0.111) |
| \hdashlineEmotional state | pms | 0.086 (0.083,0.089) |
| \hdashlineEmotional state | sad | 0.076 (0.073,0.079) |
Kolmogorov-Smirnov test results for symptom tracking patterns that are significantly different (at a level) between users in the consistently not highly variable and consistently highly variable groups.
Reported symptom differences—Women in the consistently highly variable group display more heterogeneous period tracking behavior.
We find that women in the consistently highly variable group are significantly more likely not to report heavy periods throughout their cycle history (odds ratio of 1.734 on the low extreme end of the proportion range in Table 5). Additionally, the tracking pattern for spotting period flow is more heterogeneous for the consistently highly variable group, as shown by the higher odds ratios on both extremes of the proportion range, (i.e., either in all or none of their cycle history) shown in Tables 5 and 6.
Reported symptom differences—Women in the consistently highly variable group report pain-related symptoms more unpredictably.
We observe generally more heterogeneous experiences for non-bleeding related symptoms like pain for the consistently highly variable group. Of particular interest is the finding that users in the consistently highly variable group are much more likely associated with tracking headaches and tender breasts in at least 95% of their cycles, with odds ratios of 1.663 and 1.715 respectively (see Table 6).
| Consistently highly variable group’s | Consistently not highly variable group’s | Odds ratio (95% CI) | ||
|---|---|---|---|---|
| Category | Symptom | likelihood for (95% CI) | likelihood for (95% CI) | for |
| Period flow | heavy | 0.170 (0.169,0.170) | 0.098 (0.096,0.100) | 1.734 (1.703,1.766) |
| \hdashlinePeriod flow | spotting | 0.314 (0.313,0.315) | 0.239 (0.237,0.241) | 1.314 (1.300,1.328) |
| \hdashlineType of pain experienced | headache | 0.326 (0.325,0.327) | 0.269 (0.266,0.272) | 1.212 (1.199,1.225) |
| \hdashlineType of pain experienced | tender breasts | 0.366 (0.365,0.367) | 0.320 (0.317,0.322) | 1.145 (1.134,1.156) |
Likelihood of low per group, with the associated odds ratio (and 95% confidence intervals). The probability of not tracking ‘heavy period’ for users in the consistently highly variable group is 0.17 and 0.098 in the other, with an odds ratio of 1.734: the consistently highly variable group is more likely not to track ‘heavy period’.
| Consistently highly variable group’s | Consistently not highly variable group’s | Odds ratio (95% CI) | ||
|---|---|---|---|---|
| Category | Symptom | likelihood for | likelihood for | for |
| Period flow | heavy | 0.078 (0.077,0.079) | 0.096 (0.094,0.097) | 0.817 (0.802,0.833) |
| \hdashlinePeriod flow | spotting | 0.067 (0.066,0.067) | 0.039 (0.037,0.040) | 1.729 (1.679,1.782) |
| \hdashlineType of pain experienced | tender breasts | 0.193 (0.192,0.194) | 0.113 (0.111,0.115) | 1.715 (1.684,1.746) |
| \hdashlineType of pain experienced | headache | 0.218 (0.217,0.219) | 0.131 (0.129,0.133) | 1.663 (1.636,1.691) |
Likelihood of high per group, with the associated odds ratio (and 95% confidence intervals). The probability of consistently tracking ‘tender breast’ pain for users in the consistently highly variable group is 0.193 and 0.113 in the other, with an odds ratio of 1.715: the consistently highly variable group is more likely to regularly track ‘tender breast’ pain.
3 Discussion
Characterization of menstrual patterns has been previously explored, though typically in relation to cycle and period lengths only. While common knowledge refers to a 28-day cycle as “normal,” this belief has been consistently disproved by clinical studies (67, 22), as well as by recent analysis of high-level cycle characteristics via menstrual self-tracking apps (17, 65).
Overall, our results align with conclusions from these studies in that the cycle lengths have slightly higher values (median of 29 in our dataset) and wider ranges than what was previously commonly believed. While our study population demographics may differ slightly from other studies, we believe these still provide a reasonable basis for comparison. We show comparative summary statistics in the Supplementary Information, demonstrating the consistency of our cycle and period characteristics: () the average number of cycles tracked per user in this dataset (12.9) is bigger than in (17) (8.6), while it matches those (12.8) of (65); () the cycle length statistics are all similar: mean of in this work, in (17); median of 29 in this work, 28 in (65). Interestingly, this work and (17) both report an overall variability of cycle length of around 5 days, and this work and (65) both acknowledge the presence of “a heavy tail on longer cycles.” The period length averages of this work and (17) are in agreement as well ( vs. , respectively). Besides, these high-level cycle statistics align well with results of previous clinical studies (67, 22, 24).
Examining cycle length is often insufficient for capturing all fluctuations in menstrual patterns—studies regarding menstrual variability showcase that although average cycle length is associated with cycle length consistency, women still experience significant variability in cycle lengths regardless of their average cycle length (24). In this work, we address this limitation by utilizing our proposed metric, median CLD, to characterize menstrual cycle variability. Separating users according to their median CLD yields two distinct groups of users with statistically significant differences in cycle length, cycle length variations, and symptom tracking behaviors. We are unaware of any single figure of merit which so helpfully separates users into distinct segments. Clue uses the International Federation of Gynecology and Obstetrics (FIGO) definitions for clinically irregular cycles in the app (26), but has not found connections with differences in tracking.
While there has been ample work on hormone-level characterizations of the menstrual cycle (38, 29, 45, 46), studies of the relationship between menstrual patterns and symptomatic variables are limited—recent work has explored this association using self-tracked data, but over a limited set of symptoms (53) and without discriminating over age or birth control usage (54). A method for estimating ovulation timing based on Fertility Awareness Method observations (i.e., basal body temperature (BBT), cervical mucus, cervix position, and vaginal sensation) has been presented (65), but such data is inaccessible for this study due to the European Union’s General Data Protection Regulation and other data-privacy concerns (sensitive fields such as appointments, ovulation and pregnancy tests, and BBT were not available in Clue’s dataset). Nonetheless, such studies showcase the potential large-scale self-tracked data offer in exploring questions relating to menstruation.
This work further demonstrates that mobile self-tracked data provide an accessible option for clinicians and researchers investigating changes of a variable of interest across the menstrual cycle. Our dataset allows us to explore symptoms of interest like pain, types of bleeding, and emotions explicitly, and we are able to connect variability in cycle lengths to patterns in self-reported symptom tracking. In contrast to existing work, our methods allow us to comment quantitatively and qualitatively on the menstrual experience over a broad set of symptoms. While cycle length has been proposed as a biomarker of menstrual health (e.g., very long and very short cycles are associated with a higher risk of infertility), this work suggests that cycle variability may also be a useful biomarker.
We propose a definition of menstrual cycle variability and find that users in high and low variability groups showcase both statistically significant differences in their cycle statistics as well as in their symptom tracking patterns. We argue that the discovery of such distinct forms of symptom expression allows for phenotype identification and the investigation of clinical associations. In particular, of the symptoms which show statistically significant association with timing data (as measured by median CLD), some of the most arguably unambiguous ones like period flow and pain are also the diagnostic symptoms frequently appearing in the assessment of menstrual health conditions like endometriosis and polycystic ovary syndrome (PCOS). Thus, cycle variability and these high-signal self-tracked symptom patterns can be potentially useful either for predicting each other (e.g., predicting cycle variability from symptoms) or health consequences (e.g., PCOS), insights which are useful to both clinicians and users.
Our perspective on how users experience their menstruation enables development of data-driven models to predict multiple aspects of the menstrual cycle based on self-tracked history, ranging from modeling time to next cycle, to forecasting occurrence of specific symptoms a user might report, to detecting underlying medical conditions. Equipped with the results of this work at the cycle level, future work will consist of identifying further differences at a finer grain, namely across the different menstrual phases.
Despite the strength of these results, there are several mitigating factors to bear in mind. We acknowledge that self-tracked data may be unreliable for several reasons, such as inconsistent user engagement or ambiguous symptomatic language. For example, there is potential overlap between similar-sounding symptoms, e.g., some users may track ‘low energy,’ whereas others may track ‘exhausted.’ Users can also engage inconsistently by tracking an unequal number of cycles or forgetting to track their period. We successfully ameliorate the latter issue by excluding unexpectedly long cycles utilizing our proposed procedure. For the former issue, we observe that the consistently highly variable group tracked a lower number of cycles on average (see Table 3). However, we note that the number of users who only tracked two cycles (after our preprocessing steps) is small across the entire cohort, representing 2.62% and 0.57% of the consistently highly and not highly variable groups, respectively.
In addition to the risk of inconsistent user engagement, inherent in the nature of self-tracked data is the challenge of disentangling user behavior from true physiological experiences. The design and selection of symptoms for the Clue app was based both on the scientific literature around the menstrual experience and research on which categories users deemed important. As such, in order to encompass a wide range of relevant menstrual and health experiences, the available tracking categories are broad and treated with equal importance. However, we acknowledge that since the symptoms in the app are not based on validated scales and are not designed for diagnosis of specific conditions, they are most likely not granular (nor targeted) enough to make definite claims about specific conditions. Furthermore, while there are infotexts in the Clue app that explain each tracking category, self-reported data is influenced by individual user interpretation and by how users use the app to meet their own needs; we cannot guarantee that each category has the same meaning for each user.
In this paper, we take symptom tracking behavior to be a proxy for true physiological behavior. However, we are cognizant of the fact that these are not necessarily equivalent. Note that it is very difficult to know what the true physiological experience is in any circumstance: e.g., the experience of menopause varies greatly by culture (39). With self-tracked data and without access to ground truth, it is complicated (if not impossible) to truthfully distinguish the experienced symptoms from the tracked ones, due to the presence of engagement artifacts and other unforeseen factors. As such, we have taken steps to reduce tracking artifacts with preprocessing techniques, but recognize that limitations remain. Nonetheless, it remains useful to examine these datasets to better understand not only women’s menstrual experiences at scale, but also how to improve self-tracking technologies to enable clearer, more interpretable datasets in the future.
Overall, large-scale self-tracked mobile-health data allow us to quantitatively explore the question of characterizing menstrual behavior. Our findings reinforce the claim that menstruation is characterized by variability rather than by regularity (9, 67, 22, 24, 69). We find variation in cycle length statistics as well as in self-reported symptoms, showcasing the spectrum of how women experience their menstruation. We reveal statistically significant relationships between the variability of cycle length and self-reported qualitative symptoms. The identified set of symptoms which show association with timing data (e.g., period flow and pain) are the diagnostic symptoms frequently leveraged for diagnosis of health-relevant conditions, such as endometriosis and PCOS, insights that are useful to both clinicians and users. More broadly, we also develop a methodology for identifying artifacts in self-tracked data, which can be extended to other self-reported menstrual tracking datasets. This work not only statistically verifies the variation of menstrual experience, but also presents promising opportunities for future statistical modeling, prediction, and the potential to inform diagnosis of menstrual-related disorders.
4 Methods
Data overview
We leverage a de-identified version of the Clue data warehouse, a dataset of self-tracking events for users in our cohort of interest. Clue app users input overall personal information at sign up, such as age and hormonal birth control (HBC) type. The dataset contains information from 2015-2018 for users worldwide, covering countries within North and South America, Europe, Asia and Africa (see the Supplementary Information for a detailed count of cohort users per country). Users can self-track symptoms over time across the 20 available categories (see Table 2 for symptom list) and can pre-select which categories they wish to track when they sign up—all users do not track all categories.
Clue app users track an event by selecting a category and then choosing an associated symptom. Each row in the primitive dataset represents a tracked event , with relevant fields being () the user that tracked the event , () the reported symptom in that event , and () the user-specific cycle in which the event takes place. A menstrual cycle is defined as the span of days from the first day of a period through to and including the day before the first day of the next period (69). A period consists of sequential days of bleeding (greater than spotting and within ten days after the first greater than spotting bleeding event) unbroken by no more than one day on which only spotting or no bleeding occurred. Note that Clue considers a menses duration longer than 10 days as an outlier, as it would exceed mean period length plus 3 standard deviations for any studied population (69). In addition, a user has the opportunity to specify whether a cycle should be excluded from their Clue history—for instance, if the user feels that the cycle is not representative of their typical menstrual behavior due to a medical procedure or changes in birth control.
Cohort definition
A cohort of users and cycles was selected for this analysis, based on factors including age, HBC usage, cycle length, and engagement patterns. Recall that we restricted our data to users aged between 21-33 years, since menstrual cycles are relatively less variable in length and more likely to be ovulatory during this age range (67, 22, 30, 69, 36). At younger ages, the reproductive axis (the hypothalamic-pituitary-ovarian axis) in some women, especially those who experienced a later than average age at menarche, may not be fully matured. At older ages, some women may be experiencing premature menopause. Restricting our sample to this age group substantially reduces the influence of confounders like undetected heterogeneity on our analyses. Per-age details like cycle and period length statistics are provided in the Supplementary Information.
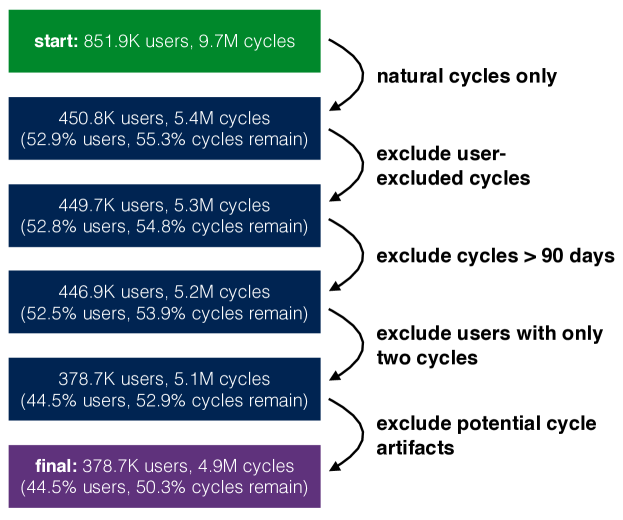
Since HBC and copper IUDs have been shown to impact cycle length and other aspects of menstruation, we consider natural menstrual cycles only. Therefore, we ignore cycles from users who reported some form of HBC (patch, pill, injection, ring, implant) or IUD (we excluded all cycles with evidence of IUD use, as there is no explicit distinction between hormonal and copper IUD usage in the dataset). This step removes about 45% of the cycle data, but is crucial to studying menstruation in a standardized way across users, else it would be unclear whether an exhibited menstrual behavior was due to physiology or the effect of birth control. We exclude cycles that a user deems to be anomalous to avoid potential artifacts in cycle patterns. In addition, we eliminate cycles greater than 90 days long, as well as users who have only tracked two cycles, to rule out cases that we argue indicate lack of engagement or non-continuous use of the app. Finally, we exclude cycles where we believe the user forgot to track their period, hence resulting in an artificially long cycle length; we explain this procedure below. The effect of these filtering steps on the dataset is outlined in Figure 6, with the final step indicating the removal of aforementioned suspected artificially long cycles. In total, the proposed data filtering steps reduced the size of the cycle dataset by about 49%. However, the resulting age-specific, natural cycle-only user cohort and corresponding dataset with potential artifacts removed enables us to study our research questions in a less noisy setting.
Ethics
The research presented here was exempt from Columbia University IRB approval, in accordance with 45CFR46.101(b), as all data is de-identified and no participant risks are associated with taking part in the study. Participants do not receive direct benefit from this study, but their participation contributes to the general knowledge of menstrual cycles and their symptoms.
Characterizing longitudinal menstrual tracking via cycle length difference
There are many useful ways to characterize menstrual cycles, each of which offers its own advantages and disadvantages. For instance, cycle length provides insight into the length of time between periods and has been widely documented to vary across women (22, 51, 14, 18, 70, 24, 73), but is insufficient for understanding menstrual cycle length volatility, as it fails to characterize variability from one cycle to the next.
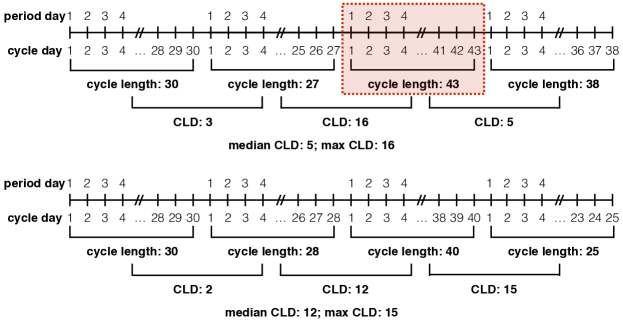
We propose computing cycle length differences (CLDs), which we define as the absolute differences in subsequent cycle lengths. CLDs represent a user’s longitudinal cycle tracking history by quantifying their between-cycle volatility. This metric captures menstrual patterns regardless of specific cycle lengths, allowing us to measure fluctuation over time and identify those who are consistently highly variable. This metric does not capture some other menstrual phenomena, such as cycle lengths growing at a constant pace—that is, if a cycle length grew consistently by two days with each cycle, the CLDs would all be equal to two, but there would be a large difference between the shortest and longest cycle lengths. However, CLDs and related metrics of median and maximum CLD do allow us to characterize users on the extreme ends of the between-cycle variability spectrum and identify potential cycle tracking artifacts, as described in the following sections. Figure 7 outlines the computation of CLDs and related statistics.
Quantifying engagement with cycle tracking
We propose a methodology for identifying cycles associated with lack of app engagement, specifically where users forgot to track their period, since this may inflate the corresponding computed cycle length. Our procedure allows us to distinguish physiological behavior (i.e., true ‘long’ cycle lengths) from tracking artifacts (i.e., artificially inflated cycle lengths), which allows us to more reliably utilize symptom tracking behavior as a proxy for true physiological behavior.
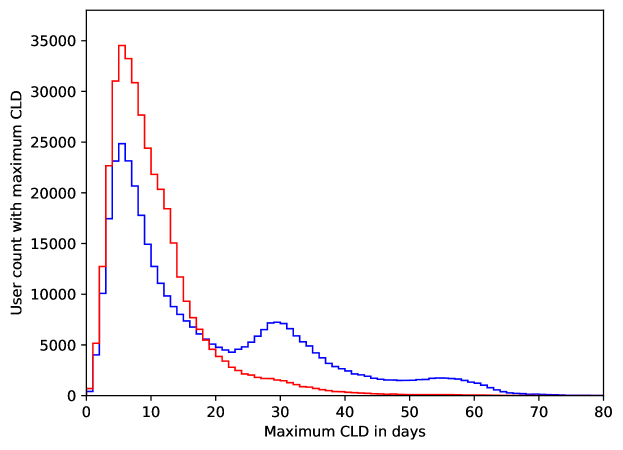
Figure 8 showcases how maximum CLD impacts our overall picture of user engagement. In particular, the multi-modal nature of the histogram of maximum CLD (in blue) indicates that there may be cycles where users forgot to track their period, resulting in an overestimation of cycle length. Note the peaks around 30 and 60 days, which may correspond to users forgetting to track one or two periods, respectively. That is, consider a user who exhibits a perfectly uniform cycle length of 30 and hence always has a CLD of 0. If this user were to forget to track a period once in their history, then the app would record that they have a cycle length of 60 and a maximum CLD of 30—such a user would fall into the first peak of the histogram. The discrepancy between regular patterns (via the median CLD) and extreme events (maximum CLD) is further illustrated in Figure 9.
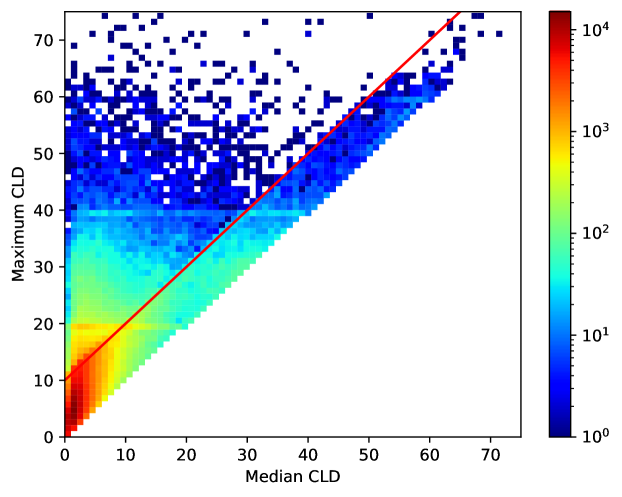
We identify cycles that are ‘atypically long’ compared to the ‘typical’ cycle length for each user by examining the difference between each CLD and the median CLD of that user. An illustrative example is provided in the top panel of Figure 7, where the third cycle appears to be ‘atypically long.’ Specifically, we flag cycles per user where the corresponding CLD exceeds the user’s median CLD by at least 10 days as ‘atypically long’ (the longer of the two cycles corresponding to the CLD is flagged). This cutoff is based on an attempt to find in the data, rather than posit a priori, a feature that would distinguish ‘typical’ from ‘extreme’ (i.e., abnormally long) reported cycles. To do so, we plot the two-dimensional histogram (see Figure 9) of maximum CLD against median CLD; this is a histogram in which every example is a user. We observe a clear visual feature: a band of users we consider ‘typical,’ for whom maximum CLD was within 10 days of the median CLD, and a scatter of other users for whom their maximum CLD could be far larger. To capture this visually striking feature (see the diagonal red line along maximum CLD equal to 10 more than median CLD in Figure 9), we defined extreme events as those at least 10 days above the median CLD. We consider the cycles flagged as ‘atypically long’ to be the result of cycle engagement artifacts and exclude them from our analysis.
As shown in Figure 8 (red line), the multi-modal shape is largely removed after eliminating the ‘atypically long’ cycles. We find that 42% of the cohort has at least one such cycle, and for these users we exclude a small number (1.59) of cycles per user on average. This indicates that our method is stringent enough to identify artificially long cycles, but conservative enough to preserve the heterogeneity of the data.
We further validate our method by examining tracking activity during the interval where a user is expected to track their period for each of these excluded cycles and find that in 89.18% of such cases there is no evidence of bleeding-related events during this interval, i.e., the user likely did not engage in period tracking. We define this interval as the user’s last reported period day plus their median cycle length, plus or minus their median period length. In the remaining 10.82% of excluded cycles, it is unclear whether the bleeding-related events tracked during this interval represent a period or some other non-period bleeding. Note that by our definition of a period, a single bleeding event is not synonymous with period. As a conservative measure and to maintain consistency of our definitions for period and artificially long cycles, we exclude those cycles from our analysis. This ensures a coherent data pre-processing pipeline and impacts the results minimally (these excluded cycles with some bleeding-related events amount to only 0.56% of all cycles). Quantifying inconsistent tracking engagement allows us to ameliorate its impact on subsequent analyses.
Characterizing users according to cycle length variability
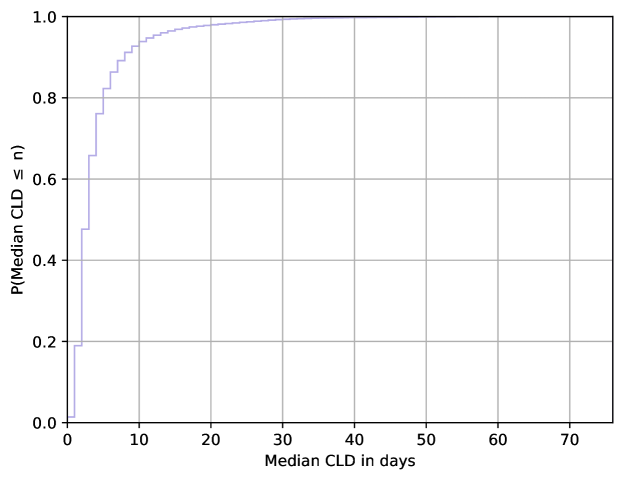
We acknowledge that there is a wide spectrum of variability in women’s menstrual health experiences, and we wish to examine those who fall at opposite ends of the variability spectrum on the basis of their cycle pattern consistency. We choose the median CLD metric for our analysis, as it is robust to outliers (the mean would be more susceptible to being skewed by rare events). Upon examining the cumulative distribution of this metric across users in Figure 10, we consider a median CLD of greater than 9 days to be an appropriate stringent cutoff for identifying consistently highly variable menstrual patterns. This choice aligns with previous work on menstrual pattern analysis: cycle length variability studies in Guatemalan, Bolivian, Indian, U.S. and European women noted differences in the maximum and minimum cycle length ranging from 6 to 14 days (51, 14, 18, 70, 24, 73). Our proposed cutoff separates users into two distinct groups of menstrual patterns: the vast majority (92.32%) of the population falls to the left of this threshold, and thus the consistently highly variable group (the remaining 7.68%) represent those whose variability is extreme. As discussed in the Results section, we observe that the highly variable group experiences more drastic fluctuations in cycle length. We confirm that the cycle length distributions differ significantly between the two groups using a two-sample Kolmogorov-Smirnov test (42).
Quantifying symptom tracking behavior across user groups
We focus on symptom tracking behavior at the cycle level, evaluating how often throughout their longitudinal tracking users track each symptom, regardless of when within the cycle the tracking occurred (i.e., ignoring at which phase or day of the cycle the symptom occurred). Note that because cycle length varies both within each user’s longitudinal tracking and across women, the number of tracking events per cycle would be skewed by cycle length. To combat this issue, we measure the per-user proportion of cycles where a symptom has been tracked.
We also want our metric to capture symptom tracking behavior for cycles where users were interested in tracking the associated category (recall how users do not have to track all categories). Specifically, our analysis focuses on how often a user has a symptom tracking event per cycle , given that they have tracked symptoms within the associated category at least once across all their cycles . We refer to this metric as the ‘proportion of cycles with symptom out of cycles with category,’ mathematically denoted as
| (1) |
That is, to account for whether a user is actually interested in the symptom at hand, we compute the proportion of cycles with a symptom being tracked out of the number of cycles where the user has tracked the category related to that symptom. For example, consider a user who tracked 8 cycles; out of these, she tracked any of the symptoms within the pain category for 5 cycles. For 1 of these cycles only, she tracked the symptom ‘headache,’ while for 4 of these cycles, she tracked ‘tender breasts.’ Our metric captures the tracking regularity of a given symptom across a user’s cycles. When applied to the example user, 20% of cycles with pain have ‘headache’ tracked, while 80% of the same cycles have reports of ‘tender breasts.’ In essence, is the conditional probability that user tracks the specific symptom given that she has tracked any symptom from the symptom’s corresponding category. Our metric measures per-cycle symptom tracking frequency and is robust to () different cycle lengths and number of cycles (as it is normalized with respect to each user’s number of cycles), () different user app interests (as it is contingent on whether the user has shown interest in tracking such category at least once), and () different app usage behaviors (as it does not depend of how many times within a cycle the symptom is tracked).
We study the cumulative distributions of per group (i.e., for all users within each variability group), as well as how such densities are different on their support boundaries across groups. Since we lack a mechanistic model of what distribution the data might follow and wish to use a test meaningful for any distribution, we utilize a nonparametric test suitable for any ordinal (as opposed to, e.g., binary or categorical data): the Kolmogorov–Smirnov (KS) test (42). This test of the comparative equality of one-dimensional probability distributions arising from two samples allows us to quantify statistical differences in symptom tracking behavior between groups. Specifically, we compare the distributions of the proportion of cycles with a symptom tracked (out of cycles with its corresponding category), for the consistently not highly variable and consistently highly variable user groups. The KS statistic quantifies the distance between the empirical cumulative distributions of two samples, and the associated test is sensitive to differences in both location and shape of said distributions, allowing us to characterize where and how much the symptom tracking patterns (as measured by the proposed metric) differ between groups.
In the two-sample case, the null distribution of the KS statistic is calculated under the null hypothesis that the samples are drawn from the same distribution, where the distribution considered under the null hypothesis is an unrestricted continuous distribution (i.e., no distributional assumption is made on the symptom tracking patterns). The KS statistic depends on the number of data points within each of the populations (i.e., the number of observations that we have for each group when computing their per-symptom empirical cumulative density function). The null hypothesis is rejected at level if
| (2) |
where and are the sizes of the first and second data samples respectively, and , the computed two-sample KS statistic. The -values reported by the KS test consider observed sample sizes, accounting for the impact of whether certain symptoms are more or less frequently logged in each group.
In order to explore how the empirical distributions differ, we study their support boundaries, i.e., and . These represent how likely users in each group are to either consistently track a symptom throughout their cycle history (i.e., in almost every cycle where they track the category), or to not track it at all (i.e., in very few of their cycles where they track the category). We compute the odds ratio of these values (on either the high extreme or low extreme end of the proportion range) for the consistently highly variable group to the consistently not highly variable group. If we have an odds ratio greater than 1 for the high extreme end of the metric range for a symptom, this would indicate that the consistently highly variable group is more likely to report a very high proportion of cycles with that symptom. On the other hand, an odds ratio greater than 1 for the low extreme end of the proportion range (i.e., the proportion of cycles with a symptom tracked is close to zero) indicates that the consistently highly variable group is more likely not to report such a symptom.
When possible, 95% confidence intervals have been added to reported KS values using bootstrap analysis. To do so, we draw 100,000 random samples—resampled with replacement—from each variability group and report the estimated mean KS statistic values and their 2.5 and 97.5 percentiles.
5 Data availability
The database that supports the findings of this study was made available by Clue by BioWink. While it is de-identified, it cannot be made directly available to the reader. Researchers interested in gaining access to the data can contact Clue by BioWink and establish a data use agreement with them.
6 Code availability
Our code has been developed using open source tools in Python with common statistical libraries (e.g., Pandas and SciPy). The code required for data pre-processing and producing results is available in the public GitHub repository https://github.com/iurteaga/menstrual_cycle_analysis.
7 Acknowledgements
The authors are deeply grateful to all Clue users whose de-identified data have been used for this study.
8 Author contributions
KL and IU contributed equally to this work. KL, IU, CHW, and NE conceived the proposed research and designed the experiments. KL and IU processed the dataset, conducted the experiments, and wrote the first draft of the manuscript. CHW, AD, AS, VJV, and NE reviewed and edited it. All authors read and approved the manuscript.
9 Competing interests
KL is supported by NSF’s Graduate Research Fellowship Program Award #1644869. IU, CHW and NE are supported by NSF Award #1344668. KL, IU, CW, and NE declare that they have no competing interests. AD, AS and VJV were employed by Clue by BioWink at the time of this research project.
References
- clu (2019) Clue by BioWink GmbH, Adalbertstraße 7-8, 10999 Berlin, Germany. https://helloclue.com/, 2019.
- dot (2019) Dot: A fertility tracker app. https://www.dottheapp.com/, 2019.
- glo (2019) Glow: An App for Fertility & Beyond. https://glowing.com/glow, 2019.
- nat (2019) Natural Cycles: Digital Birth Control. https://www.naturalcycles.com, 2019.
- spo (2019) Spot On: A Birth Control And Period Tracker App powered by Planned Parenthood. https://shortyawards.com/9th/spot-on, 2019.
- Althoff (2017) T. Althoff. Population-Scale Pervasive Health. IEEE Pervasive Computing, 16(4):75–79, October 2017. ISSN 1536-1268. doi: 10.1109/MPRV.2017.3971134.
- Althoff et al. (2017) T. Althoff, R. Sosic, J. L. Hicks, A. C. King, S. L. Delp, and J. Leskovec. Large-scale physical activity data reveal worldwide activity inequality. Nature, 547(336), 2017. doi: https://doi.org/10.1038/nature23018.
- American College of Obstetricians and Gynecologists (2015) American College of Obstetricians and Gynecologists. Menstruation in Girls and Adolescents: Using the Menstrual Cycle as a Vital Sign. Obstetrics & Gynecology, 126(6):143–6, 2015. URL https://www.acog.org/Clinical-Guidance-and-Publications/Committee-Opinions/Committee-on-Adolescent-Health-Care/Menstruation-in-Girls-and-Adolescents-Using-the-Menstrual-Cycle-as-a-Vital-Sign.
- Arey (1939) L. B. Arey. The Degree of Normal Menstrual Irregularity. American Journal of Obstetrics & Gynecology, 37(1):12–29, 1939. doi: https://doi.org/10.1016/S0002-9378(16)40957-9.
- Ata et al. (2018) R. Ata, N. Gandhi, H. Rasmussen, O. El-Gabalawy, S. Gutierrez, A. Ahmad, S. Suresh, R. Ravi, K. Rothenberg, and O. Aalami. Clinical validation of smartphone-based activity tracking in peripheral artery disease patients. npj Digital Medicine, 1(66), 2018. doi: https://doi.org/10.1038/s41746-018-0073-x.
- Barbosa et al. (2011) C. P. Barbosa, A. B. D. Souza, B. Bianco, and D. Christofolini. The effect of hormones on endometriosis development. Minerva Ginecologica: A Journal on Obstetrics and Gynecology, 63(4):375 – 386, Aug 2011. URL https://www.minervamedica.it/en/journals/minerva-ginecologica/article.php?cod=R09Y2011N04A0375.
- Barr et al. (1995) S. Barr, K. Janelle, and J. C. Prior. Energy intakes are higher during the luteal phase of ovulatory menstrual cycles. The American Journal of Clinical Nutrition, 61(1):39–43, 1995. URL http://ajcn.nutrition.org/content/61/1/39.abstract.
- Bedford et al. (2010) J. L. Bedford, J. C. Prior, and S. I. Barr. A Prospective Exploration of Cognitive Dietary Restraint, Subclinical Ovulatory Disturbances, Cortisol, and Change in Bone Density over Two Years in Healthy Young Women. The Journal of Clinical Endocrinology & Metabolism, 95(7):3291–3299, July 2010. ISSN 0021-972X. doi: 10.1210/jc.2009-2497. URL https://academic.oup.com/jcem/article/95/7/3291/2596346.
- Belsey and Pinol (1997) E. M. Belsey and A. P. Pinol. Menstrual bleeding patterns in untreated women. Task Force on Long-Acting Systemic Agents for Fertility Regulation. Contraception, 55(2):57–65, 1997.
- Bobel (2019) C. Bobel. Beyond the Managed Body: Putting Menstrual Literacy at the Center. In C. Bobel, editor, The Managed Body: Developing Girls and Menstrual Health in the Global South, pages 281–321. Springer International Publishing, Cham, 2019. ISBN 978-3-319-89414-0. doi: 10.1007/978-3-319-89414-0_8. URL https://doi.org/10.1007/978-3-319-89414-0_8.
- Bot et al. (2016) B. M. Bot, C. Suver, E. C. Neto, M. Kellen, A. Klein, C. Bare, M. Doerr, A. Pratap, J. Wilbanks, E. R. Dorsey, et al. The mPower study, Parkinson disease mobile data collected using ResearchKit. Scientific data, 3:160011, 2016.
- Bull et al. (2019) J. R. Bull, S. P. Rowland, E. B. Scherwitzl, R. Scherwitzl, K. G. Danielsson, and J. Harper. Real-world menstrual cycle characteristics of more than 600,000 menstrual cycles. npj Digital Medicine, 2(83), 2019.
- Burkhart et al. (1999) M. C. Burkhart, L. de Mazariegos, S. Salazar, and T. Hess. Incidence of irregular cycles among Mayan women who reported having regular cycles: implications for fertility awareness methods. Contraception, 59(4):271 – 275, 1999. doi: 10.1016/S0010-7824(99)00030-X.
- Byambasuren et al. (2018) O. Byambasuren, S. Sanders, E. Beller, and P. Glasziou. Prescribable mHealth apps identified from an overview of systematic reviews. npj Digital Medicine, 1(12), 2018. doi: https://doi.org/10.1038/s41746-018-0021-9.
- Carmina and Lobo (1999) E. Carmina and R. A. Lobo. Polycystic Ovary Syndrome (PCOS): Arguably the Most Common Endocrinopathy Is Associated with Significant Morbidity in Women. The Journal of Clinical Endocrinology & Metabolism, 84(6):1897–1899, 1999. doi: 10.1210/jcem.84.6.5803. URL http://dx.doi.org/10.1210/jcem.84.6.5803.
- Chan et al. (2017) Y.-F. Y. Chan, P. Wang, L. Rogers, N. Tignor, M. Zweig, S. G. Hershman, N. Genes, E. R. Scott, E. Krock, M. Badgeley, et al. The Asthma Mobile Health Study, a large-scale clinical observational study using ResearchKit. Nature biotechnology, 35(4):354, 2017.
- Chiazze et al. (1968) L. Chiazze, F. T. Brayer, J. John J. Macisco, M. P. Parker, and B. J. Duffy. The Length and Variability of the Human Menstrual Cycle. The Journal of the American Medical Association, 203(6):377–380, 1968. doi: 10.1001/jama.1968.03140060001001.
- Crawford et al. (2017) N. M. Crawford, D. A. Pritchard, A. H. Herring, and A. Z. Steiner. Prospective evaluation of luteal phase length and natural fertility. Fertility and Sterility, 107(3):749 – 755, 2017. ISSN 0015-0282. doi: https://doi.org/10.1016/j.fertnstert.2016.11.022. URL http://www.sciencedirect.com/science/article/pii/S0015028216630224.
- Creinin et al. (2004) M. D. Creinin, S. Keverline, and L. A. Meyn. How regular is regular? An analysis of menstrual cycle regularity. Contraception, 70(4):289–292, 2004. doi: 10.1016/j.contraception.2004.04.012.
- Dagum (2018) P. Dagum. Digital biomarkers of cognitive function. npj Digital Medicine, 1(10), 2018. doi: https://doi.org/10.1038/s41746-018-0018-4.
- Druet (2018) A. Druet. What is an “irregular” menstrual cycle? https://helloclue.com/articles/cycle-a-z/what-is-an-irregular-menstrual-cycle, November 2018. Clue by BioWink GmbH, Adalbertstraße 7-8, 10999 Berlin, Germany.
- Egger et al. (2018) H. L. Egger, G. Dawson, J. Hashemi, K. L. H. Carpenter, S. Espinosa, K. Campbell, S. Brotkin, J. Schaich-Borg, Q. Qiu, M. Tepper, J. P. Baker, R. A. B. Jr., and G. Sapiro. Automatic emotion and attention analysis of young children at home: a ResearchKit autism feasibility study. npj Digital Medicine, 1(20), 2018. doi: https://doi.org/10.1038/s41746-018-0024-6.
- Epstein et al. (2017) D. A. Epstein, N. B. Lee, J. H. Kang, E. Agapie, J. Schroeder, L. R. Pina, J. Fogarty, J. A. Kientz, and S. A. Munson. Examining Menstrual Tracking to Inform the Design of Personal Informatics Tools. Proceedings of the SIGCHI conference on human factors in computing systems. CHI Conference, 2017:6876–6888, May 2017. doi: 10.1145/3025453.3025635. URL http://europepmc.org/articles/PMC5432133.
- Fehring et al. (2006) R. J. Fehring, M. Schneider, and K. M. Raviele. Variability in the phases of the menstrual cycle. Journal of obstetric, gynecologic, and neonatal nursing : JOGNN, 35 3:376–84, 2006.
- Ferrell et al. (2005) R. J. Ferrell, K. A. O’Connor, G. Rodriguez, T. Gorrindo, D. J. Holman, E. Brindle, R. C. Miller, D. E. Schechter, L. Korshalla, J. A. Simon, P. K. Mansfield, J. W. Wood, and M. Weinstein. Monitoring reproductive aging in a 5-year prospective study: aggregate and individual changes in steroid hormones and menstrual cycle lengths with age. Menopause, 12:567–757, 2005.
- Ferrell et al. (2006) R. J. Ferrell, J. A. Simon, S. M. Pincus, , G. Rodriguez, K. A. O’Connor, D. J. Holman, and M. Weinstein. The length of perimenopausal menstrual cycles increases later and to a greater degree than previously reported. Fertility and sterility, 86(3):619–624, 2006. doi: 10.1016/j.fertnstert.2006.01.045.
- Fox and Duggan (2012) S. Fox and M. Duggan. Mobile Health 2012. Technical report, Pew Research Center, November 2012. URL http://www.pewinternet.org/2012/11/08/mobile-health-2012/.
- Fox and Duggan (2013) S. Fox and M. Duggan. Tracking for Health. Technical report, Pew Research Center, January 2013. URL http://www.pewinternet.org/2013/01/28/tracking-for-health/.
- Giudice (2010) L. C. Giudice. Endometriosis. New England Journal of Medicine, 362(25):2389 – 2398, 2010. doi: 10.1056/NEJMcp1000274. URL http://dx.doi.org/10.1056/NEJMcp1000274.
- Gorrindo et al. (2007) T. Gorrindo, Y. Lu, S. Pincus, A. Riley, J. A. Simon, B. H. Singer, and M. Weinstein. Lifelong menstrual histories are typically erratic and trending: a taxonomy. Menopause, 14(1):74–88, 2007. doi: 10.1097/01.gme.0000227853.19979.7f.
- Harlow et al. (2012) S. D. Harlow, M. Gass, J. E. Hall, R. Lobo, P. Maki, R. W. Rebar, S. Sherman, P. M. Sluss, T. J. Villiers, and for the STRAW+10 Collaborative Group. Executive Summary of the Stages of Reproductive Aging Workshop + 10: Addressing the Unfinished Agenda of Staging Reproductive Aging. The Journal of Clinical Endocrinology & Metabolism, 97(4):1159–1168, 04 2012. ISSN 0021-972X. doi: 10.1210/jc.2011-3362. URL https://doi.org/10.1210/jc.2011-3362.
- Hripcsak et al. (2016) G. Hripcsak, P. B. Ryan, J. D. Duke, N. H. Shah, R. W. Park, V. Huser, M. A. Suchard, M. J. Schuemie, F. J. DeFalco, A. Perotte, J. M. Banda, C. G. Reich, L. M. Schilling, M. E. Matheny, D. Meeker, N. Pratt, and D. Madigan. Characterizing treatment pathways at scale using the OHDSI network. Proceedings of the National Academy of Sciences, 113(27):7329–7336, 2016. ISSN 0027-8424. doi: 10.1073/pnas.1510502113. URL https://www.pnas.org/content/113/27/7329.
- Johannisson et al. (1987) E. Johannisson, B.-M. Landgren, H. P. Rohr, and E. Diczfalusy. Endometrial morphology and peripheral hormone levels in women with regular menstrual cycles. Fertility and Sterility, 48(3):401 – 408, 1987. ISSN 0015-0282. doi: https://doi.org/10.1016/S0015-0282(16)59406-0. URL http://www.sciencedirect.com/science/article/pii/S0015028216594060.
- Jones et al. (2012) E. K. Jones, J. R. Jurgenson, J. M. Katzenellenbogen, and S. C. Thompson. Menopause and the influence of culture: another gap for Indigenous Australian women? BMC Women’s health, 12(43), 2012.
- Jordan et al. (1994) J. Jordan, K. Craig, D. K. Clifton, and M. R. Soules. Luteal phase defect: the sensitivity and specificity of diagnostic methods in common clinical use. Fertility and Sterility, 62(1):54 – 62, 1994. ISSN 0015-0282. doi: https://doi.org/10.1016/S0015-0282(16)56815-0. URL http://www.sciencedirect.com/science/article/pii/S0015028216568150.
- Kohane (2015) I. S. Kohane. Ten things we have to do to achieve precision medicine. Science, 349(6243):37–38, 2015. ISSN 0036-8075. doi: 10.1126/science.aab1328. URL http://science.sciencemag.org/content/349/6243/37.
- Kolmogorov (1933) A. N. Kolmogorov. Sulla determinazione empirica di una legge di distribuzione. Giornale dell’Istituto Italianodegli Attuari, 4:83–91, 1933.
- Krebs and Duncan (2015) P. Krebs and D. T. Duncan. Health app use among US mobile phone owners: a national survey. JMIR mHealth and uHealth, 3(4), 2015.
- Landgren et al. (2004) B.-M. Landgren, A. Collins, G. Csemiczky, H. G. Burger, L. Baksheev, and D. M. Robertson. Menopause Transition: Annual Changes in Serum Hormonal Patterns over the Menstrual Cycle in Women during a Nine-Year Period Prior to Menopause. The Journal of Clinical Endocrinology & Metabolism, 89(6):2763–2769, 2004. doi: 10.1210/jc.2003-030824. URL http://dx.doi.org/10.1210/jc.2003-030824.
- Lenton et al. (1984a) E. A. Lenton, B.-M. Landgren, and L. Sexton. Normal variation in the length of the luteal phase of the menstrual cycle: identification of the short luteal phase. BJOG: An International Journal of Obstetrics & Gynaecology, 91(7):685–689, 1984a. ISSN 1471-0528. doi: 10.1111/j.1471-0528.1984.tb04831.x. URL http://dx.doi.org/10.1111/j.1471-0528.1984.tb04831.x.
- Lenton et al. (1984b) E. A. Lenton, B.-M. Landgren, L. Sexton, and R. Harper. Normal variation in the length of the follicular phase of the menstrual cycle: effect of chronological age. BJOG: An International Journal of Obstetrics & Gynaecology, 91(7):681–684, 1984b. doi: 10.1111/j.1471-0528.1984.tb04830.x. URL https://obgyn.onlinelibrary.wiley.com/doi/abs/10.1111/j.1471-0528.1984.tb04830.x.
- Li et al. (2010) I. Li, A. Dey, and J. Forlizzi. A stage-based model of personal informatics systems. In Proceedings of the SIGCHI conference on human factors in computing systems, pages 557–566. ACM, 2010.
- Lippe Taylor, Inc (2004) Lippe Taylor, Inc. Scientific forum addresses menstrual cycle as vital sign, Sept. 2004. URL http://www.eurekalert.org/pub_releases/2004-09/lti-sfa092004.php.
- Mahoney (2010) M. M. Mahoney. Shift Work, Jet Lag, and Female Reproduction. International Journal of Endocrinology, 2010, 2010. ISSN 1687-8337. doi: 10.1155/2010/813764. URL https://www.ncbi.nlm.nih.gov/pmc/articles/PMC2834958/.
- Moglia et al. (2016) M. L. Moglia, H. V. Nguyen, K. Chyjek, K. T. Chen, and P. M. Castaño. Evaluation of Smartphone Menstrual Cycle Tracking Applications Using an Adapted Applications Scoring System. Obstetrics and Gynecology, 127(6):1153–1160, June 2016. ISSN 1873-233X. doi: 10.1097/AOG.0000000000001444.
- Münster et al. (1992) K. Münster, L. Schmidt, and P. Helm. Length and variation in the menstrual cycle — a cross-sectional study from a Danish county. The British Journal of Obstetrics and Gynaecology, 99:422 – 429, 1992.
- of Pediatrics et al. (2006) A. A. of Pediatrics, A. C. of Obstetricians, Gynecologists, et al. Menstruation in girls and adolescents: using the menstrual cycle as a vital sign. Pediatrics, 118(5):2245–2250, 2006.
- Pierson et al. (2018) E. Pierson, T. Althoff, and J. Leskovec. Modeling Individual Cyclic Variation in Human Behavior. In Proceedings of the 2018 World Wide Web Conference, WWW ’18, pages 107–116, Republic and Canton of Geneva, Switzerland, 2018. International World Wide Web Conferences Steering Committee. ISBN 978-1-4503-5639-8. doi: 10.1145/3178876.3186052. URL https://doi.org/10.1145/3178876.3186052.
- Pierson et al. (2019) E. Pierson, T. Althoff, D. Thomas, P. Hillard, and J. Leskovec. The menstrual cycle is a primary contributor to cyclic variation in women’s mood, behavior, and vital signs. bioRxiv, 2019. doi: 10.1101/583153. URL https://www.biorxiv.org/content/early/2019/03/20/583153.
- Popat et al. (2008) V. B. Popat, T. Prodanov, K. A. Calis, and L. M. Nelson. The menstrual cycle: a biological marker of general health in adolescents. Annals of the New York Academy of Sciences, 1135:43–51, 2008. ISSN 0077-8923. doi: 10.1196/annals.1429.040. URL https://www.ncbi.nlm.nih.govhttp://europepmc.org/articles/PMC2755071/.
- Prior (1998) J. C. Prior. Perimenopause: The Complex Endocrinology of the Menopausal Transition. Endocrine Reviews, 19(4):397–428, 1998. doi: 10.1210/edrv.19.4.0341. URL http://dx.doi.org/10.1210/edrv.19.4.0341.
- Prior and Hitchcock (2011) J. C. Prior and C. L. Hitchcock. The endocrinology of perimenopause: need for a paradigm shift. Frontiers in bioscience (Scholar edition), 3:474 – 486, 2011. ISSN 1945-0516. doi: 10.2741/s166. URL https://doi.org/10.2741/s166.
- Prior et al. (1987) J. C. Prior, Y. Vigna, D. Sciarretta, N. Alojado, and M. Schulzer. Conditioning exercise decreases premenstrual symptoms: a prospective, controlled 6-month trial. Fertility and Sterility, 47(3):402 – 408, 1987. ISSN 0015-0282. doi: https://doi.org/10.1016/S0015-0282(16)59045-1. URL http://www.sciencedirect.com/science/article/pii/S0015028216590451.
- Shuster et al. (2010) L. T. Shuster, D. J. Rhodes, B. S. Gostout, B. R. Grossardt, and W. A. Rocca. Premature menopause or early menopause: long-term health consequences. Maturitas, 65(2):161–166, Feb. 2010. ISSN 1873-4111. doi: 10.1016/j.maturitas.2009.08.003.
- Smets et al. (2018) E. Smets, E. R. Velazquez, G. Schiavone, I. Chakroun, E. D’Hondt, W. D. Raedt, J. Cornelis, O. Janssens, S. V. Hoecke, S. Claes, I. V. Diest, and C. V. Hoof. Large-scale wearable data reveal digital phenotypes for daily-life stress detection. npj Digital Medicine, 1(67), 2018. doi: https://doi.org/10.1038/s41746-018-0074-9.
- Snowden et al. (1983) R. Snowden, B. Christian, and World Health Organization. Patterns and perceptions of menstruation: a World Health Organization international collaborative study in Egypt, India, Indonesia, Jamaica, Mexico, Pakistan, Philippines, Republic of Korea, United Kingdom and Yugoslavia. Published in cooperation with the World Health Organization by Croom Helm., 1983.
- Solomon et al. (2001) C. G. Solomon, F. B. Hu, A. Dunaif, J. Rich-Edwards, W. C. Willett, D. J. Hunter, G. A. Colditz, F. E. Speizer, and J. E. Manson. Long or highly irregular menstrual cycles as a marker for risk of type 2 diabetes mellitus. Jama, 286(19):2421–2426, 2001.
- Solomon et al. (2002a) C. G. Solomon, F. B. Hu, A. Dunaif, J. E. Rich-Edwards, M. J. Stampfer, W. C. Willett, F. E. Speizer, and J. E. Manson. Menstrual cycle irregularity and risk for future cardiovascular disease. The Journal of Clinical Endocrinology & Metabolism, 87(5):2013–2017, 2002a.
- Solomon et al. (2002b) C. G. Solomon, F. B. Hu, A. Dunaif, J. E. Rich-Edwards, M. J. Stampfer, W. C. Willett, F. E. Speizer, and J. E. Manson. Menstrual cycle irregularity and risk for future cardiovascular disease. The Journal of Clinical Endocrinology and Metabolism, 87(5):2013–2017, May 2002b. ISSN 0021-972X. doi: 10.1210/jcem.87.5.8471.
- Symul et al. (2019) L. Symul, K. Wac, P. Hillard, and M. Salathé. Assessment of menstrual health status and evolution through mobile apps for fertility awareness. npj Digital Medicine, 2(64), 2019. doi: https://doi.org/10.1038/s41746-019-0139-4.
- Torous et al. (2018) J. Torous, P. Staples, I. Barnett, L. R. Sandoval, M. Keshavan, and J.-P. Onnela. Characterizing the clinical relevance of digital phenotyping data quality with applications to a cohort with schizophrenia. npj Digital Medicine, 1(15), 2018. doi: https://doi.org/10.1038/s41746-018-0022-8.
- Treloar et al. (1967) A. E. Treloar, R. E. Boynton, B. G. Behn, and B. W. Brown. Variation of the human menstrual cycle through reproductive life. International journal of fertility, 12(1 Pt 2):77–126, 1967. ISSN 0020-725X. URL http://europepmc.org/abstract/MED/5419031.
- Urteaga et al. (2018) I. Urteaga, M. McKillop, S. Lipsky-Gorman, and N. Elhadad. Phenotyping Endometriosis through Mixed Membership Models of Self-Tracking Data. In 2018 Machine Learning for Healthcare (MLHC), 2018. URL https://www.mlforhc.org/s/27.pdf.
- Vitzthum (2009) V. J. Vitzthum. The ecology and evolutionary endocrinology of reproduction in the human female. American Journal of Physical Anthropology, 140(S49):95–136, 2009. doi: 10.1002/ajpa.21195. URL https://onlinelibrary.wiley.com/doi/abs/10.1002/ajpa.21195.
- Vitzthum et al. (2000) V. J. Vitzthum, H. Spielvogel, E. Caceres, and J. Gaines. Menstrual patterns and fecundity among non-lactating and lactating cycling women in rural highland Bolivia: implications for contraceptive choice. Contraception, 62(4):181 –187, 2000. doi: 10.1016/S0010-7824(00)00164-5.
- Wartella et al. (2016) E. Wartella, V. Rideout, H. Montague, L. Beaudoin-Ryan, and A. Lauricella. Teens, health and technology: A national survey. Media and Communication, 4(3):13–23, 1 2016. ISSN 2183-2439. doi: 10.17645/mac.v4i3.515.
- Webster et al. (2018) D. E. Webster, C. Suver, M. Doerr, E. Mounts, L. Domenico, T. Petrie, S. A. Leachman, A. D. Trister, and B. M. Bot. The Mole Mapper Study, mobile phone skin imaging and melanoma risk data collected using ResearchKit. Scientific Data, 4(170005), 2018. doi: https://doi.org/10.1038/sdata.2017.5.
- Williams (2006) S. R. Williams. Menstrual cycle characteristics and predictability of ovulation of Bhutia women in Sikkim, India. Journal of physiological anthropology, 25(1):85–90, 2006.
- Zittermann et al. (2000) A. Zittermann, I. Schwarz, K. Scheld, T. Sudhop, H. K. Berthold, K. von Bergmann, H. van der Ven, and P. Stehle. Physiologic fluctuations of serum estradiol levels influence biochemical markers of bone resorption in young women. The Journal of Clinical Endocrinology and Metabolism, 85(1):95–101, Jan. 2000. ISSN 0021-972X. doi: 10.1210/jcem.85.1.6250.