Unveiling the weak radio quasar population at
Abstract
We applied image stacking on empty-field Faint Images of the Radio Sky at Twenty-Centimeters (FIRST) survey maps centred on optically identified high-redshift quasars at to uncover the hidden Jy radio emission in these active galactic nuclei (AGN). The median stacking procedure for the full sample of optically identified AGN uncovered an unresolved point source with an integrated flux density of 52 Jy, with a signal-to-noise ratio . We co-added the individual image centre pixels to estimate the characteristic monochromatic radio power at GHz considering various values for the radio spectral index, revealing a radio population with W Hz-1. Assuming that the entire radio emission originates from star-forming (SF) activity in the nuclear region of the host galaxy, we obtained an upper limit on the characteristic star formation rate, M⊙ yr-1. The angular resolution of FIRST images is insufficient to distinguish between the SF and AGN origin of radio emission at these redshifts. However, a comparison with properties of individual sources from the literature indicates that a mixed nature is likely. Future very long baseline interferometry radio observations and ultra-deep Square Kilometre Array surveys are expected to be sensitive enough to detect and resolve the central kpc region in the host galaxies, and thus discriminate between SF and AGN related emission.
keywords:
galaxies: active – radio continuum: galaxies – galaxies: star formation – galaxies: high-redshift – quasars: general – methods: data analysis1 Introduction
Since the discovery of the first quasar at redshift (Warren et al., 1987), the number of active galactic nuclei (AGN) known at the highest redshifts is continuously increasing. As a result of extensive observing campaigns and surveys (e.g., York et al., 2000; Wright et al., 2010; Eisenstein et al., 2011; Chambers et al., 2016; Dark Energy Survey Collaboration et al., 2016; Blanton et al., 2017), there are nearly sources identified between and to date, yet only per cent of these exhibit radio emission (Perger et al., 2017) detected at 1.4 GHz by either the Very Large Array (VLA) Faint Images of the Radio Sky at Twenty-Centimeters111http://sundog.stsci.edu/ (FIRST, Becker, White & Helfand, 1995; Helfand, White & Becker, 2015) survey or the National Radio Astronomy Observatory (NRAO) VLA Sky Survey222https://www.cv.nrao.edu/nvss/ (NVSS, Condon et al., 1998). The remaining sources are either outside the footprint of both FIRST and NVSS, or are below the detection limit of the two surveys.
Several studies are available in the literature on the overall radio luminosity function (LF) for AGN (e.g., Condon, 1991; Willott et al., 1998; Goldschmidt et al., 1999; Best et al., 2014; Pracy et al., 2016; Mao et al., 2017; Smolčić et al., 2017c). Many authors found evidence for bimodality in the distribution of the AGN population (e.g., Strittmatter et al., 1980; Kellermann et al., 1989; Goldschmidt et al., 1999; White et al., 2007), dividing the population to distinct samples of radio-loud and radio-quiet objects. The validity of this dichotomy was recently challenged and found to be the result of observational and mathematical bias effects (Zamfir, Sulentic & Marziani, 2008; Mahony et al., 2012; Baloković et al., 2012; Condon et al., 2013). The weak radio emitters with flux densities below the detection threshold ( mJy for FIRST and mJy for NVSS) might also exhibit radio jets at parsec scales (e.g., Wang et al., 2017), but generally remain silent and hidden in flux density limited surveys due to their low radio power and large distance. Faint objects with radio flux densities below the FIRST detection limit can either host radio-quiet AGN, or harbour radio-loud quasars that reside at higher redshifts.
The lurking low- and modest-power members of the high-redshift AGN (hAGN) population can be uncovered by going below the survey threshold and estimating their typical flux densities by means of radio image stacking (e.g., White et al., 2007). Numerous works with stacking analysis are available in the literature on various samples of radio-weak quasars. Analysis of stacked FIRST images at radio-quiet quasar positions from the 2dF QSO redshift survey at medium redshifts () resulted in median flux density levels between and Jy (Wals et al., 2005). Hodge et al. (2008) also found 10s of Jy flux densities for a mixed set of Sloan Digital Sky Survey (SDSS) and Luminous Red Galaxy samples. Stacking of extremely red quasars at using VLA maps at and GHz yielded similar values (Hwang et al., 2018).
There is a debate on the nature of physical processes responsible for the radio emission at the faint end ( W Hz-1) of the continuous radio LF, with possible contribution of AGN jets (Zensus, 1997; Roy et al., 2018), AGN winds (Jiang et al., 2010; Zakamska & Greene, 2014; Zakamska et al., 2016; Roy et al., 2018), and enhanced star formation or starburst events in the host galaxy (Jahnke, Kuhlbrodt & Wisotzki, 2004; Condon et al., 2013; Rosario et al., 2013; Hwang et al., 2018). The origin of radio emission in radio-quiet AGN was also hypothesized to be driven by magnetically heated accreation disk coronae (Laor & Behar, 2008; Laor, Baldi & Behar, 2019). Upper limits on star formation rate (SFR) determined in stacking studies vary between a few to M⊙ yr-1 (e.g., de Vries et al., 2007; Hodge et al., 2008). In other works, low-luminosity AGN jets and circumnuclear star-forming regions in the host galaxies together are considered responsible for the radio emission (e.g., Karim et al., 2011; Pierce, Ballantyne & Ivison, 2011). It was also found that the radio LF usually peaks at higher redshifts for radio-loud sources than for radio-quiet AGN (Goldschmidt et al., 1999; Mao et al., 2017). A multi-wavelength study of a radio-selected Cosmic Evolution Survey (COSMOS) field sample (Jy) at suggested star formation as the dominant process for the sub-mJy radio population, explaining the dichotomy with AGN activity modes and connection to AGN–host galaxy feedback (Delvecchio et al., 2017). Another study using a sample with Jy applied spectral energy distribution fitting and led to similar conclusions: the peak of the radio LF is at (Ceraj et al., 2018). The radio loudness dichotomy was addressed also at low radio frequencies ( MHz, Gürkan et al., 2019), concluding that low-power quasars are dominated by star formation.
In this paper, we utilised empty-field FIRST radio maps centred at positions of hAGN (quasars) identified in the optical or near-infrared. We analysed them with mean and median stacking methods to uncover the underlying radio quasar population, and to examine the possibility of the radio emission originating from either AGN activity or star formation. The aspects of sample selection are detailed in Section 2. We describe the stacking procedure in Section 3. Results and derived properties are discussed in Section 4. We summarise our findings and conclude the paper in Section 5.
Throughout this work, we assumed a standard CDM cosmological model with , and km s-1 Mpc-1 for calculations.
2 Sample selection and data
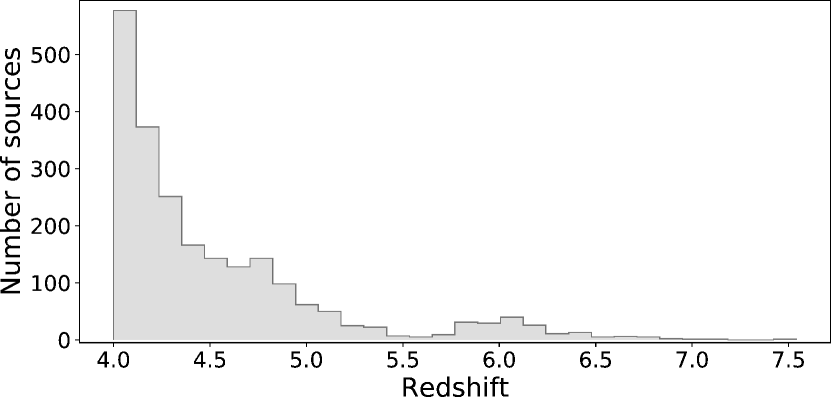
The sample for the stacking analysis was defined by using the high-redshift () AGN catalogue by Perger et al. (2017)333The regularly updated version of the catalogue can be accessed at http://astro.elte.hu/~perger/catalog.html. We selected optically identified AGN from the catalogue with positions falling into the FIRST survey footprint. The flux density of the objects selected is below the detection limit of the survey (typically mJy). At the time of the analysis, the total number of such AGN was . Intensity fluctuations (rms noise) at the optical AGN positions in the FIRST images vary in the range from tens of Jy to mJy. To test an underlying high-redshift radio AGN population, we stacked FIRST radio maps centred at these positions. The images in Flexible Image Transport System (FITS) format (Wells, Greisen & Harten, 1981) were obtained from the FIRST image cutout service444https://third.ucllnl.org/cgi-bin/firstcutout. We downloaded images of size for each individual AGN position. After excluding the largely incomplete or entirely ragged maps, we obtained images for the stacking process. The redshift distribution of the stacked sample is shown in Fig. 1, and the first 5 entries of the list of AGN are given in Table 1. The full list is available in the supplementary material.
| Name | R.A. (h m s) | Dec () | Redshift | Reference |
|---|---|---|---|---|
| SDSS J000046.69+010951.2 | 4.25 | Pâris et al. (2012) | ||
| SDSS J000124.23+111212.6 | 4.30 | Pâris et al. (2017) | ||
| SDSS J000404.71+000039.0 | 4.31 | Pâris et al. (2012) | ||
| SDSS J000457.11000538.7 | 4.05 | Pâris et al. (2012) | ||
| SDSS J000527.14+025813.2 | 4.11 | Pâris et al. (2012) |
Notes. Column 1 – object name, Column 2 – right ascension, Column 3 – declination, Column 4 – spectroscopic redshift, Column 5 – literature reference of discovery. The full table of AGN is available in the electronic version of the journal.
3 Stacking analysis
3.1 Stacking of catalogue sources
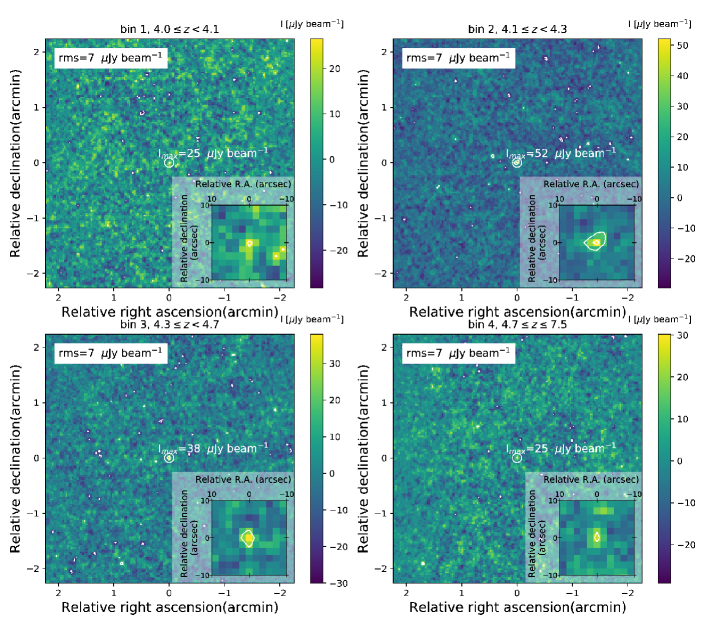
The sample of objects were binned based on the redshift of each source into four subsamples with approximately equal number of images in each bin. There are , , , and objects in the four bins with redshift boundaries of and , respectively.
We performed the stacking in both mean and median procedures. Both the mean (e.g. White et al., 2007; de Vries et al., 2007; Hodge et al., 2008) and median (e.g. White et al., 2007; de Vries et al., 2007; Hodge et al., 2008; Hwang et al., 2018; Roy et al., 2018) stacking methods are commonly used in the literature. Mean stacking determines the arithmetic average of intensities in the image pixels within the sample. However, this method is very sensitive to outlying values in the sample, as well as to the threshold set to avoid the contaminating point sources. In turn, median stacking deals with the median of intensity values corresponding to the image pixels in the sample.
To evaluate the applicability of maps resulted from both methods, we calculated root-mean-square (rms) noise, maximum of the intensity, and signal-to-noise ratio (SNR) for both the mean and median stacked images in each bin and for the full sample. Typical rms noise values in the separate redshift bins span the range Jy beam-1 for mean stacked images, while median stacking resulted in Jy beam-1 noise levels. The full-sample maps have Jy beam-1 and Jy beam-1 rms noise for the mean and median methods, respectively.
| Bin | rms [Jy beam-1] | [Jy beam-1] | SNR |
|---|---|---|---|
| 1 | 7 | 27 | 4 |
| 2 | 7 | 52 | 7 |
| 3 | 7 | 38 | 5 |
| 4 | 7 | 30 | 4 |
| All | 3 | 35 | 11 |
Notes. Column 1 – redshift bin, Column 2 – image noise, Column 3 – maximum intensity, Column 4 – signal-to-noise ratio
Despite the high SNR values (up to ) found in each mean-stacked map, the method provides insignificant results in the search of a hidden central source. The maps are contaminated and dominated by peaks at random off-centre locations, caused by strong intensity peaks from the stacked individual maps. The presence of off-centre sources leads to an increase of the rms image noise in the field compared to median stacking. Therefore mean-stacked maps are not considered in the further study and calculations.
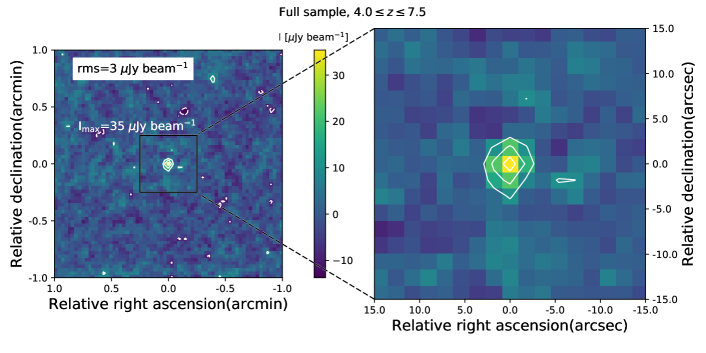
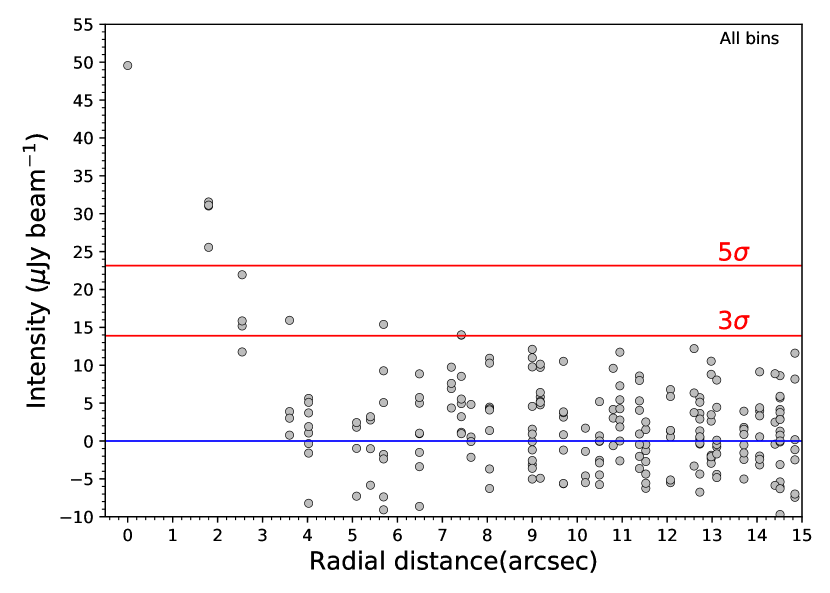
Median maps on the contrary are not sensitive to occasional bright off-centre sources. They show a nearly uniform noise level in each subsample (Jy beam-1), revealing a protruding radio peak at the image centre for the entire sample with SNR exceeding 10. Intensity maxima for the median-stacked images are found to be and Jy beam-1 for the redshift-binned data, and Jy beam-1 for the full sample. Radio maps obtained by median stacking are shown in Fig. 2, for which the calculated image properties are listed in Table 2, while the radial profile of the full-sample median-stacked image is illustrated in Fig. 3.
The image rms noise reached by stacking is expected to decrease with respect to the single-image rms by , where is the number of stacked images. The original FIRST image noise levels are mJy. For the sample of objects, this predicts the rms of Jy beam-1 divided by , i.e. Jy beam-1 to be reached with stacking. Indeed, this is equal to the actual rms values obtained for the full-sample median-stacked images.
3.2 Stacking of fake sources and the image noise
To check the reliability of our results, we created four samples of the same size, with arbitrary source coordinates in the manner of adding or subtracting to/from either or both the right ascensions and declinations of objects in the the original sample. Binning was based on the redshifts of AGN in the original (true) positions.
We did not find any radio emission in either of the four samples of fake sources, neither with mean, nor with median stacking methods. The mean images show outlier sources outside the central pixels, similarly to the results obtained for the true sample. The rms noise levels of the binned subsample maps are Jy beam-1 and Jy beam-1 for the mean and median stacking, respectively. Stacking of all images resulted in rms values comparable to that of the real sample and consistent with the expected values from the stacking procedure, Jy beam-1 for mean and Jy beam-1 for median maps. The SNR values for the mean images vary from to in the separate redshift bins, and are below when the full fake samples were included in mean stacking. The image peaks are caused by occasional bright off-centre sources appearing in some fields, similarly to the real sample. For median stacking, the typical values in the fabricated samples and in their subsets are in the range of , and indicate no significant detection at the central location, as expected. Due to the similar SNR values in the samples of fake sources, the binned data were not considered for further analysis, only the full sample.
3.3 Model fit to the stacked data
For further analysis, we fitted a circular Gaussian model component to the central region of the full-sample median-stacked image, to characterise the brightness distribution using the imfit task in the U.S. National Radio Astronomy Observatory (NRAO) Astronomical Image Processing System555http://www.aips.nrao.edu/index.shtml (aips, Greisen, 2003). This resulted in an unresolved point source. By multiplying the fitted model component flux density with the bias correction factor of suggested by White et al. (2007), we obtained an unbiased value of .
3.4 Characteristic 1.4-GHz radio power
To derive a characteristic value of the monochromatic rest-frame 1.4-GHz radio power for the hAGN population, we co-added the individual FIRST image cutouts around the positions of the full sample of objects that are individually not detected in the FIRST survey. Motivated by the model-fitting results of the median stacking, we assumed that the radio emission originates from point sources unresolved in FIRST. Thus the flux density was derived from the cumulative brightness value of the central pixel for the following analysis. We consider that the co-added flux density of the hAGN is the sum of the flux densities of the individual sources, and that all hAGN included in the stacking process have the same radio power at GHz, . This latter assumption is obviously not true, but the value derived this way is characteristic to the hAGN sample as a whole.
We used the following relationship between flux density and power (including -correction):
| (1) |
where mJy is the cumulative flux density derived from co-adding the FIRST map centres, is the radio spectral index (using the convention , where is the frequency), and and are the luminosity distance and the redshift of the -th individual source, respectively. Since the individual power-law spectral indices are unknown for the sources, we assumed a common value for the whole sample. Various radio spectral indices appropriate for galaxies are found in the literature (e.g. Hopkins et al., 2003; Hyvönen et al., 2007; White et al., 2007; Hwang et al., 2018). Therefore we calculated the characteristic power considering several different values in the range , corresponding to steep radio spectra. The estimated values of the -GHz power for each spectral index are listed in Col. 2 in Table 3.
3.5 Upper limit on star formation
Radio emission from galaxies may originate from AGN activity in the nuclear region where synchrotron radiation is produced in powerful relativistic plasma jets driven by accretion onto the central supermassive black hole. On the other hand, synchrotron emission from relativistic electrons and free-free emission from ionized hydrogen regions may be widespread in the AGN host galaxy as a consequence of recent start formation (e.g. Condon, 1992).
We can assume that the radio emission in our stacked hAGN sample originates solely from star formation taking place around the central regions of the host galaxy, rather than from AGN activity. This way we can calculate an upper limit on the star formation rate (SFR) using the estimated characteristic -GHz power value, applying various correlations between the radio power and SFR from the literature (Bell, 2003; Schmitt et al., 2006; Davies et al., 2017; Mahajan et al., 2019). The SFR values obtained are listed in Cols. 3–6 in Table 3. The upper limits on the SFR span about an order of magnitude, depending on the radio spectral index assumed and the correlation used. But we can conclude that the typical SFR upper limits are in the order of M⊙ yr-1.
4 Discussion
4.1 Flux densities
The flux density of Jy found in our median stacking analysis is comparable but somewhat higher than the values obtained in previous stacking works (e.g. Wals et al., 2005; White et al., 2007; Hodge et al., 2008; Hwang et al., 2018). Considering that our sources are located at higher redshifts, this suggests that the hAGN are generally intrinsically more powerful than the sources studied in those samples.
For comparison, the ultraluminous quasar SDSS J010013.02+280225.8 at – not included in our stacking analysis due to its position outside the FIRST survey footprint – was detected with the VLA at a higher frequency, 3 GHz ( resolution and Jy beam-1 sensitivity), with a flux density of Jy (Wang et al., 2016). Assuming a spectral index of , this scales to Jy at GHz. Further high-resolution observations performed with the Very Long Baseline Array (VLBA) at GHz revealed a radio structure partially resolved at milli-arcsecond (mas) level, with Jy flux density (Wang et al., 2017). The detection of a mas-scale radio structure in this individual source raises the possibility that the FIRST-undetected sources in our stacked sample could also be targeted with sensitive very long baseline interferometry (VLBI) observations in the future, in a hope of revealing weak compact AGN-related radio emission. It also suggests that the radio emission in at least some of the sources in our -element sample does have synchrotron AGN jet contribution and is not associated with star formation only.
4.2 Radio power and AGN radio emission
All estimated values for the -GHz radio power are W Hz-1 (Table 3) in this study. If the radio emission in these objects would originate solely from AGN activity, the FIRST-undetected hAGN would be among the radio AGN population ( W Hz-1), since powers exceed the threshold found in empirical studies between supernova-related and AGN activity ( W Hz-1, Kewley et al., 2000; Middelberg et al., 2011). The estimated radio powers also surpass values measured for prominent starburst galaxies, e.g. Arp 220, Arp 229A, and Mrk 273 ( W Hz-1, Alexandroff et al., 2012).
Monochromatic powers found in this work are 2 to 5 orders of magnitude higher than those found for low-power sources at low redshifts (), e.g. Lyman-break analogues (LBAs) including an LBA with dominant star formation (J0150+1308), an AGN (J1029+4829) and an AGN–SFR composite source (J0921+4509) (Alexandroff et al., 2012). Also, low-redshift AGN SDSS J1155+1507, SDSS J21040009, SDSS J23040933 (Gabányi et al., 2016), and NGC 3147 (Anderson, Ulvestad & Ho, 2004) exhibit radio powers in the range of W Hz-1 to a few times W Hz-1, or even lower powers between W Hz-1 to a few times W Hz-1 in the AGN Henize 2-10 (Reines & Deller, 2012), NGC 4203, NGC 4535 (Ulvestad & Ho, 2002; Anderson, Ulvestad & Ho, 2004), NGC 864, and NGC 4123 (Ulvestad & Ho, 2002). It was discussed in e.g. Best et al. (2005); Sadler et al. (2008); Simpson et al. (2013) and Rees et al. (2016) that the most luminous AGN have radio powers in the range from W Hz-1 to a few times W Hz-1, which is comparable with our results. These studies of low-redshift AGN found that host galaxies with -GHz powers above W Hz-1 usually host radio-loud AGN in their centres. This outlines that AGN activity represents a significant contribution to the 1.4 GHz radio flux densities in the stacked sample.
Deep radio surveys at high redshift, such as the Extended Chandra Deep Field-South (E-CDFS, Miller et al., 2008, 2013) survey and the VLA-COSMOS 3 GHz Large Project (Smolčić et al., 2017a) can provide additional information about the most distant galaxy centres. Our estimated radio powers ( WHz-1) are supported by the results achieved by e.g. Delvecchio et al. (2017), Smolčić et al. (2017b), and Smolčić et al. (2017c). In a multiwavelength analysis of radio sources in the COSMOS field at 3 GHz, Delvecchio et al. (2017) divided the sample into three populations: radio-quiet (RQ) and radio-loud (RL) AGN, and star-forming galaxies (SFGs). The majority of RQ AGN hosts show enhanced star formation. Similar results were obtained by Smolčić et al. (2017b), revealing that radio sources at GHz with flux densities above Jy are predominantly AGN, and that with decreasing flux densities the SFGs take over as the dominant population in up to per cent of the sample. However, the GHz luminosity functions determined for AGN with radio excess (with respect to the expected contribution of SF to the radio emission) using different procedures by Smolčić et al. (2017c) showed that rest-frame radio powers span the range of WHz-1 for AGN at the highest redshifts, when relying solely on observational data, and WHz-1 with the application of evolution models. The fractional distribution found in the COSMOS field studies would imply an RQ–SFG dominance in the sample. Our estimated radio powers suggest that the objects in the stacking analysis are mostly radio-loud AGN. Another study of radio sources below Jy based on the E-CDFS survey concluded that besides the dominance of SFGs and the decrase of the RL AGN towards the lowest flux densities, the number of RQ AGN increases (Bonzini et al., 2013). They also determined radio power distributions for all three populations, and found median values of both RQ and RL AGN which coincide with our estimated radio powers, while the power at the peak of the distribution for SFGs is an order of magnitude lower.
4.3 Star formation rate
SFR upper limits derived in this paper (Table 3) are two to three orders of magnitude higher than SFR values found for individual AGN host galaxies in the literature, e.g. M⊙ yr-1 for SDSS J21040009 and SDSS J23040933 (Gabányi et al., 2016), M⊙ yr-1 for J0150+1308, J0921+4509, and J1029+4829 (Alexandroff et al., 2012), and M⊙ yr-1 with Hα star formation rates predicted by Ulvestad & Ho (2002), as well as SFR with upper limits found in previous works using image stacking ( M⊙ yr-1, e.g. de Vries et al., 2007; Hodge et al., 2008). Even ultraluminous infrared galaxies were found to show star formation with rates varying between a couple of tens to a few hundreds of M⊙ yr-1 (e.g. Howell et al., 2010), suggesting that our upper limits appreciably overestimate the contribution of star formation to the 1.4-GHz radio power.
However, turning to high-redshift objects, CO and [C II] line detection and dust emission in individual quasars indicate significant star formation in the central few kpc region in some host galaxies, with SFR in the order of M⊙ yr-1 (e.g. Bertoldi et al., 2003; Willott, Omont & Bergeron, 2013; Wang et al., 2013; Shao et al., 2019). Note that those AGN with an estimated SFR of a few thousand M⊙ yr-1 have not been included in our stacked sample because they are outside the FIRST survey coverage. For some individual objects that are included in our FIRST image stacking, molecular and atomic line observations determined a wide range of SFR values. These start from a few tens of M⊙ yr-1, e.g. M⊙ yr-1 for CFHQS J02100456, M⊙ yr-1 for CFHQS J23290301 (Willott, Omont & Bergeron, 2013), and M⊙ yr-1 for CFHQS J0055+0146 (Willott, Bergeron & Omont, 2015). SFR values of a couple of hundreds M⊙ yr-1 were found for VIKING J23483054 and VIKING J01093047 ( and M⊙ yr-1, respectively, Venemans et al., 2016), ULAS J1120+0641 ( M⊙ yr-1, Venemans et al., 2017), and SDSS J0100+2800 ( M⊙ yr-1, Wang et al., 2016). There are also examples of sources with SFR up to thousands of M⊙ yr-1 (Walter et al., 2004; Venemans et al., 2019).
The difference between the SFR upper limits we estimated as characteristic for the stacked hAGN sample ( M⊙ yr-1, Table 3) and the values measured for individual sources using independent methods is naturally explained if we relax the assumption that the entire radio emission comes from star forming activity in the host galaxies, without AGN contribution. Moreover, we calculated with a single characteristic radio power for all sources. In reality, the physical conditions in the individual objects are clearly more complex than just assuming a constant power, and one or the other process solely responsible for the radio emission. In fact, radio emission originating from both AGN and star formation must be present in most objects, in various proportions.
In a hope to refine the results, one may take the AGN radio luminosity function (LF) into account, up to the highest redshifts (e.g. Smolčić et al., 2017c; Ceraj et al., 2018). Improvements in determining the radio LF at the earliest cosmological epochs are expected from the currently ongoing GHz VLA Sky Survey (VLASS, Murphy & VLASS Survey Science Group, 2015). It will have higher sensitivity (Jy for the combined 3-epoch observations) and angular resolution () compared to the FIRST survey. Also, repeating a stacking analysis similar to the one reported here, the deeper VLASS radio maps would allow for determining redshift-dependent properties of the FIRST-undetected AGN. Our study with binned sub-samples did not provide conclusive results because of the insufficient SNR in the stacked images.
4.4 Origin of the sub-mJy radio emission
Ascertaining the role of SF and AGN contribution to the sub-mJy radio emission could be aided by the application of methods independent from the FIRST observations. Based on mid-infrared (MIR) polycyclic aromatic hydrocarbon (PAH) detections in low-redshift galaxies, PAH emission lines can be found very close to the galaxy core, at kpc distances (e.g., Shi et al., 2007; Martínez-Paredes et al., 2019). Since star formation indicators are found this close to the core, and our stacking analysis showed that the fitted Gaussian model component is unresolved in FIRST (corresponding to kpc linear size depending on the redshift), the angular resolution provided by FIRST is insufficient to distinguish between star formation and AGN related emission. Observations with the upcoming Square Kilometre Array (SKA), in cooperation with globally distributed VLBI arrays could provide an adequate mas or sub-mas resolution (Godfrey et al., 2012; Paragi et al., 2015) and the thermal sensitivity of a few Jy (Paragi et al., 2015) sufficient for direct detection of compact AGN-related radio emission in the most powerful members of the radio-hAGN population.
The importance and contribution of SF to the radio emission can also be tackled using MIR observations. Considering the correlation between the MIR and -GHz radio powers, and applying the fit parameters in Wu et al. (2005), we calculated the m and m powers that correspond to the characteristic values found in our study. Consistency of the MIR–radio correlation is considered invariant for 5 orders of magnitude of flux densities up to (Yun, Reddy & Condon, 2001; Ibar et al., 2008) and was found reliable even at Jy levels (Garn & Alexander, 2009). Characteristic MIR flux densities were estimated for our hAGN sample, based on the characteristic power derived from the co-added 1.4-GHz FIRST radio maps. Values of mJy and mJy were found for the m and m flux densities, with mean values mJy and mJy, respectively. To estimate the level of AGN contamination contributing to the calculated values of SFR, we determined values using FIRST upper limits and m flux densities derived using m emission measured by the Wide-field Infrared Survey Explorer (WISE, Wright et al., 2010) from the AllWISE catalog666http://wise2.ipac.caltech.edu/docs/release/allwise/ (Cutri et al., 2014). We followed the analysis described by e.g. Bonzini et al. (2013). On the one hand, all sources detected by WISE are above the theoretical limit separating RL AGN from RQ AGN and SFGs, so no further constraints could be obtained. On the other hand, the m flux densities are in the range of mJy with a mean value of mJy, which is an order of magnitude lower than the values calculated from the MIR–radio correlation, assuming all radio emission is SF-related. This indicates radio excess for the stacked objects (at least those with WISE detection), implying that the radio emission is AGN-related.
5 Summary
We applied median stacking on 1.4-GHz VLA FIRST survey image cutouts centred on optically identified but individually radio-undetected quasar positions. These objects populate the redshift range . Stacking of the full sample resulted in an unresolved point source with a bias-corrected flux density Jy. Co-adding the radio map central pixels revealed a moderately radio-loud AGN population, with a characteristic 1.4-GHz radio power W Hz-1. Under the simplifying assumption that the entire radio emission in the sample is produced by star forming activity in the quasar host galaxies, we obtained upper limits of the star formation rate in the order of a few M⊙ yr-1. Based on literature data on individual AGN, we argue that the source of radio emission in the sample is rather a mixture of star formation and AGN-related activity. The spatial resolution of FIRST images is not sufficient to distinguish between the different mechanisms responsible for the radio emission. Future measurements with VLBI and SKA-VLBI could help determining the relative importance of the two emission types in individual objects. Stacking studies similar to the one presented here will benefit from the improved sensitivity and angular resolution of the ongoing VLASS whose radio images could provide data sufficient for determining redshift-dependent properties of high-redshift radio quasars.
Acknowledgements
We are grateful for the constructive comments by the anonymous referee that led to an improved discussion of our results. This publication makes use of data products from the Wide-field Infrared Survey Explorer, which is a joint project of the University of California, Los Angeles, and the Jet Propulsion Laboratory/California Institute of Technology, funded by the National Aeronautics and Space Administration. KÉG was supported by the János Bolyai Research Scholarship of the Hungarian Academy of Sciences, and by the Ministry of Human Capacities within the framework of the ÚNKP (New National Excellence Program).
References
- Alexandroff et al. (2012) Alexandroff R., et al., 2012, MNRAS, 423, 1325
- Anderson, Ulvestad & Ho (2004) Anderson J. M., Ulvestad J. S., Ho L. C., 2004, ApJ, 603, 42
- Bañados et al. (2018) Bañados E., et al., 2018, Nature, 553, 473
- Baloković et al. (2012) Baloković M., Smolčić V., Ivezić Ž., Zamorani G., Schinnerer E., Kelly B. C., 2012, ApJ, 759, 30
- Becker, White & Helfand (1995) Becker R. H., White R. L., Helfand D. J., 1995, ApJ, 450, 559
- Bell (2003) Bell E. F., 2003, ApJ, 586, 794
- Bertoldi et al. (2003) Bertoldi F., et al., 2003, A&A, 409, L47
- Best et al. (2005) Best P. N., Kauffmann G., Heckman T. M., Brinchmann J., Charlot S., Ivezić Ž., White S. D. M., 2005, MNRAS, 362, 25
- Best et al. (2014) Best P. N., Ker L. M., Simpson C., Rigby E. E., Sabater J., 2014, MNRAS, 445, 955
- Blanton et al. (2017) Blanton M. R., et al., 2017, AJ, 154, 28
- Bonzini et al. (2013) Bonzini M., et al., 2013, MNRAS, 436, 3759
- Ceraj et al. (2018) Ceraj L., et al., 2018, A&A, 620, A192
- Chambers et al. (2016) Chambers K. C., et al., 2016, arXiv:1612.05560
- Condon (1991) Condon J. J., 1991, ASP Conf. Ser., 18, 113
- Condon (1992) Condon J. J., 1992, ARA&A, 30, 575
- Condon et al. (1998) Condon J. J., Cotton W. D., Greisen E. W., Yin Q. F., Perley R. A., Taylor G. B., Broderick J. J., 1998, AJ, 115, 1693
- Condon et al. (2013) Condon J. J., Kellermann K. I., Kimball A. E., Ivezić Ž., Perley R. A., 2013, ApJ, 768, 37
- Cutri et al. (2014) Cutri R. M., et al., 2014, yCat, II/328
- Dark Energy Survey Collaboration et al. (2016) Dark Energy Survey Collaboration, et al., 2016, MNRAS, 460, 1270
- Davies et al. (2017) Davies R. I., et al., 2017, MNRAS, 466, 4917
- de Gasperin et al. (2011) de Gasperin F., Merloni A., Sell P., Best P., Heinz S., Kauffmann G., 2011, MNRAS, 415, 2910
- de Vries et al. (2007) de Vries W. H., Hodge J. A., Becker R. H., White R. L., Helfand D. J., 2007, AJ, 134, 457
- Delvecchio et al. (2017) Delvecchio I., et al., 2017, A&A, 602, A3
- Djorgovski et al. (2001) Djorgovski S. G., Mahabal A. A., Brunner R. J., Gal R. R., Castro S., de Carvalho R. R., Odewahn S. C., 2001, ASP Conf. Ser., 225, 52
- Eisenstein et al. (2011) Eisenstein D. J., et al., 2011, AJ142, 72
- Filho et al. (2004) Filho M. E., Fraternali F., Markoff S., Nagar N. M., Barthel P. D., Ho L. C., Yuan F., 2004, A&A, 418, 429
- Gabányi et al. (2016) Gabányi K. É., An T., Frey S., Komossa S., Paragi Z., Hong X.-Y., Shen Z.-Q., 2016, ApJ, 826, 106
- Garn & Alexander (2009) Garn T., Alexander P., 2009, MNRAS, 394, 105
- Godfrey et al. (2012) Godfrey L. E. H., et al., 2012, Publ. Astron. Soc. Australia, 29, 42
- Goldschmidt et al. (1999) Goldschmidt P., Kukula M. J., Miller L., Dunlop J. S., 1999, ApJ, 511, 612
- Greisen (2003) Greisen E. W., 2003, in Heck A., ed., Astrophysics and Space Science Library, Vol. 285, Information Handling in Astronomy – Historical Vistas. Kluwer, Dordrecht, p. 109
- Gürkan et al. (2019) Gürkan G., et al., 2019, A&A, 622, A11
- Helfand, White & Becker (2015) Helfand D. J., White R. L., Becker R. H., 2015, ApJ, 801, 26
- Hodge et al. (2008) Hodge J. A., Becker R. H., White R. L., de Vries W. H., 2008, AJ136, 1097
- Hooper et al. (1996) Hooper E. J., Impey C. D., Foltz C. B., Hewett P. C., 1996, ApJ, 473, 746
- Hopkins et al. (2003) Hopkins A. M., et al., 2003, ApJ, 599, 971
- Howell et al. (2010) Howell J. H., et al., 2010, ApJ, 715, 572
- Hwang et al. (2018) Hwang H.-C., Zakamska N. L., Alexandroff R. M., Hamann F., Greene J. E., Perrotta S., Richards G. T., 2018, MNRAS, 477, 830
- Hyvönen et al. (2007) Hyvönen T., Kotilainen J. K., Örndahl E., Falomo R., Uslenghi M., 2007, A&A, 462, 525
- Ibar et al. (2008) Ibar E., et al., 2008, MNRAS, 386, 953
- Jahnke, Kuhlbrodt & Wisotzki (2004) Jahnke K., Kuhlbrodt B., Wisotzki L., 2004, MNRAS, 352, 399
- Jiang et al. (2010) Jiang Y.-F., Ciotti L., Ostriker J. P., Spitkovsky A., 2010, ApJ, 711, 125
- Karim et al. (2011) Karim A., et al., 2011, ApJ, 730, 61
- Kellermann et al. (1989) Kellermann K. I., Sramek R., Schmidt M., Shaffer D. B., Green R., 1989, AJ98, 1195
- Kellermann et al. (2016) Kellermann K. I., Condon J. J., Kimball A. E., Perley R. A., Ivezić Ž., 2016, ApJ, 831, 168
- Kewley et al. (2000) Kewley L. J., Heisler C. A., Dopita M. A., Sutherland R., Norris R. P., Reynolds J., Lumsden S., 2000, ApJ, 530, 704
- Laor & Behar (2008) Laor A., Behar E., 2008, MNRAS, 390, 847
- Laor, Baldi & Behar (2019) Laor A., Baldi R. D., Behar E., 2019, MNRAS, 482, 5513
- Lofthouse et al. (2018) Lofthouse E. K., Kaviraj S., Smith D. J. B., Hardcastle M. J., 2018, MNRAS, 479, 807
- Mahabal et al. (2005) Mahabal A., Stern D., Bogosavljević M., Djorgovski S. G., Thompson D., 2005, ApJ, 634, L9
- Mahajan et al. (2019) Mahajan S., Ashby M. L. N., Willner S. P., Barmby P., Fazio G. G., Maragkoudakis A., Raychaudhury S., Zezas A., 2019, MNRAS, 482, 560
- Mahony et al. (2012) Mahony E. K., Sadler E. M., Croom S. M., Ekers R. D., Feain I. J., Murphy T., 2012, ApJ, 754, 12
- Mao et al. (2017) Mao P., Urry C. M., Marchesini E., Landoni M., Massaro F., Ajello M., 2017, ApJ, 842, 87
- Martínez-Paredes et al. (2019) Martínez-Paredes M., Aretxaga I., González-Martín O., Alonso-Herrero A., Levenson N. A., Ramos Almeida C., López-Rodríguez E., 2019, ApJ, 871, 190
- Matsuoka et al. (2016) Matsuoka Y., et al., 2016, ApJ, 828, 26
- Middelberg et al. (2011) Middelberg E., et al., 2011, A&A, 526, A74
- Miller et al. (2008) Miller N. A., et al., 2008, ApJS, 179, 114
- Miller et al. (2013) Miller N. A., et al., 2013, ApJS, 205, 13
- Murphy & VLASS Survey Science Group (2015) Murphy E., VLASS Survey Science Group, 2015, The Many Facets of Extragalactic Radio Surveys: Towards New Scientific Challenges, Proceedings of Science, PoS(EXTRA-RADSUR2015)006
- Pâris et al. (2012) Pâris I., et al., 2012, A&A, 548, A66
- Pâris et al. (2014) Pâris I., et al., 2014, A&A, 563, A54
- Pâris et al. (2017) Pâris I., et al., 2017, A&A, 597, A79
- Paragi et al. (2015) Paragi Z., et al., 2015, in Advancing Astrophysics with the Square Kilometre Array, Proceedings of Science, PoS(AASKA14)143
- Penney et al. (2019) Penney J. I., et al., 2019, MNRAS, 483, 514
- Perger et al. (2017) Perger K., Frey S., Gabányi K. É., Tóth L. V., 2017, Front. Astron. Space Sci., 4, 9
- Pierce, Ballantyne & Ivison (2011) Pierce C. M., Ballantyne D. R., Ivison R. J., 2011, ApJ, 742, 45
- Pracy et al. (2016) Pracy M. B., et al., 2016, MNRAS, 460, 2
- Rees et al. (2016) Rees G. A., et al., 2016, MNRAS, 455, 2731
- Reines & Deller (2012) Reines A. E., Deller A. T., 2012, ApJ, 750, L24
- Rosario et al. (2013) Rosario D. J., Burtscher L., Davies R., Genzel R., Lutz D., Tacconi L. J., 2013, ApJ, 778, 94
- Roy et al. (2018) Roy N., et al., 2018, ApJ, 869, 117
- Sadler et al. (2008) Sadler E. M., Johnston H. M., Cannon R. D., Mauch T., 2008, ASP Conf. Ser., 399, 413
- Schmitt et al. (2006) Schmitt H. R., Calzetti D., Armus L., Giavalisco M., Heckman T. M., Kennicutt R. C., Jr., Leitherer C., Meurer G. R., 2006, ApJ, 643, 173
- Shao et al. (2019) Shao Y., et al., 2019, ApJ, 876, 99
- Shi et al. (2007) Shi Y., et al., 2007, ApJ, 669, 841
- Simpson et al. (2013) Simpson C., Westoby P., Arumugam V., Ivison R., Hartley W., Almaini O., 2013, MNRAS, 433, 2647
- Smolčić et al. (2017a) Smolčić V., et al., 2017, A&A, 602, A1
- Smolčić et al. (2017b) Smolčić V., et al., 2017, A&A, 602, A2
- Smolčić et al. (2017c) Smolčić V., et al., 2017, A&A, 602, A6
- Strittmatter et al. (1980) Strittmatter P. A., Hill P., Pauliny-Toth I. I. K., Steppe H., Witzel A., 1980, A&A, 88, L12
- Ulvestad & Ho (2002) Ulvestad J. S., Ho L. C., 2002, ApJ, 581, 925
- Venemans et al. (2016) Venemans B. P., Walter F., Zschaechner L., Decarli R., De Rosa G., Findlay J. R., McMahon R. G., Sutherland W. J., 2016, ApJ, 816, 37
- Venemans et al. (2017) Venemans B. P., et al., 2017, ApJ, 837, 146
- Venemans et al. (2019) Venemans B., Neeleman M., Walter F., Novak M., Decarli R., Hennawi J., Rix H.-W., 2019, ApJ, 874, L30
- Wals et al. (2005) Wals M., Boyle B. J., Croom S. M., Miller L., Smith R., Shanks T., Outram P., 2005, MNRAS, 360, 453
- Walter et al. (2004) Walter F., Carilli C., Bertoldi F., Menten K., Cox P., Lo K. Y., Fan X., Strauss M. A., 2004, ApJ, 615, L17
- Wang et al. (2013) Wang R., et al., 2013, ApJ, 773, 44
- Wang et al. (2016) Wang R., et al., 2016, ApJ, 830, 53
- Wang et al. (2017) Wang R., et al., 2017, ApJ, 835, L20
- Warren et al. (1987) Warren S. J., Hewett P. C., Irwin M. J., McMahon R. G., Bridgeland M. T., 1987, Nature, 325, 131
- Wells, Greisen & Harten (1981) Wells D. C., Greisen E. W., Harten R. H., 1981, A&AS, 44, 363
- White et al. (2007) White R. L., Helfand D. J., Becker R. H., Glikman E., de Vries W., 2007, ApJ, 654, 99
- Willott, Bergeron & Omont (2015) Willott C. J., Bergeron J., Omont A., 2015, ApJ, 801, 123
- Willott, Omont & Bergeron (2013) Willott C. J., Omont A., Bergeron J., 2013, ApJ, 770, 13
- Willott et al. (1998) Willott C. J., Rawlings S., Blundell K. M., Lacy M., 1998, MNRAS, 300, 625
- Wright et al. (2010) Wright E. L., et al., 2010, AJ140, 1868
- Wu et al. (2005) Wu H., Cao C., Hao C.-N., Liu F.-S., Wang J.-L., Xia X.-Y., Deng Z.-G., Young C. K.-S., 2005, ApJ, 632, L79
- York et al. (2000) York D. G., et al., 2000,AJ120, 1579
- Yun, Reddy & Condon (2001) Yun M. S., Reddy N. A., Condon J. J., 2001, ApJ, 554, 803
- Zakamska & Greene (2014) Zakamska N. L., Greene J. E., 2014, MNRAS, 442, 784
- Zakamska et al. (2016) Zakamska N. L., et al., 2016, MNRAS, 455, 4191
- Zamfir, Sulentic & Marziani (2008) Zamfir S., Sulentic J. W., Marziani P., 2008, MNRAS, 387, 856
- Zensus (1997) Zensus J. A., 1997, ARA&A, 35, 607