Highlights from the Pierre Auger Observatory
Abstract:
The Pierre Auger Observatory has collected data for more than 15 years, accumulating the world’s largest exposure to ultrahigh energy cosmic rays (UHECRs). The energy spectrum of the UHECRs has been measured up to eV, and their mass composition has been studied exploiting both the fluorescence and surface detectors of the Observatory. The analysis of the UHECRs arrival directions allowed us to measure their large-scale anisotropies over more than three decades in energy. The searches for intermediate-scale anisotropies are being performed with an exposure now reaching approximately . For the first time, the fluctuations in the number of muons in inclined air showers above eV have been obtained, while more information in the energy range comes from the direct measure of muons with the underground scintillators of the Observatory. Moreover, we discuss the limits obtained on the fluxes of neutral particles and the results of the searches for UHE neutrinos from transient astrophysical sources. The new perspectives opened by the current results call for an upgrade of the Observatory, whose main aim is the collection of new information about the primary mass of the highest energy cosmic rays to understand the origin of the observed flux suppression. The progress of the upgrade of the Observatory, AugerPrime, is presented and discussed.
1 Introduction
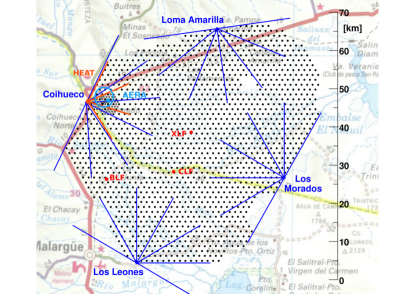
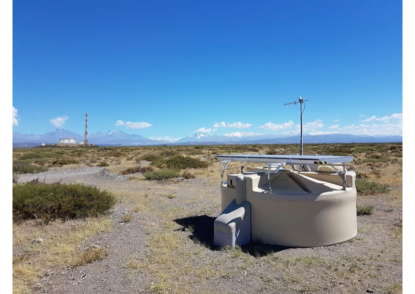
The Pierre Auger Observatory was built more than 15 years ago thanks to the contribution of more than 400 scientists from 17 different countries and to the essential help of a team of on-site physicists and technicians, with the primary scientific aim of studying cosmic rays in the ultrahigh energy range above eV, to understand their nature and to find their sources. Its layout is shown in the left panel of Fig.1. The surface detector (SD1500) is formed by 1600 water Cherenkov stations (WCD) deployed in a 1.5 km grid over a total area of about 3000 km2, and is used to measure the density and the arrival time distribution of the shower particles at the ground. This area is overlooked by four fluorescence detectors (FD), each consisting of six telescopes with elevation angle from 1∘ to 30∘, for the measurement of the energy deposit of the showers in the atmosphere. A photograph of one of the SD stations is shown in the right panel of Fig.1. In the North-Western part of the experimental site, 61 WCD (SD750) are deployed in a denser array with a detector spacing of 750 m, together with three high-elevation fluorescence telescopes (HEAT), with elevation angle from 30∘ to 60∘. This region is exploited to widen the explorable energy region down to about eV. The Auger Engineering Radio Array (AERA) complements the measurements of low energy showers by detecting their radio emission, using more than 150 radio antennas. Different atmospheric monitoring devices are employed to monitoring the atmosphere. All details about the Observatory can be found in [1].
The rich harvest of the Pierre Auger Collaboration covers different and complementary fields of research. The quest for the origin of UHE cosmic rays relies on the measurement of the energy spectrum and mass composition of the primaries, on multi-messenger studies and on extensive searches for anisotropy at both large and intermediate angular scale; our most updated results are discussed in Sec.2. The properties of multiparticle production are explored thanks to the collection of different observables linked to the muonic and electromagnetic components of the showers; the outcome is presented in Sec.3. Our current efforts in upgrading the Observatory are summarized in Sec.4. Due to the limited number of pages, only selected results are presented here; we refer the reader to [59, 60, 61, 62, 63, 64, 65, 66] for further interesting studies from the Pierre Auger Observatory presented at this conference. All contributions are available within one volume in [67].
2 Astrophysics of UHE cosmic rays
2.1 Energy spectrum
A huge exposure of about 60,000 allows us to measure the cosmic ray energy spectrum,
exploiting more than 215,000 events collected by the SD1500 array with energies above
eV and arriving at zenith angles less than [2].
The reconstruction of these events is described in [3].
The signals from through-going atmospheric muons, collected every minute, are used to convert the
particle densities in each SD station into a signal in units of Vertical Equivalent Muons (VEM), providing a
common reference to all stations.
The accuracy in the evaluation of the arrival direction of the shower depends on the start times of the
individual stations; it is derived by means of Monte Carlo simulations based on the EPOS-LHC model,
and at the highest
energies it results to be better than for all simulated angles and masses.
The energy estimator of the SD is chosen to be the signal evaluated at 1 km from the core, where the
fluctuations in the value of due to uncertainties in the lateral distribution function are minimized.
The uncertainty on decreases from 15% to 5% for shower sizes increasing from 10 to 250 VEM.
By applying the Constant Intensity Cut (CIC) method, is corrected for the attenuation of
showers when propagating through different amounts of atmosphere, normalizing it to the average arrival
direction of ().
We employ a new parametrization of the CIC which takes into account the energy dependence of the shower
attenuation [2], due to changes in composition with increasing energy or, for fixed primary mass,
to the evolution of the electromagnetic fraction with respect to the total signal.
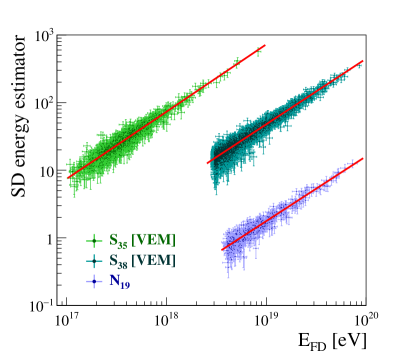
Using the FD technique, we can measure the nearly calorimetric energy deposited in the atmosphere by
the electromagnetic component of the EAS. Exploiting the correlation of the SD energy estimator
with the FD energy in hybrid events, i.e. those detected by both the SD and FD, we obtain the energy
scale of the Observatory and a calibration of all SD events in a model-independent way. This correlation
is shown in the left panel of Fig.2 for the SD1500 vertical sample, together with those measured
with the SD750 and the SD1500 horizontal data sets. For the latter, a completely different reconstruction is
performed, yielding to the energy estimator , the relative muon content with respect to simulated
proton showers at 10 EeV [4].
At this conference, we presented a review of the energy scale of the Observatory, discussing the FD energy
resolution and further checks on the systematic uncertainties [5].
Real-time measurements of the atmospheric conditions are mandatory for the correct evaluation of the
fluorescence light emitted by the showers. The main contribution to their systematic uncertainties comes from
the determination of the aerosol content; in particular, we showed the importance of using hourly aerosols
quantification to avoid a significant worsening of the resolution on both the energy and the determination [6]. The reconstruction of the shower profile has been improved by using a new function,
where the shape parameters are free from correlations, in this way allowing better-behaved fits [7].
The invisible energy, i.e. that carried by particles that do not dissipate all their energy in the atmosphere, is
derived in a fully data-driven approach [8], as such free from the systematic uncertainties affecting
the hadronic interaction models used in the simulations. Its current parametrization is based on the horizontal
events (muon dominated) and adds up to a fraction of 20 to 12% of the total energy ranging from
to eV, with systematic uncertainties of less than 2%.
The FD energy resolution amounts to about 8%, adding the contributions coming from the atmosphere, the
detector and reconstruction and the invisible energy. We confirm the overall systematic uncertainty of 14%
on the energy scale [9].
The vertical energy spectrum is shown in the right panel of Fig.2 together with those from the other independent and complementary data sets.

At this conference, we presented for the first time the energy spectrum of cosmic rays down to 100 PeV using the SD750 data [10], obtained by exploiting a set of additional triggers allowing us to lower the threshold of full efficiency to eV, thus approaching the region of the so-called ”2nd knee”. Also in this case, the measurement is performed using a fully data-driven approach. The spectrum below the ankle cannot be correctly described by a single power law, which is excluded at the level of . This conclusion is confirmed by the measurement of the showers approaching HEAT along the telescope axes, which, being dominated by the air-Cherenkov light emission, have a lower detection threshold [11]. In this analysis, the energy spectrum is derived between and eV with systematic uncertainties dominated by those in the FD energy scale and in the exposure evaluation (14% and 15% respectively).
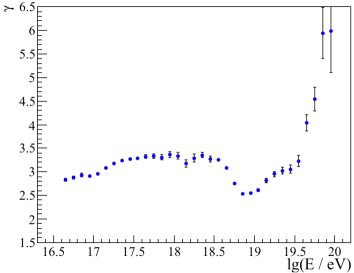
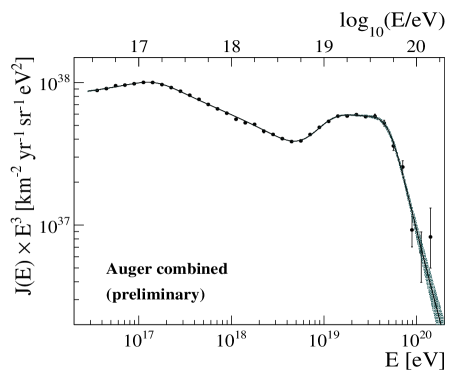
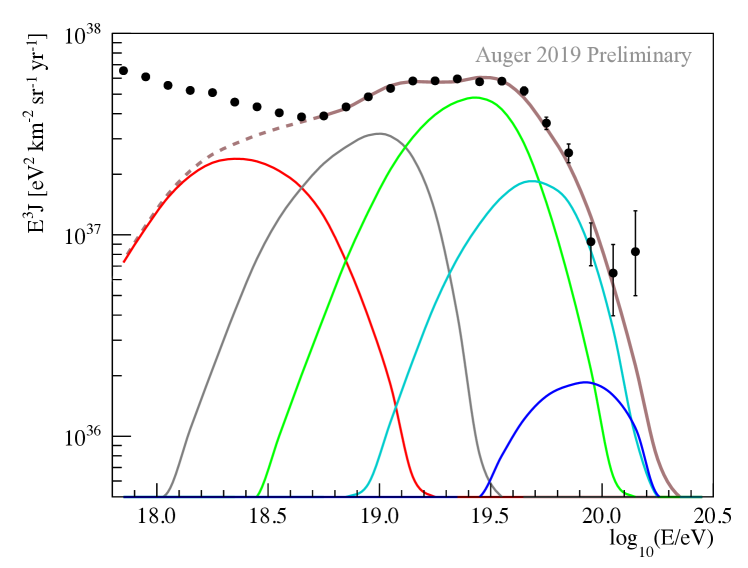
The spectrum obtained by combining the five data sets exploiting the total exposure of 80,000 is shown in the right panel of Fig.3. A functional form made by a sequence of different power laws is used to fit it, as suggested by a study of the evolution of the spectral slope assuming a spectrum and fitting it in sliding windows of three energy bins, as shown in the left panel of Fig.3. As indicated in the plot, the spectrum is characterized by two clear inflection points corresponding to the second knee around eV and to the ankle near eV. A new feature is visible around eV, where the spectral slope changes from to . We confirm the suppression of the flux above eV. The energy at which the integral spectrum drops by a factor of two below what would be the expected with no steepening is EeV, at variance with that expected for uniformly distributed sources of protons, as also indicated by the results from our composition measurements.
2.2 Primary composition
The measurements of the depth of maximum development of the shower in the atmosphere and of its fluctuations
together with that of the primary energy provide us with the most reliable information on the UHECRs composition.
Indeed, is directly proportional to the logarithmic mass of the primary particle, while its variance
is a convolution of the intrinsic shower-to-shower fluctuations and of the dispersion of masses in the primary beam.
At this conference, we presented an update to this measurement based on more than 47,000 hybrid events,
more than 1000 of which above 10 EeV [12]. Above eV, this corresponds to an increase of
20% in statistics, while the lowest energy range is covered by the events collected by the HEAT telescopes as
presented in [13].
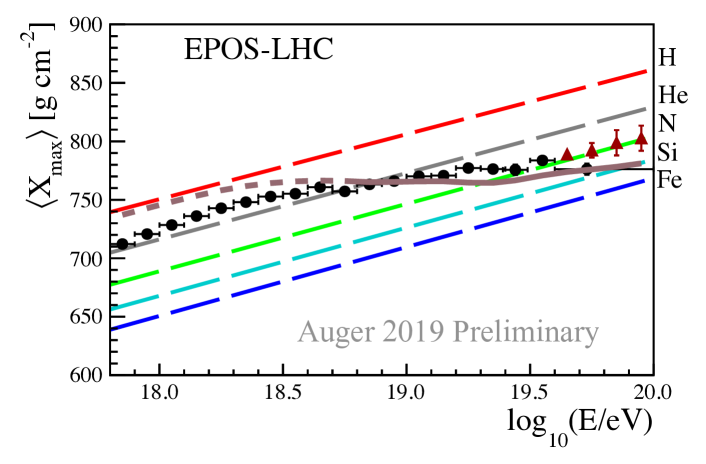
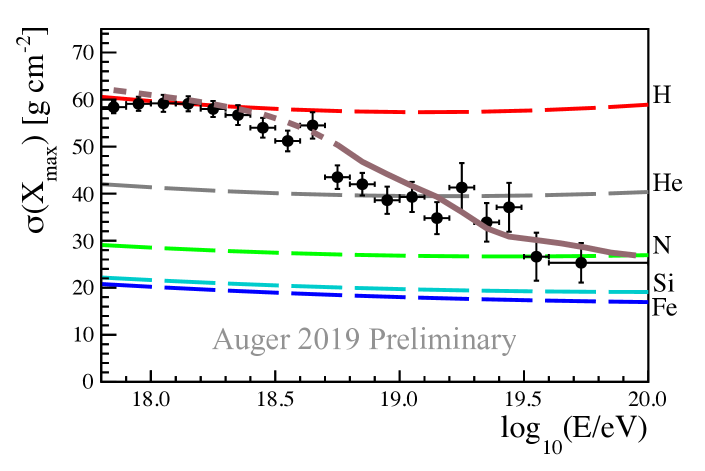
The evolution of and its standard deviation with energy is shown in Fig.4.
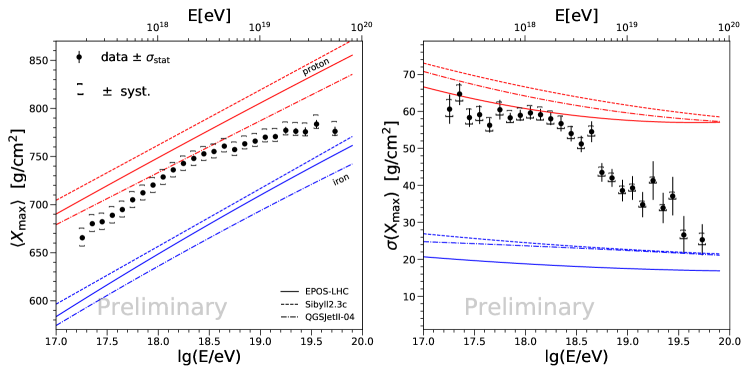
We measure an elongation rate for of below
eV and above this energy.
The result is in agreement with our previous findings [13, 14] and points to a composition
getting lighter up to and going towards intermediate-heavy masses above it, at variance with the model
expectations for constant compositions, which suggest an elongation rate of g cm-2/decade in
the whole energy range.
The evolution of at the highest energies suggests a quite pure and heavy composition, while
in the lower energy range it is compatible with both a light or mixed one.
Converting the two moments of the distributions to those of the logarithmic primary mass as in [15], we concluded that the mass is lightest at , with 0.8 and 1.4 for
EPOS-LHC and Sibyll2.3c respectively. The QGSJetII-04 model produces negative, unphysical, values
of (), and as such it is unable to describe our data correctly.
Besides measuring the particle densities at different distances from the core, the SD allows us to obtain
the distribution of the arrival times of particles at each station. The dependence of the rise-time (i.e.
the time needed for the signal to go from 10 to 50% of its total value) on the distance of the shower maximum
to the ground and on the electromagnetic to muonic components of the EAS was used in [16] to
obtain information about the primary mass composition from SD, thus exploiting its 100% duty cycle.
At this conference, we presented an update of that analysis [17] based on three more years of
data collection and an extended angular range of accepted events to , obtaining
a data sample 30 times larger than that available from the FD above 3 EeV.
Exploiting the correlation of the SD observable towards , we could derive the
evolution with energy up to eV,
although with large systematic uncertainties. The results confirm the conclusion obtained in the analysis
of the FD data.
Hadronic showers generated by heavy primary particles develop higher in the atmosphere and contain more muons with respect to those produced by lighter primaries. A study was published in [18] to derive information about the mass spread in the ankle region by exploiting the correlation between and the signal in WCDs at 1000 meters from the core, (which becomes more dominated by muons as the zenith angle increases). Being based on hybrid events, this analysis is less prone to systematic uncertainties and is not affected by our ignorance of the hadronic interactions employed in the models. We presented at this conference an update of the analysis [12], based on a statistics about two times larger with respect to the published results, considering the energy range . To avoid a decorrelation due to the spreads of energies and zenith angles, we rescaled and to a reference energy of 10 EeV and a zenith angle of . The correlation between the two observables is expected to be positive for constant compositions in all models, while the experimental finding results in , with a systematic uncertainty . The dependence of the correlation coefficients on (lnA) is shown in Fig.5, where the experimental result is indicated by the shaded grey area.
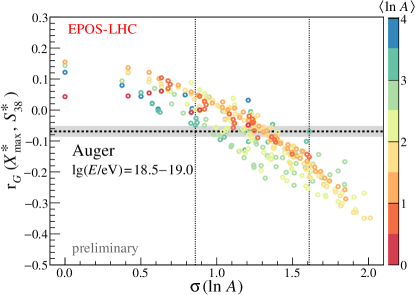
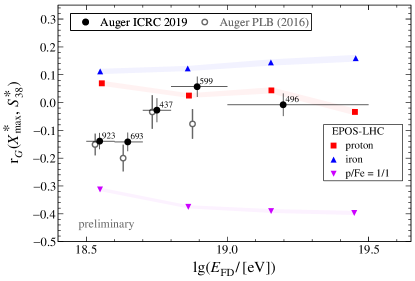
The points correspond to the correlation expected in EPOS-LHC for different mixtures of (p, He, O, Fe) nuclei, their colour to the corresponding value of . The simulations are compatible with data in the region encompassed by the two vertical dashed lines. Similar results are obtained if different models are employed; in all cases, the correlation hints to a spread of masses in the range . As shown in the right panel of Fig.5, the correlation at energies , below the ankle, is significantly different from zero (6.4), while smaller mixings are allowed above this range. In the considered energy range , pure compositions and compositions consisting of only protons and helium can be excluded at level.
An astrophysical interpretation of the Auger data on the energy spectrum and mass composition can be obtained starting from different assumptions on the possible sources. By assuming the same model of [19], in which the sources of UHECRs are of extragalactic origin and accelerate nuclei in electromagnetic processes with a rigidity-dependent maximum energy, , a preliminary comparison of the energy spectrum and composition expected at the top of the Earth’s atmosphere to the measured ones can be obtained in a combined fit procedure. As shown in Fig.6, even using this simple model we reached the statistical power and the knowledge of systematic uncertainties such to be able to reproduce the different features of the spectrum and the average behaviour of the and its standard deviation. The best-fit parameters hint to a quite hard injection spectrum and a low rigidity cut-off for protons, thus implying a non-negligible fraction of heavier elements at the highest energies. Within the systematic uncertainties, the results agree with those previously published [19].
2.3 Multi-messengers
With its high potential in the identification of photons and neutrinos, the Pierre Auger Observatory has a key
role in the field of multi-messenger astrophysics. Cosmogenic neutrinos and photons are produced in the
interactions of UHECRs in the background radiation fields during their propagation from their sources
to Earth.
Neither are deflected in the Galactic or intergalactic magnetic fields; they point back to their sources,
making them ideal messengers in targeted searches. While photons cover travel distances of the order of
Mpc at 1 EeV, neutrinos allow us to probe sources up to cosmological distances.
Their fluxes depend on the properties of the sources and on the composition of the primary beam. A
copious production of and can be expected, e.g., if the suppression of the UHECR flux above
a few tens of EeV is due to propagation effects and if the proton component is dominant. On the contrary,
an explanation of the cutoff as due to the exhaustion of the sources would lead to much lower fluxes of
neutral particles and would point to a mixed composition.
The selection of photons in Auger is based on the fact that photon-induced showers present a more
elongated profile in the atmosphere, and thus a larger , a steeper lateral distribution, causing the
involvement of a lower number of SD stations in the events, and a reduced production of muons with respect
to hadronic showers [20].
Neutrinos are looked for based on the selection of horizontal showers.
In hadronic-induced showers above , the electromagnetic component is indeed almost
completely absorbed in the atmosphere, and only muons are detected in the SD. On the contrary, in the case
of neutrino events with similar arrival directions, the first interaction would happen lower
in the atmosphere, producing a considerable amount of electrons and photons at the ground. Two main
categories of events are considered: Earth-skimming, induced by travelling from below the
Earth crust in directions between and and producing a lepton which can
then generate a shower above the SD, and downward-going events due to neutrinos of any flavour.
Thanks to the larger grammage and to the density of the Earth with respect to the atmosphere, the first
is the most sensitive channel [21].
The current upper limits on the cosmogenic fluxes of photons and neutrinos are shown in Fig.7.
The energy range covered in the search for diffuse photons is here extended to about three decades, thanks to an exposure now reaching , and to the analysis of data from the low energy enhancements of the Observatory, namely SD750 and HEAT. The limits above EeV energies put strong constraints on top-down models of UHECRs origin [22] and on the most optimistic models of photon production from the interaction of protons with the CMB.
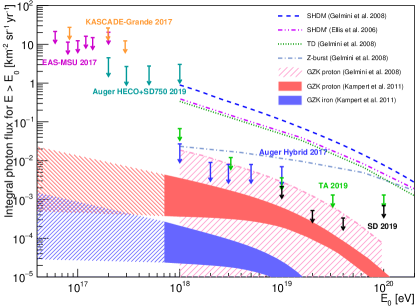
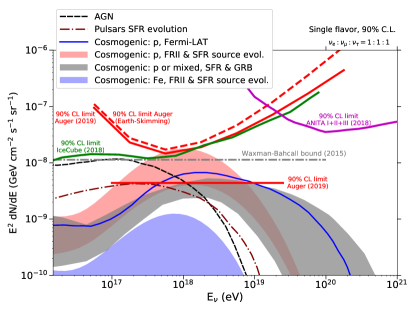
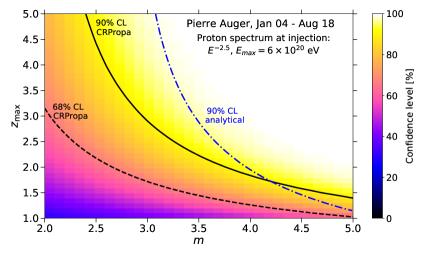
The single flavour 90% upper limit on the integrated neutrino flux, for an assumed flux and no neutrino candidates, is in the energy range eV. The differential upper limit characterizes the energy dependence of the sensitivity of a neutrino experiment: as shown in the right panel of Fig.7, with the Auger Observatory the best sensitivity is achieved for energies around 1 EeV. Describing the evolution of the sources by , up to a maximum redshift , we could perform a scan in the phase space and obtain the expected flux and the number of cosmogenic neutrino events in Auger (using the propagation code CRPropa [23]) for each configuration. From the non-observation of neutrinos, we could thus exclude a significant part of the parameter space, as shown in the left panel of Fig.8.
Besides diffuse neutrino fluxes, exploiting the very good angular resolution of the Observatory (less than for ) we can look for steady sources of UHE neutrinos. Upper bounds on the normalization of a differential neutrino flux as a function
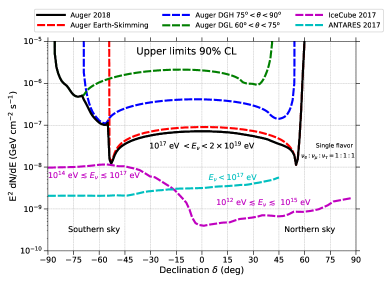
of declination are shown in the right panel of Fig.8. The energy range of Auger is different and complementary to those of IceCube and Antares [24, 25].
At this conference, we also presented the results of our studies on transient sources of UHE neutrinos of
the order of an hour or less. The sensitivity of the SD to these kind of sources depends not only on the
declination, as in the case of steady sources, but also on the efficiency of the detection during the time
occurrence of the transit. For sources in transit within the field of view corresponding to the zenith angle
range , where the SD is most sensitive to UHE neutrinos, the sensitivity
is unrivaled with respect to other neutrino detectors.
At the time of the GW170817, detected by LIGO and Virgo [26], the source was located in the most
sensitive part of the Auger field of view, and we provided the strongest constraints on the UHE neutrino
fluence from the merger [27].
Two other types of potential transient sources were scrutinized in [28]. Binary black hole mergers
(BBH), detected by the gravitational wave detectors, could in principle be sources of neutrinos, if
matter debris and strong magnetic fields are present in the source environment [29].
Combining searches for neutrinos from 21 BBH mergers, and considering an emission spectrum
, the non-observation of any candidates in the 24 hours after the mergers brought to an upper
limit on the luminosity of a universal isotropic source of UHE neutrinos of
erg/s, with maximum sensitivity about 14.6 hours after the merger.
UHE neutrino events from the blazar TXS 0506+056, for which a correlated emission of neutrinos and
photons was found [30, 31] below the energy threshold of Auger, were also searched for
in two different time windows correlated to the neutrino excess found with IceCube and to the following
associated high-energy neutrino alert, but no UHE neutrinos have been observed. Despite the smaller
sensitivity to neutrinos from the TXS 0506+056 flares with respect to IceCube, due to the periodic visibility
with interruptions, we underline that we are scrutinizing a different higher energy range, unreachable by
other observatories.
2.4 Arrival directions
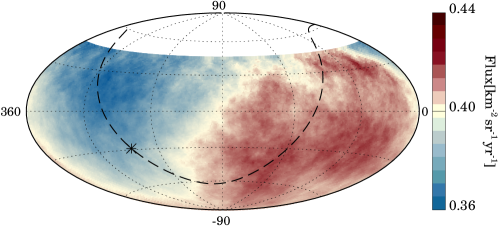
In [32], the Pierre Auger Collaboration announced the observation of a large-scale anisotropy in the arrival directions of cosmic rays above eV. At this conference, this analysis was extended to cover more than three decades in energy, exploiting about 15 years of data [33]. For energies above 4 EeV, data from the fully efficient SD1500 array were used, reaching a total exposure of and for events with and respectively.
Under the assumption that higher multipoles are negligible, we found a total dipolar amplitude for EeV of , pointing away from the direction of the Galactic center, as such indicating an extragalactic origin of the modulation. The overall flux in this energy bin is shown in the left panel of Fig.9.
The possible presence of quadrupolar components has been considered, but their amplitudes
result to be negligible, and even in this case the dipole is consistent with that found by neglecting
higher-order multipoles.
The same study, free from assumptions on the shape of the underlying angular distribution, has been
performed considering a full-sky search for large-scale anisotropies, in a joint working group of the Pierre
Auger and Telescope Array collaborations [34]. By a careful reweighting of the exposures and
cross-calibrating the respective energy scales, the data from the two experiments could be analyzed together.
The dipolar amplitude found is again consistent with that obtained by Auger alone,
with smaller uncertainties when allowing for non-vanishing quadrupole moments.
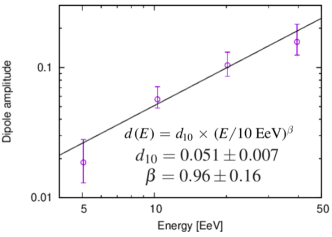
Thanks to the large exposure, with the Auger Observatory we studied the evolution of the dipolar amplitude with energy, which is shown in the right panel of Fig.9. The linear growth can be reproduced with , where and ; an evolution of the amplitude constant with energy is disfavoured at the level of by a likelihood ratio test. A study of the effect on the extragalactic dipole of the deflections caused by the Galactic magnetic field showed that in this case, depending on the particle rigidities, the dipole direction would tend to align in the direction of the spiral arms and suffer a reduction of the amplitude [35].
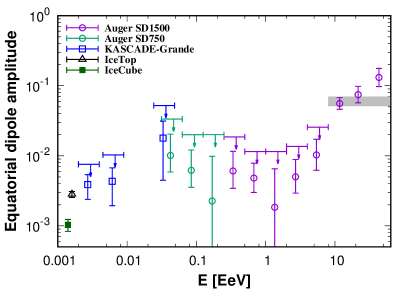
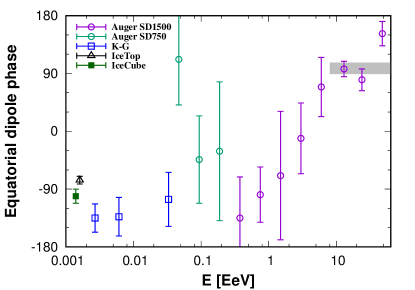
Further studies have been conducted to extend the search for large-scale anisotropies to a lower energy range, exploiting the data from the infill array SD750 and using the East-West method [36], less sensitive to systematic effects that could result in spurious anisotropies, in place of the standard Rayleigh analysis. The amplitudes and phases of the equatorial dipole in the extended energy range are shown in Fig.10. There, we also indicate with the 99% CL upper bounds the result in the bins where the measured amplitude is smaller than the value within which 99% of the simulations with isotropic distributions of the same number of events would fall. Although the amplitudes at low energy are not significant, the phase of the equatorial dipole appears to change from values pointing close to the right ascension of the Galactic center below EeV energies towards the opposite direction, again indicating an extragalactic origin for the dipolar anisotropy above a few EeV.
At higher energies, where the rigidities of the particles are high enough and cosmic rays from far sources are suppressed due to the energy losses they suffered during propagation, searches for intermediate-scale anisotropies have been performed by exploiting 15 years of data, reaching an unprecedented exposure of in a declination range between and [37].
A model-independent blind search for overdensities was performed over the whole field of view, in a wide energy threshold range EeV using a 1 EeV step and scanning circular regions from to in steps of . The most significant excess was found for EeV in an angular window of centered in the direction , a region densely populated by extragalactic objects among which there is the closest radio-Galaxy Centaurus A. Indeed, the excess of events in its direction, already pointed out in the past [38], reached a one-sided post-trial significance of for energies above EeV and .
The arrival directions of UHECRs were also studied against the distribution of nearby extragalactic
matter traced by different catalogs of possible sources up to a distance of Mpc.
Similarly to [39], we considered (a) a sample of 32 starburst Galaxies (SBGs)
selected based on their continuum emission at 1.4 GHz, used as a proxy for their UHECR flux;
(b) a selection of AGNs from the 3FHL catalog, weighting the sources with the integral flux
from 10 GeV to 1 TeV; (c) the 2MRS catalog of nearby matter farther than 1 Mpc; (d) a selection of
Swift-BAT radio-loud and radio-quiet AGNs.
In this analysis, we exploited not only the source directions but also the possible ansatzes for the
relative UHECR fluxes from source candidates provided by the observations from Fermi-LAT.
Furthermore, our current knowledge of the cosmic ray composition could be used to evaluate the
attenuation in intensity due to the energy losses during propagation.
A likelihood ratio analysis allowed us to evaluate the smearing angle and the fraction of anisotropic
cosmic rays for each case.
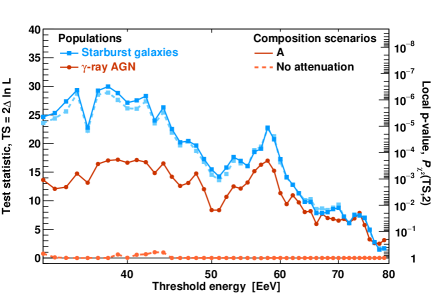
The test statistics obtained for the correlation with SBGs and AGNs is shown in the left panel
of Fig.11.
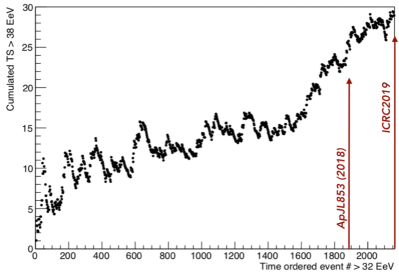
The highest significance is obtained for the case of SBGs, where we found an anisotropic fraction
of of events with energy above 38 EeV in a smearing angle of . Note that
the attenuation of particles in the case of the nearby SBGs is much less important that for more distant blazars.
After penalization for the scanning in energy, the significance of the correlation results to be .
The cumulated test statistics for EeV is shown in the right panel
of Fig.11 as a function of the number of collected events.
3 Hadronic interactions
The interpretation of the experimental observables in terms of primary composition is prone to systematic
uncertainties, mainly due to the lack of knowledge on hadronic interactions at ultra-high energies.
On the one hand, additional data from collider and fixed-target experiments are needed to lower these
uncertainties. On the other hand, the interactions of primary cosmic rays in the atmosphere can be
exploited to study the hadronic interaction models in a kinematic and energy region not accessible
by human-made accelerators. Indeed, exploiting Auger data, we reach center-of-mass energies up
to TeV, more than 30 times those attainable at LHC and explore interactions in
the very forward region of phase space on targets of .
The shower development depends on many different features of the hadronic interactions.
In particular, by collecting the electromagnetic radiation emitted by the shower particles crossing the
atmosphere and its depth of maximum development , we get information about the first interaction
cross section [40]. The measure of the muonic component at the ground is more sensitive to the
details of the hadronic interactions along many steps of the cascade, like the
multiplicity of the secondaries and the fraction of electromagnetic component with respect to the total signal.
On the contrary, the intrinsic muon fluctuations mostly depend on the first interaction [41].
Clear evidence for a deficit of the number of muons predicted by the models was reported by our
Collaboration by exploiting inclined showers, where the electromagnetic component has been fully
absorbed by the atmosphere [42] and in the hadronic component [43].
The study of the muon production depth [44] and of the time profiles of the signals recorded with
SD [16] further proved the inability of models to describe all the components of the showers correctly.
At this conference, we showed that the deficit of muons in the models is well visible also at lower energies,
by directly measuring the muon content of EAS with an engineering array of underground muon detectors
(UMD) deployed in the infill area [45].
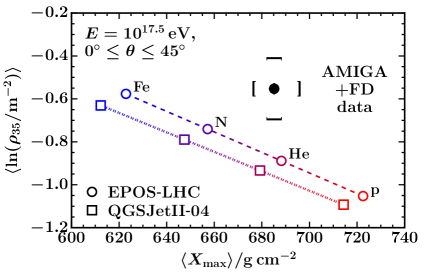
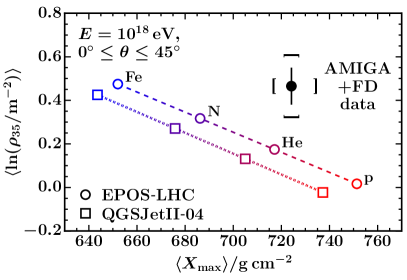
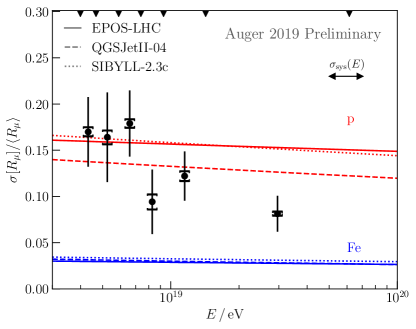
In Fig.12, the correlation of the muon densities measured by the UMD with the measured by the FD is shown at two different energies ( and eV).
The mean logarithmic muon densities are linearly dependent on the mean logarithmic primary mass, so
that they can be related to the in proton and iron simulations.
The resulting predicted muon content is 38% too low at both energies when EPOS-LHC is used, the mismatch
increasing to 50% to 53% at the two energies in the case of QGSJetII-04.
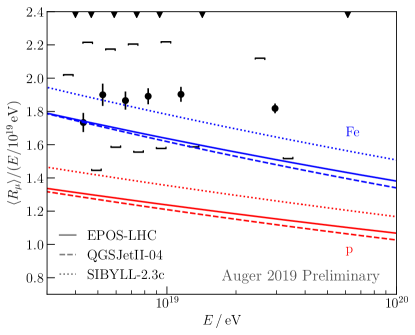
Moreover, we presented for the first time the measurement of the shower-to-shower fluctuations of the muonic component, at the same time updating the results on the mean muon number exploiting hybrid inclined showers [46]. They are shown in Fig.13; note that systematic errors (square brackets) are dominant for , while for the muon fluctuations the uncertainties are mainly statistical (error bars). The expectations for the relative fluctuations are compatible with the experimental results, while models and data show a significant discrepancy in the average muon scale. The results thus suggest that models are describing reasonably well the distribution of energy going into the electromagnetic component after the first interaction, while the discrepancy in the overall muon number should be explained by resorting to changes of different hadronic interaction characteristics along all the shower stages.
Non-standard mechanisms, like departures from relativity such as Lorentz invariance violation (LIV), can result in a perturbative modification of the particle dispersion relation , (where =type of particle, =approximation order). The UHECRs collected at the Pierre Auger Observatory, coming from extragalactic sources, represent the ideal candidates to search for these effects, as these are expected to be suppressed at low energies and for short travel distances. At this conference, we presented searches for Lorentz invariance violation effects in three different sectors [47], by modifying the propagation of hadrons or photons or by considering the changes which would appear in the evolution of the showers in the atmosphere, and comparing the predictions on the energy spectrum and composition with those measured, in a combined fit procedure. In the first case, our data is better described with a low maximum rigidity at sources, which leads to a poor sensitivity to LIV effects. In the photon sector, the limits of eV-1 and eV-1 obtained in our analysis are two and four orders of magnitude more restrictive than those in [48] for =1 and =2 respectively.
4 Conclusion and future steps
The rich harvest of results from the Pierre Auger Observatory presented at this conference is based on an unprecedented exposure and on a more and more careful understanding of our data and their systematic uncertainties. The large-scale dipolar modulation above 8 EeV is confirmed, and its amplitude is found growing with energy. The extension of the measurement of the amplitude and phase of the modulation to more than three orders of magnitude allowed us to confirm a Galactic origin for cosmic rays below the EeV, while the direction of the dipole strongly support the conclusion that they are extragalactic above few EeV. Blind searches for intermediate and small-scale anisotropies confirmed the existence of an excess in the direction of Centaurus A. A growing significance (now above 4.5) was found for the correlation among the directions of cosmic rays with EeV and the position of starburst galaxies in a catalog including objects like NGC4945 and M83 in the CenA region, but also NGC253 near the Southern Galactic pole. More studies including the effects of magnetic fields and larger catalogs are required in the future to confirm these findings.
The measurement of the energy spectrum of cosmic rays covers a wide range of energies, from to above eV, and it is derived without assumptions on models or composition. Two inflection points are clearly visible corresponding to the second knee and to the ankle, a new feature around eV is now appearing thanks to the much reduced statistical errors. The region around the ankle appears to be dominated by a mixed composition, with a pure or too light one excluded with a significance of by our measurements based on hybrid events. The best information on the primary mass relies on the evaluation of the distributions and their moments, hinting to a composition which gets heavier above eV, a conclusion confirmed by new measurements exploiting the 100% duty cycle of the SD. These results point to an origin for the confirmed steepening of the flux above eV more related to the exhaustion of the sources rather than to propagation effects. Information about the mass composition in the suppression region is however still missing.
New results on hadronic interaction models at ultrahigh energy come from the study of muons: a good description of the energy sharing after the first interaction is confirmed by the first-ever measurement of the evolution of the muon intrinsic fluctuations in extensive air showers. The deficit in the expected total number of muons is now confirmed also at energies down to eV thanks to the measurements performed with the UMD, and most probably due to effects related to the subsequent steps of the cascades in the atmosphere.
The AugerPrime upgrade of the Pierre Auger Observatory [49] is being built to address the open questions raised by the current results. The interpretation of the suppression in the flux by differentiating between a cut-off due to propagation effects and the maximum energy reached in the sources can provide fundamental constraints on the sources of the ultrahigh energy cosmic rays and their properties. To set the stage for future experiments and assess the feasibility of charged particle astronomy, it is mandatory to evaluate the possible existence of a fraction of protons at the highest energies. New information about hadronic interactions in a range of energy and in a kinematic region which is not accessible in human-made accelerators will allow us to break the degeneracy between primary mass and hadronic interactions and furthermore to search for non-standard mechanisms. These questions must be addressed not only by reaching larger exposures but more importantly by providing new information on the primary mass composition at ultra-high energies on an event-by-event basis.
Each station of the SD will be equipped by a 3.8 m2 slab of plastic scintillator on top (the Surface Scintillator Detector, SSD [50]), new SD electronics and an additional small photomultiplier inside the WCD for the extension of the dynamic range [51, 52]. Besides the scintillator, a radio antenna (RD) will be mounted above the station for the detection of the radio signals from the extensive air showers in the frequency range from 30 to 80 MHz[53]. Additionally, the UMD are going to be deployed beside each WCD in the infill region of the Observatory, to provide direct muon measurements [54].
The most direct technique to evaluate the muon component exploits the different responses of the
WCD and SSD at station level, relating their total signals to the electromagnetic and muonic fluxes at
the ground. Indeed, the ratio of the electromagnetic to muonic components of the showers is more than
a factor of two higher in a thin scintillator with respect to the WCD over a very wide range of distances to
the core.
This information can be obtained employing a matrix inversion method [55], although in this
case the measured muon signals are subject to large fluctuations, being restricted to individual stations.
A more general approach based on the properties of universality of air showers [56] or multivariate
analyses would allow us to take advantage of all the information provided by AugerPrime, not only by correlating
the detector signals at different distances to the core but also considering their temporal structure (arrival times
of the particles at the stations).
In this case, an event-by-event reconstruction will provide the energy, the depth of maximum shower
development in the atmosphere and the number of muons.
Moreover, the implementation of the radio detector will allow us to collect a new different kind of hybrid
events: the combination of the WCD and RD will be used to exploit the correlation of the electromagnetic
energy (from radio) and the number of muons (from the WCD) for horizontal air showers. Indeed, the size of
the radio footprint exceeds tens of km2 for very inclined showers () [57],
with dozens of stations involved.
Since 2016, 12 fully upgraded stations (the Engineering Array) are running in the field with new electronics, higher sampling, larger dynamic range. Furthermore, more than 350 upgraded stations (WCD+SSD) have already been deployed at the time of this conference. By exploiting the Engineering Array and a pre-production array of 80 upgraded stations running in the field with the old electronics, we could check the performances and calibration of the new detectors [58]. The signals in the WCD are measured up to saturation ( VEM) by the large PMTs. In the superposition region and above the large PMT saturation, they are derived exploiting the small PMT. The measured correlation among the signals of the WCD and SSD demonstrated the validity of the independent calibration procedures and showed that the required dynamic range in the upgraded SD is nicely covered up to the highest particle densities ( VEM). The differences of response of the two detectors were studied and confirmed by evaluating the dependency of the signal ratio with zenith, energy and distance to the core.
The prototypes of the RD are now installed in the field for in-situ evaluation of their performances, the starting of the mass production is foreseen for the end of 2019.
The production and deployment of the AugerPrime detectors and electronics will be completed by 2020, for a data-taking planned up to 2025 and beyond.
References
- [1] The Pierre Auger Coll., Nucl. Instrum. Meth. A 798 (2015) 172.
- [2] V.Verzi [Pierre Auger Coll.], PoS(ICRC2019) 450.
- [3] D. Mockler [Pierre Auger Coll.], PoS(ICRC2019) 353.
- [4] The Pierre Auger Coll., JCAP 08 (2014) 019.
- [5] B. Dawson [Pierre Auger Coll.], PoS(ICRC2019) 231.
- [6] V.M. Harvey [Pierre Auger Coll.], PoS(ICRC2019) 283.
- [7] The Pierre Auger Coll., JCAP 03 (2019) 18.
- [8] The Pierre Auger Coll., Phys. Rev. D (in press) (2019) [arXiv:1901.08040].
- [9] V. Verzi [Pierre Auger Coll.], Proc. 33th ICRC (2013) [arXiv:1307.5059].
- [10] A.Coleman [Pierre Auger Coll.], PoS(ICRC2019) 225.
- [11] V.Novotny [Pierre Auger Coll.], PoS(ICRC2019) 374.
- [12] A.Yushkov [Pierre Auger Coll.], PoS(ICRC2019) 482.
- [13] J. Bellido [Pierre Auger Coll.], PoS(ICRC2017) 506
- [14] The Pierre Auger Coll., Phys.Rev. D90 (2014), 12, 122005.
- [15] The Pierre Auger Coll., JCAP 1302 (2013) 026.
- [16] The Pierre Auger Coll., Phys. Rev. D 96 (2017) 122003.
- [17] C.J.Todero Peixoto [Pierre Auger Coll.], PoS(ICRC2019) 440.
- [18] The Pierre Auger Coll., Phys. Lett. B762 (2016) 288.
- [19] The Pierre Auger Coll., JCAP04 (2017) 038.
- [20] J.Rautenberg [Pierre Auger Coll.], PoS(ICRC2019) 398.
- [21] F.Pedreira [Pierre Auger Coll.], PoS(ICRC2019) 979.
- [22] The Pierre Auger Coll., JCAP04 (2017) 009.
- [23] R.Alves Batista et al.,JCAP05 (2016) 038.
- [24] The IceCube Coll., Astrophys.J. 835 (2017) 151.
- [25] The ANTARES Coll., Phys.Rev. D96 (2017) 082001.
- [26] B.P.Abbot et al., Astrophys.J.Lett. 848 (2017) L12.
- [27] A.Albert et al., Astrophys.J.Lett. 850 (2017) L35.
- [28] M.Schimp [Pierre Auger Coll.], PoS(ICRC2019) 415.
- [29] K.Kotera K, J. Silk, Astrophys. J. 823 (2016) L29.
- [30] The IceCube Coll.,Science 361(2018) 1378.
- [31] The IceCube Coll.,Science 361(2018)147.
- [32] The Pierre Auger Coll., Science 357 (2017) , 1266.
- [33] E. Roulet [Pierre Auger Coll.], PoS(ICRC2019) 408.
- [34] A. di Matteo [Pierre Auger and Telescope Array Coll.], PoS(ICRC2019) 439.
- [35] The Pierre Auger Coll., Astrophys.J. 868 (2018) 4.
- [36] R.Bonino et al., Astrophys.J. 738 (2011) 67.
- [37] L. Caccianiga [Pierre Auger Coll.], PoS(ICRC2019) 206.
- [38] The Pierre Auger Coll., Astrophys. J. 804 (2015) 15.
- [39] The Pierre Auger Coll., Astrop.J.Lett., 853 (2018) L29.
- [40] The Pierre Auger Coll., Phys.rev.Lett. 109 (2012) 062002.
- [41] L.Cazon et al., Phys. Lett. B 784 (2018) 68.
- [42] The Pierre Auger Coll., Phys. Rev. D91 (2015) 032003.
- [43] The Pierre Auger Coll., Phys. Rev. Lett. 117 (2016) 192001.
- [44] The Pierre Auger Coll., Phys. Rev. D 90 (2014) 012012; D90 (2014) 039904(A); D92 (2015) 019903(E).
- [45] F.Sanchez [Pierre Auger Coll.], PoS(ICRC2019) 411.
- [46] F.Riehn [Pierre Auger Coll.], PoS(ICRC2019) 404.
- [47] R.Guedes Lang [Pierre Auger Coll.], PoS(ICRC2019) 327.
- [48] R.Guedes Lang et al., Astrophys.J. 853 (2018) 23.
- [49] A.Castellina [Pierre Auger Coll.], EPJ Web Conf. 210 (2019) 06002.
- [50] J.Pekala [Pierre Auger Coll.], PoS(ICRC2019) 380.
- [51] D.Nitz [Pierre Auger Coll.], PoS(ICRC2019) 370.
- [52] M.Bohacova [Pierre Auger Coll.], PoS(ICRC2019) 199.
- [53] B.Pont [Pierre Auger Coll.], PoS(ICRC2019) 395.
- [54] A.M.Botti [Pierre Auger Coll.], PoS(ICRC2019) 202.
- [55] A. Letessier-Selvon et al., Nucl. Instrum. Meth. A767 (2014) 41.
- [56] D.Maurel et al., Proc. 33th ICRC (2013) 600.
- [57] The Pierre Auger Coll., JCAP 2018 (2018) 026.
- [58] A.Taboada [Pierre Auger Coll.], PoS(ICRC2019) 434.
- [59] M.Wirtz [Pierre Auger Coll.], PoS(ICRC2019) 469.
- [60] R.Mussa [Pierre Auger Coll.], PoS(ICRC2019) 1131.
- [61] M.Schimassek [Pierre Auger Coll.], PoS(ICRC2019) 1147.
- [62] J.Glombitza [Pierre Auger Coll.], PoS(ICRC2019) 270.
- [63] M.Gottowik [Pierre Auger Coll.], PoS(ICRC2019) 274.
- [64] O.Deligny [Pierre Auger Coll.], PoS(ICRC2019) 234.
- [65] A.Barbano [Pierre Auger Coll.], PoS(ICRC2019) 842.
- [66] B.Garcia [Pierre Auger Coll.], PoS(ICRC2019) 265.
- [67] The Pierre Auger Coll., arXiv:1909.09073 (2019).