Stellar Velocity Dispersion of a Massive Quenching Galaxy at
Abstract
We present the first stellar velocity dispersion measurement of a massive quenching galaxy at . The galaxy is first identified as a massive galaxy with suppressed star formation from photometric redshifts based on deep multi-band data. A follow-up spectroscopic observation with MOSFIRE on Keck revealed strong multiple absorption features, which are identified as Balmer lines, giving a secure redshift of . This is the most distant quiescent galaxy known to date. Thanks to the high S/N of the spectrum, we are able to estimate the stellar velocity dispersion, , making a significant leap from the previous highest redshift measurement at . Interestingly, we find that the velocity dispersion is consistent with that of massive galaxies today, implying no significant evolution in velocity dispersion over the last 12 Gyr. Based on an upper limit on its physical size from deep optical images ( kpc), we find that its dynamical mass is consistent with the stellar mass inferred from photometry. Furthermore, the galaxy is located on the mass fundamental plane extrapolated from lower redshift galaxies. The observed no strong evolution in suggests that the mass in the core of massive galaxies does not evolve significantly, while most of the mass growth occurs in the outskirts of the galaxies, which also increases the size. This picture is consistent with a two-phase formation scenario in which mass and size growth is due to accretion in the outskirts of galaxies via mergers. Our results imply that the first phase may be completed as early as .
1 Introduction
The majority of massive galaxies in the local Universe have not been actively forming stars for billion years. Their spectroscopic properties are consistent with an intense starburst occurred in the early Universe followed by passive evolution (e.g., Thomas et al. 2005; Gallazzi et al. 2005; Renzini 2006). The recent advent of sensitive near-IR spectrographs has allowed us to reach close to their primary formation epoch. There are a handful of massive quiescent galaxies confirmed out to (Glazebrook et al., 2017; Schreiber et al., 2018). Detailed photometric analyses suggest that they indeed seem to form in a short and intense starburst, followed by rapid quenching (Schreiber et al., 2018). However, the physics of this entire process still remains unclear.
A key parameter for characterizing quiescent galaxies is the stellar velocity dispersion, which is an integrated motion of stars along the line of sight. It exhibits tight correlations with other fundamental properties of galaxies (e.g., the fundamental plane; Djorgovski & Davis 1987). It is also the best predictor of stellar age with no residual correlation between size and age at fixed velocity dispersion (van der Wel et al., 2009; Graves et al., 2009). The velocity dispersion measurement is observationally challenging due to the demanding S/N ratio of rest-frame optical spectra. It has been measured out to with the help of gravitational lensing effects (Hill et al., 2016). Although quiescent galaxies have been confirmed at higher redshifts, their dynamical properties remain unknown. This is unfortunate because dynamical information may also hold a key to understanding how these galaxies form.
This paper presents the spectroscopic confirmation of a massive quenching galaxy at , the most distant galaxy with suppressed star formation rate (SFR) known to date. The paper further presents the measurement of its stellar velocity dispersion, opening a new window to explore dynamical properties of massive galaxies at . A companion paper (Valentino et al., 2019) discusses star formation histories and progenitors of this and other galaxies at in detail. We first summarize our observation in Section 2, and then present spectral analyses in Section 3. Measurements of the physical size and discussions of its dynamical properties are given in Sections 4 and 5, respectively. Finally, we discuss implications of our results and conclude the paper in Section 6. We adopt , , and , unless otherwise stated. Magnitudes are in the AB system.
2 Observation
2.1 Target Selection
We select massive quiescent galaxy candidates located at using deep multi-wavelength data available in Subaru/XMM-Newton Deep Field. We have compiled photometry measured in a consistent manner and applied a photometric redshift code from Tanaka (2015) to infer redshifts as well as SFR and stellar mass. Further details are given in Kubo et al. (2018). We define galaxies with upper limit of specific SFR below as quiescent galaxies. These candidates are typically . Among them, there is one outstandingly bright galaxy with , which is the subject of the paper. There is no nearby galaxy or galaxy cluster, and this object is not strongly lensed. Fig. 1 (right panel) shows the SED of the object. It is a massive galaxy at exhibiting a prominent Balmer break, which is indicative of a recent starburst a few hundred Myr ago. The SFR inferred from the fit is low for its stellar mass; SFR and , giving a specific SFR of . The object is about 1 dex below the sequence of star forming galaxies on a SFR vs. diagram and it is likely that this galaxy recently quenched (see Valentino et al. 2019 for further discussions).
2.2 Observation and Data Reduction
We were allocated the first half nights of the 20–21 December 2018 to follow-up the target with Keck/MOSFIRE. The observing conditions were good and the seeing was around 0.7 arcsec. Each exposure was 180 seconds long and the classical ABBA nodding was applied along the slit. The total integration time was 7.75 hours. A bright star was put in the mask, which allowed us to keep a track of changes in the observing conditions. 7% of the exposures with low fluxes from the bright star were excluded due to poor seeing and/or poor alignment. The data were processed in a standard manner using the MOSFIRE DRP 2018 release. A0V stars were observed as spectrophotometric standards twice per night. The flux calibration vectors derived from those stars were consistent at a few percent level on both nights. The vectors were averaged and the mean flux calibration vector was applied to the extracted 1d spectra.
Fig. 1 shows the spectrum. There are four prominent absorption lines, which were identified as H to H. There is also H on the edge. We confirm the redshift to be . This proves the accuracy of our photometric redshift estimate (). There is no emission line in the spectrum, and upper limit on (unobscured) SFR from H is . There is no IR detection either. All this confirms the quiescent nature of the galaxy (see Valentino et al. 2019).
3 Spectral Fit
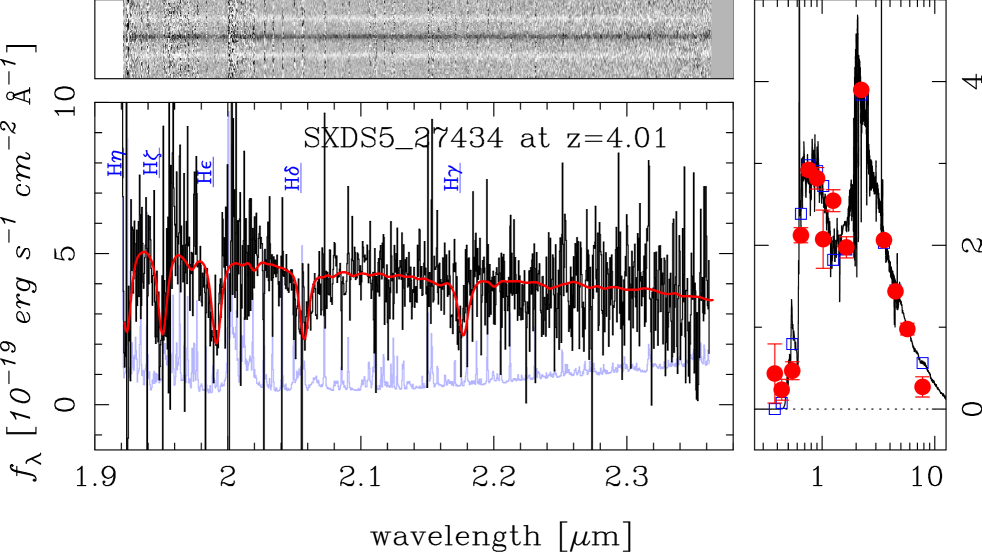
We fit the observed MOSFIRE spectrum using ppxf (Cappellari, & Emsellem, 2004; Cappellari, 2017). We use the simple stellar population models from Vazdekis et al. (2010) for the fit. We exclude all models that are older than the age of the Universe at the redshift of the object. We also exclude models with sub-solar metallicity as we are focusing on a massive galaxy. Since the rest-frame spectral resolution of the MOSFIRE spectrum is slightly higher than that of the library, we apply Gaussian smoothing to match the resolution. We use an additive correction function of order 1 (i.e., linear) and no multiplicative correction. Our results are not sensitive to the choices here.
The best-fit spectrum is shown in red in Fig. 1. All observed Balmer absorption lines are fit very well, and the overall fit has . In addition, thanks to the high S/N of the spectrum ( per resolution element), we measure a velocity dispersion of . The uncertainty here is based on a Monte-Carlo simulation; we perturb the observed spectrum using the noise spectrum and repeat the fits. The quoted uncertainty is the 68th percentile of the distribution from the Monte-Carlo fits. If we use the Indo-US stellar spectral library (Valdes et al., 2004) instead of Vazdekis so that we do not need to smooth the MOSFIRE spectrum, we obtain a consistent stellar velocity dispersion (). We also have confirmed that emission line in-filling does not affect our measurement either; we repeat the fits by excluding H and H and obtain a fully consistent measurement, .
4 Physical Size
In order to fully utilize the stellar velocity dispersion, we are interested in structural properties of the galaxy, in particular its size. The typical rest-frame optical size of galaxies is very small (; Kubo et al. 2018), and adaptive optics assisted observations or high spatial resolution imaging with the Hubble Space Telescope (HST) are an ideal way to measure the size of the galaxy. Unfortunately, there is no existing HST data for the galaxy and Kubo et al. (2018) did not observe the galaxy with AO.
However, a useful upper limit on the size can still be obtained from the ground-based data. We use deep optical data from Hyper Suprime-Cam Subaru Strategic Program (HSC-SSP; Aihara et al. 2018, 2019) and demonstrate how well we can reproduce the sizes measured from HST. The -band image from HSC-SSP processed with the pipeline designed for LSST (Jurić et al., 2017; Bosch et al., 2018; Ivezić et al., 2019) is used here to measure sizes due to superior seeing than the other bands. We retrieve objects with similar -band magnitudes to the galaxy () in UltraDeep-SXDS, which is the same field as UDS, in which the galaxy is located, and run galfit (Peng et al., 2002, 2010) to measure their effective radii adopting the Sersic profile. We use the variance image to generate a sigma map and use the ’coadd PSF’ (Bosch et al., 2018) as an input PSF image. The PSF has FWHM arcsec. We perform a Monte-Carlo run by slightly perturbing the initial centroid, position angle, effective radius and brightness. We fix the Sersic index to a randomly drawn value between 0.5 and 4 in each run. We use the fit with the smallest as the best estimate and as the 68th percentile interval.
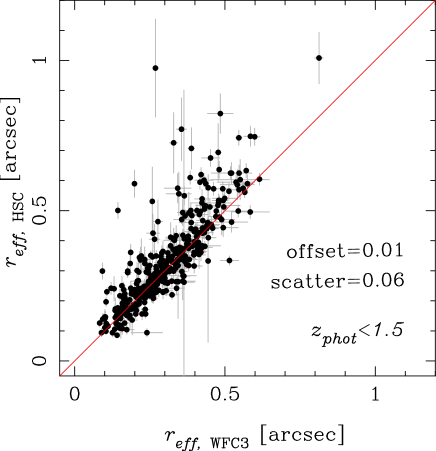
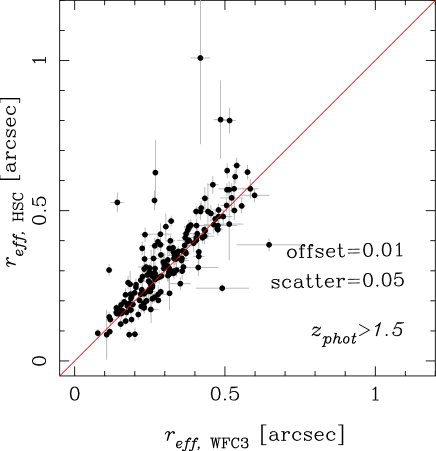
Fig. 2 compares the size measurements between HSC and HST. The HST sizes are taken from van der Wel et al. (2014) and are measured in the WFC3/F160W filter. We split the sample into low and high redshift ranges using the photo- described in Section 2.1. These two panels give a quantitative estimate of the rest-frame wavelength dependence of the size measurements. Interestingly, we observe equally good correlation between the two measurements down to arcsec in both plots. If we define outliers as arcsec, the outlier rate is about 4% in both plots. This good correlation is likely due to the depth of the HSC data (the depth is mag) and also to the good PSF model. Other studies also have shown that sizes can be measured to FWHM (van der Wel et al., 2014) for high S/N and adequate spatial sampling. It is encouraging that there seems no major evidence for large morphological k-corrections in the size measurements. We note that van der Wel et al. (2014) also find that the wavelength dependence of size is not very strong for quiescent galaxies.
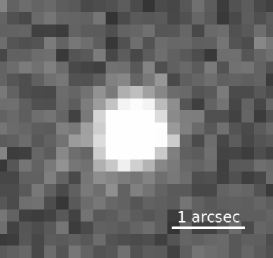
Adopting this size measurement procedure for the galaxy, we find the best size estimate of arcsec ( kpc). This size is fully consistent with the typical size of massive quiescent galaxies from Kubo et al. (2018). Fig. 3 shows the object, best-fit model, and residual images, demonstrating an excellent fit. Figs. 2 and 3 suggest that our estimate here is likely reasonable, but to be fully conservative, we primarily use the upper limit on the size in what follows; (random) (systematic corresponding to 0.05 arcsec observed scatter) .
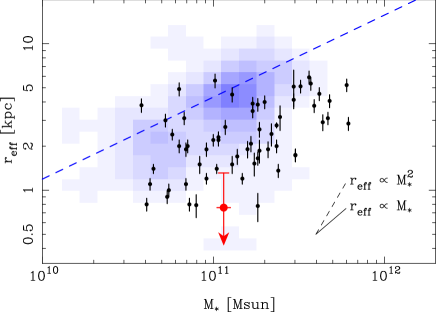
The left panel of Fig. 4 shows against stellar mass. In addition to the galaxy, the figure also includes lower redshift galaxies for comparison; quiescent galaxies at from a compilation of literature and galaxies from the LEGA-C survey (van der Wel et al., 2016; Straatman et al., 2018) cross-matched with the size measurements from van der Wel et al. (2014). Quiescent galaxies among the LEGA-C galaxies are selected using the multi-band classification from Laigle et al. (2016). The galaxy is compact for its stellar mass, and it is physically smaller than and other lower redshift galaxies. This clear redshift trend is consistent with Kubo et al. (2018).
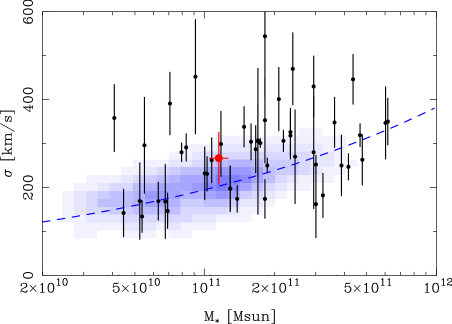
In contrast, the stellar velocity dispersion of the galaxy plotted in the right panel is largely consistent with those of the lower redshift galaxies. There is a possible hint that low redshift galaxies from LEGA-C and SDSS have a slightly lower velocity dispersion. However, the difference, if any, is fairly modest. This indicates that the stellar velocity dispersion has not significantly evolved over the last 12 Gyr. This is an intriguing result because the size and mass are known to evolve significantly over this time period.
5 Dynamical Analysis
Using the size from the previous section, we estimate the galaxy’s dynamical mass as
| (1) |
where is (Cappellari et al., 2006). As discussed in the same paper, a constant also works well. Given the unconstrained for our object, we adopt here, which yields with an upper limit of .
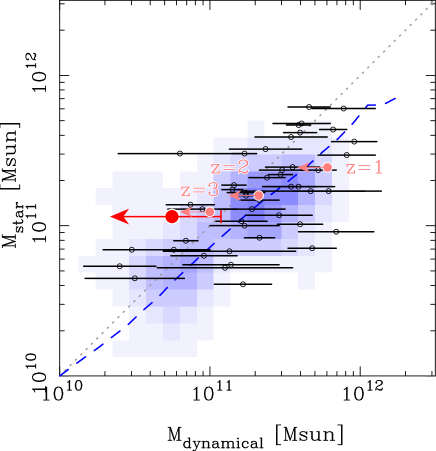
Fig. 5 (left panel) compares the stellar mass with the dynamical mass estimated here. The stellar mass of the object is consistent with the dynamical mass. We use the Chabrier IMF here (Chabrier, 2003). This consistency is encouraging because this confirms the accuracy of our photometry-based estimate of stellar mass, which then implies that assumptions employed such as the initial mass function are reasonable. The galaxy is expected to increase its size and stellar mass with time through mergers. Marchesini et al. (2014) estimated the likely stellar mass growth from abundance matching, and Kubo et al. (2018) followed the size growth of these galaxies on the stellar mass evolutionary track from Marchesini et al. (2014). From these results, we can make a prediction for how the galaxy will evolve in the vs. plane. If we assume that the velocity dispersion does not change with time, which is the assumption also taken by, e.g., Belli et al. (2017), the expected location of the descendant of the galaxy is shown as the pink points (Fig, 5). The expected evolutionary track shows an increase in the dynamical mass with a smaller increase in the stellar mass. If minor mergers entirely drive the evolution and velocity dispersion does not change over time, we expect . As the size growth observed by Kubo et al. (2018) is close to the maximum growth rate expected from minor mergers, the evolutionary track is indeed close to .
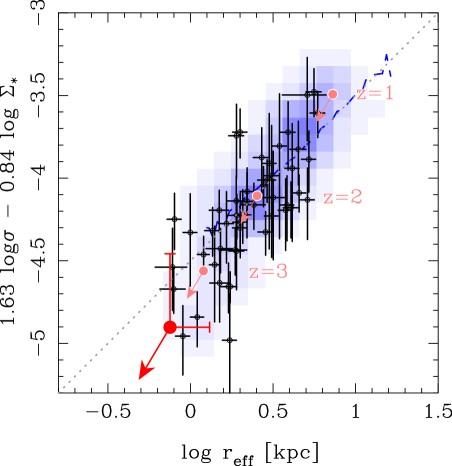
In the local Universe, early-type galaxies are known to show a tight relationship between effective radius, mean intensity, and velocity dispersion (i.e., fundamental plane; Djorgovski & Davis 1987). The evolution of the fundamental plane is mostly due to the evolving stellar mass to luminosity ratio due to stellar aging. The mass fundamental plane, which replaces luminosity with stellar mass, has been suggested in the literature to largely remove that effect (Bezanson et al., 2013). Fig. 5 (right panel) shows the mass fundamental plane.
The galaxy is located at the bottom left part of the distribution of the lower redshift galaxies as expected from its small size and high stellar density. The evolutionary track with constant velocity dispersion is along the locations of the lower redshift objects and the galaxy will likely be among the most massive galaxies at each epoch. This in turn implies that the velocity dispersion does not evolve significantly. If it had changed by a factor of, e.g., 2 by , the expected location of the descendant galaxy would be inconsistent with the observed galaxies.
We also briefly discuss the classical fundamental plane. The interpretation of its evolution is not straightforward, but assuming that the evolution in the fundamental plane is entirely due to the luminosity evolution for simplicity, we find that the galaxy is dex off in in the rest-frame -band from the local relation (recall that we have only an upper limit on size). A simple stellar population model from Bruzual, & Charlot (2003) predict a luminosity evolution of a factor of , or equivalently dex, adopting the luminosity-weighted age of Gyr (Valentino et al., 2019) for the galaxy. The fundamental plane evolution therefore is consistent with the pure luminosity evolution, although the uncertainty here is rather large and we do not discuss further at this point.
6 Summary and Discussion
We have presented spectroscopic confirmation of a massive galaxy being quenched at , which is the most distant example known to date. Thanks to the high S/N of the spectrum, we are able to measure its stellar velocity dispersion, . The size estimate based on the deep optical data is with an upper limit of , which is consistent with the typical size of massive quiescent galaxies from Kubo et al. (2018). Combining the velocity dispersion and size, we find that the dynamical mass is consistent with the stellar mass inferred from photometry. Also, the galaxy is on the mass fundamental plane and the expected evolutionary path of the galaxy is consistent with the massive quiescent galaxies at lower redshifts.
The most striking finding of this work is that the stellar velocity dispersion of the massive galaxy at is consistent with that of massive galaxies at lower redshifts. This is in contrast to the very large velocity dispersion of a galaxy reported by van Dokkum et al. (2009), . The galaxy is expected to increase its mass by a factor of (Marchesini et al., 2014) and size by a factor of (Kubo et al., 2018) by . However, the stellar velocity dispersion evolution is significantly weaker; Fig. 4 (right) shows that even the most massive galaxies at lower redshifts have only slightly larger velocity dispersion. This finding indicates that the size and mass evolution does not significantly increase the total mass contained in the core of these massive galaxies. This has significant implications for how galaxies increase their size and mass; galaxies do not increase mass equally at all radii, and instead most of the mass growth occurs in the outer parts perhaps through minor mergers, which also increases the effective radius. This is fully consistent with the two-phase formation scenario (Naab et al., 2007; Oser et al., 2010). In fact, simulations show only a mild evolution in velocity dispersion (Oser et al., 2012), in agreement with our observation here. An interesting implication here is that the first of the two phases, namely the formation of the dense core, may be completed as early as .
It is, however, not clear whether the galaxy is a dispersion-dominated system. Recent work finds that massive galaxies at exhibit significant rotational motion (Toft et al., 2017; Newman et al., 2018). Simulations predict a relatively small if massive galaxies at high redshifts form in starbursts triggered by dissipative mergers (Wuyts et al., 2010). The reported large rotational motion favors formation through disk instabilities. It is possible that the galaxy also rotates, potentially complicating the interpretation above. But, given the absence of sufficient spatial resolution to resolve any rotational motion from the MOSFIRE data nor even an ellipticity measurement from the imaging, we have to await further observations to reveal of the galaxy. The large rotational motion, if present, has to be damped at lower redshifts because the majority of the most massive galaxies in the local Universe are slow rotators (e.g., Veale et al. 2017). Mergers may be able to do the job (Lagos et al., 2018).
Prior to this work, the most distant velocity dispersion measurements were made at with a help of a gravitational lensing effect (Hill et al., 2016; Newman et al., 2018). This work makes a major leap in redshift without lensing and demonstrates that the current facilities have an ability to confirm redshifts and measure the stellar velocity dispersion of the brightest galaxies at . Massive galaxies at such redshifts are rare, but ongoing/upcoming massive imaging surveys will be able to construct a significantly larger sample, which can then be followed up spectroscopically to further extend the work presented here.
References
- Aguado et al. (2019) Aguado, D. S., Ahumada, R., Almeida, A., et al. 2019, ApJS, 240, 23
- Ahn et al. (2014) Ahn, C. P., Alexandroff, R., Allende Prieto, C., et al. 2014, ApJS, 211, 17
- Aihara et al. (2018) Aihara, H., Arimoto, N., Armstrong, R., et al. 2018, PASJ, 70, S4
- Aihara et al. (2019) Aihara, H., AlSayyad, Y., Ando, M., et al. 2019, arXiv e-prints, arXiv:1905.12221
- Belli et al. (2017) Belli, S., Newman, A. B., & Ellis, R. S. 2017, ApJ, 834, 18
- Bezanson et al. (2013) Bezanson, R., van Dokkum, P., van de Sande, J., et al. 2013, ApJ, 764, L8
- Bezanson et al. (2013) Bezanson, R., van Dokkum, P. G., van de Sande, J., et al. 2013, ApJ, 779, L21
- Bosch et al. (2018) Bosch, J., Armstrong, R., Bickerton, S., et al. 2018, PASJ, 70, S5
- Bruzual, & Charlot (2003) Bruzual, G., & Charlot, S. 2003, MNRAS, 344, 1000
- Cappellari, & Emsellem (2004) Cappellari, M., & Emsellem, E. 2004, PASP, 116, 138
- Cappellari et al. (2006) Cappellari, M., Bacon, R., Bureau, M., et al. 2006, MNRAS, 366, 1126
- Cappellari (2017) Cappellari, M. 2017, MNRAS, 466, 798
- Chabrier (2003) Chabrier, G. 2003, PASP, 115, 763
- Djorgovski & Davis (1987) Djorgovski, S., & Davis, M. 1987, ApJ, 313, 59
- Gallazzi et al. (2005) Gallazzi, A., Charlot, S., Brinchmann, J., et al. 2005, MNRAS, 362, 41
- Glazebrook et al. (2017) Glazebrook, K., Schreiber, C., Labbé, I., et al. 2017, Nature, 544, 71
- Graves et al. (2009) Graves, G. J., Faber, S. M., & Schiavon, R. P. 2009, ApJ, 698, 1590
- Hill et al. (2016) Hill, A. R., Muzzin, A., Franx, M., et al. 2016, ApJ, 819, 74
- Ivezić et al. (2019) Ivezić, Ž., Kahn, S. M., Tyson, J. A., et al. 2019, ApJ, 873, 111
- Jurić et al. (2017) Jurić, M., Kantor, J., Lim, K.-T., et al. 2017, Astronomical Data Analysis Software and Systems XXV, 279
- Kubo et al. (2018) Kubo, M., Tanaka, M., Yabe, K., et al. 2018, ApJ, 867, 1
- Lagos et al. (2018) Lagos, C. del P., Stevens, A. R. H., Bower, R. G., et al. 2018, MNRAS, 473, 4956
- Laigle et al. (2016) Laigle, C., McCracken, H. J., Ilbert, O., et al. 2016, ApJS, 224, 24
- Marchesini et al. (2014) Marchesini, D., Muzzin, A., Stefanon, M., et al. 2014, ApJ, 794, 65
- Naab et al. (2007) Naab, T., Johansson, P. H., Ostriker, J. P., et al. 2007, ApJ, 658, 710
- Newman et al. (2018) Newman, A. B., Belli, S., Ellis, R. S., et al. 2018, ApJ, 862, 125
- Newman et al. (2018) Newman, A. B., Belli, S., Ellis, R. S., et al. 2018, ApJ, 862, 126
- Onodera et al. (2012) Onodera, M., Renzini, A., Carollo, M., et al. 2012, ApJ, 755, 26
- Oser et al. (2010) Oser, L., Ostriker, J. P., Naab, T., et al. 2010, ApJ, 725, 2312
- Oser et al. (2012) Oser, L., Naab, T., Ostriker, J. P., et al. 2012, ApJ, 744, 63
- Peng et al. (2002) Peng, C. Y., Ho, L. C., Impey, C. D., et al. 2002, AJ, 124, 266
- Peng et al. (2010) Peng, C. Y., Ho, L. C., Impey, C. D., et al. 2010, AJ, 139, 2097
- Renzini (2006) Renzini, A. 2006, ARA&A, 44, 141
- Schreiber et al. (2018) Schreiber, C., Glazebrook, K., Nanayakkara, T., et al. 2018, A&A, 618, A85
- Shen et al. (2003) Shen, S., Mo, H. J., White, S. D. M., et al. 2003, MNRAS, 343, 978
- Straatman et al. (2018) Straatman, C. M. S., van der Wel, A., Bezanson, R., et al. 2018, ApJS, 239, 27
- Strauss et al. (2002) Strauss, M. A., Weinberg, D. H., Lupton, R. H., et al. 2002, AJ, 124, 1810
- Tanaka (2015) Tanaka, M. 2015, ApJ, 801, 20
- Thomas et al. (2005) Thomas, D., Maraston, C., Bender, R., et al. 2005, ApJ, 621, 673
- Toft et al. (2012) Toft, S., Gallazzi, A., Zirm, A., et al. 2012, ApJ, 754, 3
- Toft et al. (2017) Toft, S., Zabl, J., Richard, J., et al. 2017, Nature, 546, 510
- van der Wel et al. (2009) van der Wel, A., Bell, E. F., van den Bosch, F. C., et al. 2009, ApJ, 698, 1232
- van der Wel et al. (2014) van der Wel, A., Franx, M., van Dokkum, P. G., et al. 2014, ApJ, 788, 28
- van der Wel et al. (2016) van der Wel, A., Noeske, K., Bezanson, R., et al. 2016, ApJS, 223, 29
- van de Sande et al. (2013) van de Sande, J., Kriek, M., Franx, M., et al. 2013, ApJ, 771, 85
- van Dokkum et al. (2009) van Dokkum, P. G., Kriek, M., & Franx, M. 2009, Nature, 460, 717
- Valdes et al. (2004) Valdes, F., Gupta, R., Rose, J. A., et al. 2004, ApJS, 152, 251
- Valentino et al. (2019) Valentino, F., Tanaka, M., Davidzon, I., et al. 2019, arXiv:1909.10540
- Vazdekis et al. (2010) Vazdekis, A., Sánchez-Blázquez, P., Falcón-Barroso, J., et al. 2010, MNRAS, 404, 1639
- Veale et al. (2017) Veale, M., Ma, C.-P., Greene, J. E., et al. 2017, MNRAS, 471, 1428
- York et al. (2000) York, D. G., Adelman, J., Anderson, J. E., et al. 2000, AJ, 120, 1579
- Wuyts et al. (2010) Wuyts, S., Cox, T. J., Hayward, C. C., et al. 2010, ApJ, 722, 1666
- Zahid et al. (2016) Zahid, H. J., Geller, M. J., Fabricant, D. G., et al. 2016, ApJ, 832, 203